Copyright © 2019 Inderscience Enterprises Ltd.
The use of poison pills by US firms over the period
1997–2015: what has been their impact on
shareholder value?
Duarte Pitta Ferraz
Nova School of Business and Economics, Universidade Nova de Lisboa,
Campus de Campolide, 1099-032 Lisbon, Portugal Email: [email protected]
Ilídio Tomás Lopes*
Business Research Unit (BRU-IUL),Instituto Universitário de Lisboa (ISCTE-IUL), Av. das Forças Armadas, 1649-026, Lisbon, Portugal Email: [email protected]
*Corresponding author
Simon Hitzelberger
Nova School of Business and Economics, Universidade Nova de Lisboa,
Campus de Campolide, 1099-032 Lisbon, Portugal Email: [email protected]
Abstract: Poison pills are controversial devices for which no common conclusion as to how the market reacts to their adoption exists. This research collates 4,479 poison pill adoption events by US companies over the period 1997–2015. Statistically significant insights and positive abnormal returns were found on the day the poison pill was adopted. It is for this reason that we argue in favour of the shareholder wealth-maximisation hypothesis, stating that poison pills protect shareholders by providing management a superior bargaining position. The shareholders react positively to poison pill adoption, particularly if a hostile takeover attempt is anticipated. Furthermore, shareholders seem to value the protective effect of the device, which both provides management a superior bargaining position and allows the maximal possible bid premium to be negotiated.
Keywords: corporate governance; poison pills; shareholder wealth; antitakeover statute; hostile takeover; value creation.
Reference to this paper should be made as follows: Ferraz, D.P., Lopes, I.T. and Hitzelberger, S. (2019) ‘The use of poison pills by US firms over the period 1997–2015: what has been their impact on shareholder value?’, Int. J.
Biographical notes: Duarte Pitta Ferraz is a Professor of Governance and Banking from the NOVA, School of Business and Economics in which he is responsible for the M&A course. He is also a Doctor of Business Administration from the Nottingham Business School, Statutory Auditor from the ROC, Portugal and Independent Non-Executive Director in Portugal and abroad (financial and non-financial sectors). He has worked in auditing for 13 years and banking for 20 years.
Ilídio Tomás Lopes is a Professor of Accounting and Auditing from the Instituto Universitário de Lisboa (ISCTE-IUL) and researcher from the Business Research Unit (BRU-IUL). He is also an undergraduate in Business Administration. He has obtained his Master’s in Statistics and Information Management and a PhD in Management, specialising in accounting from the University of Coimbra, Portugal. His research is in the fields of financial accounting, corporate governance, auditing, business and performance and research methodologies.
Simon Hitzelberger obtained his MSc in Finance double degree from the Nova School of Business and Economics and Maastricht University School of Business and Economics and Bachelor’s in International Business from the Munich Business School. He works at the KPMG Financial Services in Germany and previously worked at the Rodl & Partner, PwC and UniCredit.
1 Introduction
Over the last decades, several researches have assessed the impact of an antitakeover statute and how it affects the ability of a firm to defend itself (Ryngaert, 1998; Datta and Iskanadar-Datta, 1996; Sundaramurthy et al., 1997; Goh and Caton, 2008; Sikes et al., 2014; Heron and Lie, 2015; Wanasika and Limbu, 2015; Catan and Kahan, 2016; Schepter et al., 2016). Other approaches are focused on the necessity to improve criminal and legal antitakeover measures (Shapoval et al., 2017), arguing that special structures are required to regulate the merger and acquisition transactions in the globalised stock markets.
Martin Lipton invented the poison pill concept in 1982 (Sunder, 2014; Wanasika and Limbu, 2015) and has the original intention to buy management time to consider the consequences of a takeover on other stakeholders and its implication on the firms’ value and performance over the years to come. Poison pills provide shareholders special rights. These rights, sometimes referred as the ‘shareholder rights plan’, make it difficult for other parties to obtain control over the firm. The pill ‘poisons’ any possible acquirer, as the takeover gets disproportionally expensive. In the USA, poison pills can be implemented by management without shareholder approval. Therefore, a clear understanding of shareholder reaction to poison pill adoption is necessary in order to evaluate its impact properly.
The literature focuses on two opposing hypotheses concerning the market reaction to poison pill adoption. The first, the managerial entrenchment hypothesis, states that poison pills isolate management from the positive forces of the corporate-control market. A constant threat of takeover is supposed to be a natural mechanism to reduce agency costs. Poison pills protect management from this external influence and consequently
deteriorate the principal agent conflict. Management can act according to personal benefits and interests. As a consequence, they choose inappropriate strategies that do not maximise the wealth of shareholders (Sundaramurthy et al., 1997). On the other hand, the shareholder wealth-maximisation hypothesis defines anti-takeover provisions as rational devices that protect shareholders. According to this hypothesis, the power of rejecting undesirable raiders is in the long-term interest of shareholders (Yeh, 2014). In general, the long-term prosperity of a company should take preference over short-term profits. The shareholder wealth maximisation hypothesis is supported by two independent arguments: firstly, poison pills establish a superior bargaining position; and secondly, these devices enable management to extract the maximum bid premium (Datta and Iskandar-Datta, 1996).
Concerning these hypotheses, the empirical findings show controversial results. The early literature mostly supports the managerial entrenchment hypothesis (Ryngaert, 1988). Recent research tends to argue in favour of the shareholder wealth maximisation hypothesis (Schepter et al., 2016).
This research aims to analyse 4,479 poison pill adoption events by US companies over the period January 1997–December 2015, in order to conclude whether poison pills use has impact, or not, on shareholder value.
2 Literature review
Previous researches about antitakeover defences have found mixed results about its impact on firm value and performance and only a few studies have been focused on specific industries (Wanasika and Limbu, 2015). In line with similar studies published over the last decades (Wanasika and Limbu, 2015; Catan and Kahan, 2016; Shapoval et al., 2017), Malatesta and Walkling (1988) analyse shareholder reactions to poison pill adoption and the industry characteristics of the adopting firm. Their sample of 118 poison pill adoptions indicates a decline in stock price and, as a consequence, supports the managerial entrenchment hypothesis. They also find that firms which adopt a poison pill have a higher probability of being taken over than the non-adopting counterparties (Malatesta and Walkling, 1988).
At a similar point in time, Ryngaert (1988) analysed a sample of 380 adoptions between 1982 and 1986. All in all, the market reaction for the full sample is negative with an average abnormal return of –0.03%. Additionally, he differentiates between the variations of poison pills, finding that only the most preventive variations entrench management (Ryngaert, 1988).
Datta and Iskandar-Datta (1996) examine the effects of anti-takeover provisions on the wealth of shareholders as well as bondholders. Their results relating to stock market reaction remain insignificant. However, the outcome of statistically significant bondholder losses is consistent with the managerial entrenchment hypothesis. In the case of a takeover, corporate bondholders are more sensitive to losses than shareholders are, as they have fewer rights. Firms that adopt poison pills also underperform in contrast to their industry peers when it comes to key performance figures. The outcomes suggest that the adoption of poison pills is stimulated by poorly skilled managers trying to isolate themselves from the transaction in the corporate control market (Datta and Iskandar-Datta, 1996).
Sundaramurthy et al. (1997) find a negative market reaction in their data sample of 486 adoptions between 1984 and 1988. These authors argue that the extent of the reaction is dependent on the firm’s board structure. The company board is responsible for maximising shareholder value, taking important decisions and employing key personnel (Sundaramurthy et al., 1997). The separation of the CEO and the position of chair increases transparency and reduce agency costs; the segmentation also has the effect of shrinking the negative market reaction. However, the negative market reaction increases if the firm’s board is dominated by persons of authority coming from the outside.
Sikes et al. (2014) also find a significantly negative market reaction to poison pill adoption, supporting the managerial entrenchment hypothesis. Moreover, this empirical study considers the effect of 62 poison pill announcements that are due to net operating losses (NOL pills). These pills are adopted to protect tax losses, which would disappear in case of a change of ownership. Empirical research finds an increased negative market reaction to NOL pills. The management’s purpose does not appear credible to shareholders and therefore agency costs increase (Sikes et al., 2014).
Yeh (2014) analysed the market reaction to the adoption of anti-takeover defences for 130 Japanese firms between 2005 and 2007. The paper underlines the managerial entrenchment hypothesis by detecting statistically significant negative abnormal returns for various time periods.
Goh and Caton (2008) evolve the hypothesis that market reaction to poison pill adoption depends on the governance structure of the firm ex ante. They distinguish between ‘democratically’ run firms without anti-takeover provisions in place, and firms that act ‘autocratically’ when takeover defences are presented. Companies classified as ‘democratic’ isolated management from efficient market conditions whereby firms can be significantly undervalued. In this case, the adoption of a poison pill supports management and helps to put focus on long-term benefits instead of short-term pressure. This, in turn, reduces the principal agent conflict. As a consequence, the most democratically governed companies show significant positive abnormal returns as well as positive long-term earnings growth-forecasts after poison pill adoption.
Most recently, Schepter et al. (2016) found poison pills to be devices that send ‘equivocal signals’. They stressed that firm and bidder have contrary interests and insist that the distinction is essential because as a result this controls the differences of poison pills adopted, either to protect net operating losses (NOL poison pills) or adopted when the firm receives an acquisition threat. The empirical results state a positive investor reaction when the poison pill is in place to deflect a takeover offer. However, NOL poison pills cause a negative market reaction. This is due to the fact that poison pills are mostly used for defence purposes, evidence which is interpreted as support for the shareholder wealth maximisation hypothesis (Schepter et al., 2016).
In their series of ‘framing controversial actions’, Rhee and Fiss (2014) provide an additional event study methodology and content analysis to evaluate the market reaction to poison pill adoptions from 1983 to 2008. The authors argue that market reaction depends on the contextual attributes. On the one hand, poison pill adoptions with an ‘institutional logic’ as their basis lead to positive abnormal returns; and on the other hand, statements by managers with possible selfish interests, which show a significant negative market reaction, should not be ignored.
Heron and Lie (2015) investigated the legal validations of poison pills by the Delaware Supreme Court. After the Moran v. Household decision in 1985, two important
validations were adjudicated in the ‘1995 Delaware rulings’. Previous literature describes these rulings as an exogenous shock for managerial entrenchment. This assumption is refuted by Heron and Lie in their paper: they do not find evidence that the ‘1995 Delaware rulings’ increased managerial entrenchment. In fact, according to these authors, further analysis implies that poison pills in general do not entrench management. Instead, based on a sample of takeovers from 1985 to 2009, they show that poison pills enhance the takeover premiums for shareholders (Heron and Lie, 2015).
In line with Comment and Schwert (1995), anti-takeover provisions enhance the bargaining position of the firm in a possible takeover. As a result, shareholder wealth is enhanced by higher premiums.
Heron and Lie (2006) search evidence for the market reaction of poison pills by analysing 526 hostile takeover attempts. They state that poison pills are in the best interest of shareholders. This hypothesis is valid for ‘routine pills’ as well as ‘morning-after pills’ that have been implemented as a consequence of a takeover attempt. Poison pills increase the bargaining position of a company and therefore enhance the takeover premium. Heron and Lie worry about the new trend in shareholder activism to repeal poison pills. They also criticise academics who punish firms for anti-takeover provisions in their governance indexes (Heron and Lie, 2006).
Forjan and Van Ness (2003) also argue in favour of poison pill adoption as they result in positive abnormal returns as well as increased bargaining power for management. Furthermore, they find there is a relationship between capital structure and the perceived strength of poison pills. Abnormal returns on the day of the announcement and the firm-debt asset ratio are significantly positively correlated. As a result, highly leveraged firms are described as witnessing more bargaining power in the event of a takeover bid (Forjan and Van Ness, 2003).
It is of great interest to understand the facts behind what has already been discussed in the above sections in relation to the adoption of poison pills. So far, it can be claimed that there are no common conclusions to draw in relation to market reaction to poison pill adoption; the practice appears not to call for or result in a single outcome. Poison pills are indeed one of the most controversial anti-takeover provisions discussed in the empirical literature (Sunder, 2014). Evidence is also mixed, due to the fact that research is generated from four different academic disciplines: economics, finance, management and law (Straska and Waller, 2014), and that, depending on the purpose and the circumstances, some firms might profit from poison pill adoption while others may not.
Moreover, a large amount of the relevant literature was written in the 1980s, especially after the Moran v. Household decision officially validated the use of poison pills in 1985. However, due to ongoing legal decisions from prior decades, research before the 1990s does not seem directly relevant to the current anti-takeover provisions environment. Empirical analysis shows that the negative market reaction to poison pills during the mergers and acquisition wave of the 1980s vary significantly from other time periods and, therefore, should be interpreted with caution (Sundaramurthy et al., 1997).
As already mentioned in the section, a few researches have been developed for specific industries, However, Wanasika and Limbu (2015), in its research on pharmaceutical industry have found that a positive effect of antitakeover mechanisms on firm performance, by using the Tobin’s Q measure. Thus, Tobin’s Q is higher when companies incorporated in Delaware use poison pills than those companies incorporated outside Delaware.
In addition, new trends in the socio-economic environment should be considered and borne in mind when analysing earlier research. In recent years, shareholder activists have appeared as an important stakeholder group which influences and speaks out on significant decisions such as poison pill adoption (Sikes et al., 2014; Catan and Kahan, 2016). According to Catan and Kahan (2016), the most traditional researches have omitted important variables and have used improper specifications. Currently, firms have access to other, more powerful takeover defences, specifically poison pills.
The theoretical framework of the poison pills adoption, including other antitakeover measures, can be understood and analysed in the scope of principles of institutional relation between firms and shareholders (DiMaggio and Powell, 1991), in which corporate governance mechanisms and transparency rules and procedures can culturally and cognitively explain the social and organisational phenomena (Catan and Kahan, 2016). Indeed, diversity on board impacts on corporate reputation (Lopes and Ferraz, 2016) and strategies implemented, including antitakeover mechanisms (Foley et al., 2015; Ge et al., 2016). As mentioned by Catan and Kahan (2016), theorists took different positions on what antitakeover initiatives have in the creation of shareholder value.
Based on the significant controversy around antitakeover defences, in particular poison pills adoption, the motivation behind developing this empirical research paper can be justified by the reasons stated above; besides which, additional contributions to this controversial topic are still urgently needed. Furthermore, in comparison with other recent studies (e.g., Rhee and Fiss, 2014) this study extends the sample period to cover a greater expanse of time and therefore cases. Moreover, this paper conducts various sub-sample analyses in order to draw specific conclusions about the origin of the abnormal returns.
3 Methodology and methods
3.1 Data sample
This research follows a positivist approach (Sekaran and Bougie, 2013), with the objective to test cause-and-effect relationships through manipulation (based on the poison pills adoption and its impact over a window of time) and observation (based on the dates of poison pills use, over a long range of time). Poison pill adoption dates were retrieved from the ‘corporate governance market overview’ using Eikon, the financial software product by Thomson Reuters. In fact, 4,479 poison pill adoption events by US companies were collected. The current study draws largely on secondary data for analysis. Furthermore, it focuses on US firms due to legal constraints, as poison pills are prohibited in the UK and can only be placed with explicit shareholder approval in the European Union. Conversely, legislation in the USA makes antitakeover measures and takeover protection legal on the condition that these are used proportionally. In order to make full use of the Eventus Software for abnormal return calculations, further financial information was added through a Bloomberg Terminal from Bloomberg L.P.
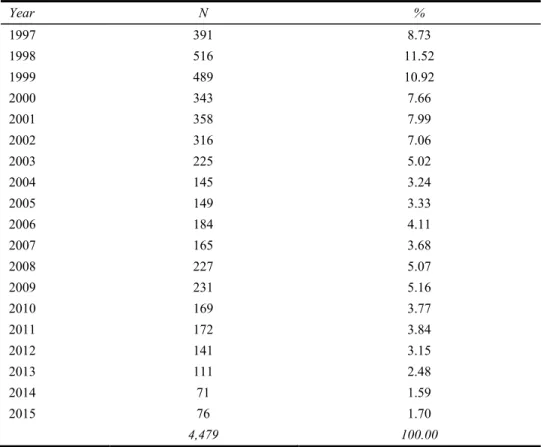
The poison pill adoption date range covers the period 1 January 1997–22 December 2015. Adoption dates prior to 1997 are not used as the data sample of poison pill adoption in the USA has already been conducted in various previous literature (Bojanic and Officer, 1994; Campbell and Varma, 2010; Comment and Schwartz, 1995; Jirapom, 2005). Thus, Table 1 lists the distribution of the data set per years and its percentage
compared to the entire sample. The earliest years in the data sample (1998, 1999 and 1997) are the years with the highest share while the most recent years (2014, 2015 and 2013) have the least stake. Generally, there seems to be a declining trend of poison pill adoption throughout the period. Interestingly, an exception of this pattern can be seen in the years of 2008 and 2009, when the financial crisis in the USA was at its peak. Possibly, uncertainty in the economic environment and the financial instability of the companies lead to an increased demand on antitakeover protection. In order to control more for time-wise differences, this study divides the data sample into sub-periods and presents the results separately as well. The division of sub-periods can be seen explicitly in Table 2. As the sub-period of the three latest years of the prior century (1997, 1998 and 1999) with 1,396 adoption dates already takes 31.17% of the sample size, this sub-period is limited to duration of three years. Further sub-samples (from 2000 to 2004 and from 2005 to 2009) range over five years with respective shares of 30.97% and 21.34%. Finally, the most recent sub-sample consists of 740 adoptions from 2010 to 2015.
Table 1 Poison pill adoptions per year
Year N % 1997 391 8.73 1998 516 11.52 1999 489 10.92 2000 343 7.66 2001 358 7.99 2002 316 7.06 2003 225 5.02 2004 145 3.24 2005 149 3.33 2006 184 4.11 2007 165 3.68 2008 227 5.07 2009 231 5.16 2010 169 3.77 2011 172 3.84 2012 141 3.15 2013 111 2.48 2014 71 1.59 2015 76 1.70 4,479 100.00
Those observations were categorised into four sub-periods as follows, in order to identify potentially significant time effects.
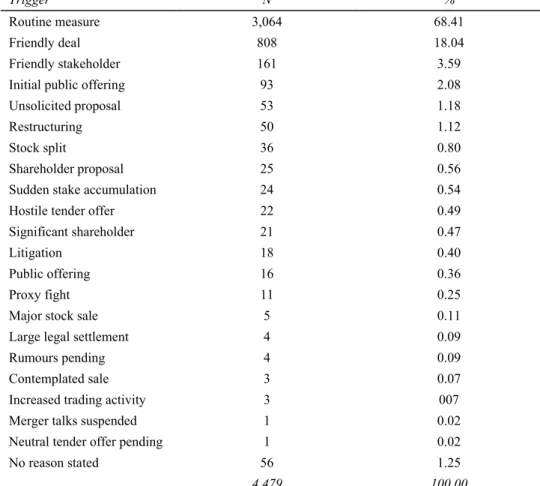
Most of the data retrieved (98.75%), states why the poison pill was adopted, as Table 3 illustrates. However, the majority of events (68.41%) are routine measures to ensure the firm remains protected. A smaller share (18.04%) is adopted due to friendly deals, a scenario whose intention is to protect the agreement from spontaneous hostile takeover attempts.
Table 2 Poison pill adoptions per sub-period Year N % 1997–1999 1,396 31.17 2000–2004 1,387 30.97 2005–2009 956 21.34 2010–2015 740 16.52 4,479 100.00
Table 3 Poison pill adoption trigger
Trigger N %
Routine measure 3,064 68.41
Friendly deal 808 18.04
Friendly stakeholder 161 3.59
Initial public offering 93 2.08
Unsolicited proposal 53 1.18
Restructuring 50 1.12
Stock split 36 0.80
Shareholder proposal 25 0.56
Sudden stake accumulation 24 0.54
Hostile tender offer 22 0.49
Significant shareholder 21 0.47
Litigation 18 0.40
Public offering 16 0.36
Proxy fight 11 0.25
Major stock sale 5 0.11
Large legal settlement 4 0.09
Rumours pending 4 0.09
Contemplated sale 3 0.07
Increased trading activity 3 007
Merger talks suspended 1 0.02
Neutral tender offer pending 1 0.02
No reason stated 56 1.25
4,479 100.00
A sample of 232 events is excluded due to the insecurity of reliable Committee on Uniform Security Identification or CUSIP. This eight-digit CUSIP code is used to uniquely identify any issuer of shares in the USA. In 598 cases the required financial data for the event period could not be found. As the reliability of the calculations depends on verifiable financial data, the companies with which one is operating should be covered in the Center of Research in Security Prices (CRSP) database. In addition, events with too few estimation or event-period days were not taken into account. This occurs in 17 and
seven cases respectively. To sum up, 854 security events were discounted in total, leaving 3,625 adoption dates available as reliable data.
From the data sample collected, a new empirical study has been conducted to enrich the controversial evidence relating to managerial entrenchment theory or the shareholder wealth maximisation hypothesis. Before presenting the empirical results of the study, the methodology will be outlined.
In order to identify common market reactions to poison pill adoption, this empirical research relies on event study methodology. As stock market data is open access, publicly available, and accessible online within seconds, market efficiency is assumed. Therefore, information about the adoption of a poison pill is incorporated by shareholders within a very short time.
3.2 Event window approach and models
Event study methodology is widely used in empirical anti-takeover literature. Most of the research contained in the literature follows a similar approach with some variations (Sundaramurthy et al., 1997; Rhee and Fiss, 2014; Schepter et al., 2016). The current study adapts the methodology in order to make the current and more extensive data set comparable to prior research. In order to present the results as accurately as possible, this empirical research is based on a daily event study, using daily return stock data.
A common trend of stock market decline after the event of poison pill adoption will be interpreted in favour of the managerial entrenchment hypothesis. In this case, shareholders seem to react negatively to the use of anti-takeover protection and seem to be in favour of ownership changes that might be capable of creating value. Inversely, a common trend of significant positive abnormal returns indicates evidence for the shareholder maximisation hypothesis. In this scenario, shareholders value either the long-term view, the additional bargaining power of management, or a combination of both factors.
The study utilises the Eventus Software 9.0 for event studies and financial research, provided by Wharton Research Data Services, the Wharton School (University of Pennsylvania). Eventus is based on SAS algorithms. A significant advantage of Eventus is connection to the CRSP database, which allows direct stock prices data retrieval.
3.2.1 Event window identification
Day zero is defined as the day of the event, which corresponds in this study to the day of the poison pill adoption. Days prior to the event are negative. For example, day ‘–5’ is considered as five days before adoption of the poison pill. Conversely, the terminology ‘+5’ describes day five after the event. It is necessary to determine an event window due to the fact that the event window is the time period (measured in days) during which the abnormal returns concerning the pre-defined event are quantified. This study includes (several) days before and after the day of the event. The inclusion of days before the event is justified by the fact that information about the adoption event is often announced earlier by the media. It is important to include this effect in order to provide complete analysis. Additionally, the time window should also include (a number of) days after the events as it can take some time to incorporate the full extent of the market reaction to the event. For instance, the event could occur after the market closes and, therefore, shareholder reaction would be expressed in the stock prices of the following day.
However, it is also important not to set the event window too wide as the abnormal returns become diluted and therefore the effect might not be adequately highlighted. In order to control this potential risk, this study elaborates various event windows and its results. First of all, any sudden impact of the event is measured by only including the event itself and the following day (0; +1). Furthermore, this study also introduces controls for longer and shorter event windows, each centred on the day of the event. In detail, periods of three (–1; +1), five (–2; +2) and seven (–3; +3) days are examined. Longer periods of pre-adoption (–15; –4) and post-adoption (+4; +15) represent ‘neutral’ times without the impact of any specific event (Brown and Warner, 1985).
The estimation period starts 255 active trading days prior to the event and ends 46 days before the event takes place. In essence, the estimation period should be a regular timeframe, which calculates the sensitivity of a firm’s beta for example. Hence, the period should be isolated from any influence of the event itself.
3.2.2 Abnormal return calculations
With the help of the event study methodology it has been possible for this empirical research to examine the resulting market reactions to the adoption of poison pills. Obviously, the events take place on different dates so t = 0 represents the day of the realisation. In order to build a robust empirical model, this study follows the structural advice of ‘The event study methodology since 1969’ (Binder, 1998), ‘Event studies in economics and finance’ (MacKinley, 1997), and ‘Econometrics for event studies’ (Kothari and Warner, 2007).
it it it R =K +e
Here, Rit is the return of a firm’s security i during the period t relative to the event. Therefore, the return can be seen as a composition of the expected return Kit (e.g., as predicted by a model) and eit – which is the uncertain element referred to as the ‘abnormal return’ (Brown and Warner, 1985). Consequently, the abnormal return is defined as the difference between the observed and the predicted return:
it it it e =R −K
Alternatively, the abnormal return could be described as the difference between the return conditional of the event, subtracting the expected return without the event in place, thus unconditional of the event. This methodology enables measurement of the direct impact of the event on stockholder wealth (Kothari and Warner, 2007).
In order to draw general conclusions in relation to the impact of an event, the abnormal returns have to be aggregated. Using the cumulative abnormal return (CAR) method, this paper quantifies the performance during the event window due to the adoption of a poison pill. The CAR starting at time t1 and ending at t2 is defined as the
sum of all the abnormal returns included (MacKinley, 1997):
(
)
1 2 2 1 1 2; ; ; t i i t i t it t t CAR t t AR AR AR = = + + =∑
Adding the abnormal returns together and relating them to the event period leads to a cumulative average abnormal return:
1 1 N i i i CAAR CAR N = =
∑
In order to calculate the abnormal returns, a model that computes ‘normal’ returns (unconditional of the event) is needed. Brown and Warner (1985) describe three variations suitable for excess return calculations: mean adjusted returns, market adjusted returns and, the OLS market model.
3.2.3 Market model
In practice, the market model is the most commonly acquired for normal return calculations. The OLS market model is a statistical model that relates shareholder reaction to the sensitivity of a market portfolio (MacKinley, 1997). The market model is a one-factor model set against idiosyncratic market risk. The parameter beta (‘β’) indicates whether the stock is more or less volatile compared to the market. It is necessary to compute beta because it indicates the risk that cannot be minimised through diversification. Risk exposure above the market risk ought to result in more volatile stock movements. This needs to be compensated for with a risk premium above the market return. The beta βi is computed by dividing the covariance of the normal return Rit and the market return Rmt by the variance of the market return:
(
)
(
it,)
mt i mt COV R R Var R = βIncorporating the risk measure beta into our model resulted in the following equation: it i i mt it
R =α +β R +e
In order to solve the abnormal return of the data being examined, the equation can be restructured to (Higgins and Nelling, 2002):
(
)
it it i i mt e = R −α −βR with( )
it 0 var( )
it e2 E e = e =σwhere αi, βi and σ are defined as OLS parameters respectively. e2
So as to present robust results, this study utilises three different stock indexes as its market portfolio. On the one hand, the dataset of the CRSP is used as an ‘equal weighted index’ alongside a ‘value weighted index’ (MacKinley, 1997). The CRSP database offers one of the most numerous and complete sources for historical stock market information relating to the USA. It contains data across various industries and size of organisation. Therefore, the CRSP database was selected as a suitable benchmark because most of the poison pill-adopting firms are smaller ones that need protection, which as a consequence means that they are not suitable to compare to market indexes containing only major corporations. On the other hand, this empirical study also uses the S&P 500 index as a market portfolio. The S&P 500 was selected as an appropriate benchmark as it represents the leading US firms which together cover 75%cent of the entire US equity market capitalisation.
The abnormal return (AR) is easily quantified as the difference between the normal return Rit and the market return Rmt (Kothari and Warner, 2007):
it it mt AR =R −R
The market model explains variations of return due to market changes. Consequently, the market model offers increased certainty that event effects will be detected.
3.2.4 Fama-French factor model
The one-factor Fama-French market model is focused entirely on market risk. In order to deliver robust results, this study also tests outcomes by calculating the normal returns via the Fama and French (1993) model. This model uses a three-factor approach that includes company size, book-to-market ratio, and market risk. From the Fama-French point of view, small caps, and shares with a lower price-to-book ratio, outperform the market. Hence, three variables explain stock anomalies in more detail and consequently detect event effects more precisely. The following equation leads to returns using the Fama-French methodology (Fama and French, 1993):
(
)
it f i i mt f i i it
R =R +α +b R −R + ∗s SMB h HML e+ ∗ +
The excess return relative to the market portfolio can be obtained by subtracting the risk-free returns Rf from the market returns Rmt. SMB represents the company size via measuring market capitalisation (‘small minus big’). According to the Fama-French model, small companies tend to outperform large firms. HML stands for the difference of companies with a high book-to-market ratio and firms with a low ratio. Fama and French (1993) state that value stocks outperform growth stocks. The factors SMB and HML are without cost, available on the website of Kenneth French. The corresponding coefficients bi, si and hi are sensitivities (betas) determined by linear regression (Fama and French, 1996, 2014).
Fama and French (1996, 2014) include additional factors in their model, offering greater explanatory power. This study extends the three-factor model by adding an additional factor: ‘momentum’. Momentum (MOM) in the context of shares, describes the tendency for the increase to continue after a period of rise and the tendency of the decline to continue after an earlier decrease. Carhart (1997) first put forward this factor in his research. In essence, the existence of MOM is a market anomaly that the financial literature struggles to explain. However, the inclusion of the MOM factor assists this empirical study in explaining stock price movements more accurately. According to Carhart’s (1997) definition, a share has a MOM factor if the average return of the previous 12 months is positive.
3.3 Statistical significance
This empirical study also tests the significance of abnormal returns. Generally, there are two different groups of significance tests: parametric and non-parametric tests. On the one hand, parametric tests assume normal distribution of company returns. On the other hand, non-parametric tests do not rely on probability-distribution assumptions. In order to ensure robust results, this study uses both parametric and non-parametric tests, in order to
deter statistical significance. The Patell Z test is one of the most commonly used parametric tests (Forjan and Van Ness, 2003):
(0,1)
t i
Z =
∑
SCAR J NIn this formula, SCARi is defined as a standardised CAR and J the total number of companies.
4 Empirical results and discussions
4.1 Market model approach
The full sample contains 4,479 adoption events that occurred over the period 1 January 1997–22 December 2015 (see Table 1, Table 2 and Table 3). However, 854 events have been discarded due to the inability of the dataset to provide all the financial information required for analysis. This leads to a total of 3,625 usable events.
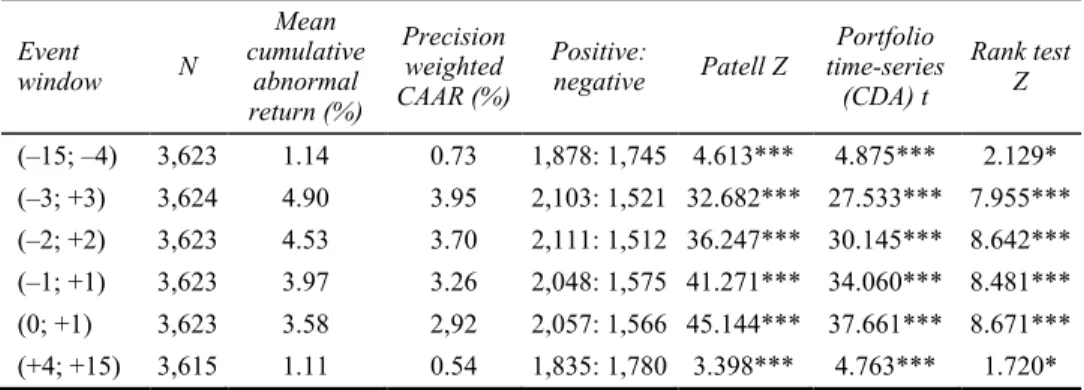
An OLS market model has been used to test the hypothesis, wherein three market indexes have been employed for robustness: CRSP value weighted, CRSP equally weighted, and the S&P 500 composite index. In all the variations, dividends are excluded. Results for the market model abnormal returns (S&P 500 composite index; equally weighted index; value weighted index) are evidenced in Tables A1 to A3.
The average CAR for a three-day event window centred on the adoption date (–1; +1) is 3.97%, with high significance in all statistical tests. A large number, 2,052 events, are detected as positive abnormal returns, while only 1,571 occurrences are negative abnormal returns respectively. Increasing the event window to five days (–2; +2) leads to a rise in the abnormal return to 4.54%, also significant on the 0.001 level. During this event window, the ratio of positive abnormal returns to negative abnormal returns advances even further to 2,107 versus 1,516. This tendency continues for a longer period of seven days (–3; +3), leading to a CAR of 4.91%. The ratio between positive and negative abnormal returns is 2,104 versus 1,520, again, clearly dominated by positive occurrences. Moreover, neutral periods, where no effect should be seen, were controlled. Therefore, a 12-day period, before (–15; –4) and after (+4; +15) the event, has been taken into account. Both show a positive CAR of 1.16% and 1.15% respectively. However, a small abnormal return over a 12-day period should not be interpreted as event-specific. Hence, this outcome shows that time periods significantly before and after follow a ‘normal’ path, while days around the event are confronted with an exogenous shock. To elaborate on this conclusion, one needs to focus on the detailed view. From this view point, the abnormal returns and its significance are listed on a daily basis. The highest significance can be found on the day of the adoption of the pill (Patell Z of 24.543) and the day after the event (Patell Z of 39.168). Obviously, the market reaction ought to be most noticeable on these days, as shareholders adapt their portfolio to reflect their opinion about the event. The high effect on the following days indicates that information is not incorporated immediately by stockholders. Additionally, the results show significant abnormal returns on a 0.001 level for the period three days before the event. However, this outcome is not a surprise, as this study is concerned with investigating the market reaction to poison pill adoption. Early significance is comprehensible as it relates to an announcement of the adoption of the poison pill
communicated earlier through the media. Proof that it is still definitely the event causing the positive effect can be seen in the mean CARs per day. The day of the adoption reveals a positive abnormal return of 1.33% and the day afterwards 2.26% respectively. Other days in the entire event period (–15; +15) are mostly small and positive, but also insignificant.
The 95%cent confidence limits (from mean –1.96 standard error to mean +1.96 standard error) are denoted in the dotted line as orientation. In the pre-event period, there are no strong abnormal returns discernible. However, a tendency for a slightly positive market reaction can already be seen, centred on the day the event took place, which then shows strong abnormal returns, indicating a highly significant positive market reaction due to the event. In the post-event period, significant abnormal returns disappear again. Shareholders seem to value the protection of the poison pill sustainably.
As expected, all three abnormal return-calculation methods have shown similar results. This provides evidence for the robustness of the calculations. The outcome also positions the CAR between the more extreme results of the CRET and BHAR calculations. As a consequence, this study focuses mainly on outcomes of the CAR calculation methodology as it offers more standardised and less extreme values. Generally, the CAR methodology is the one most widely used both in the academic literature and in the business world.
In order to present robust outcomes, this study conducts the analysis for the same sample with the CRSP Equally Weighted Index as a benchmark as well. As expected, the outcome is very similar to the analysis prior to it. Abnormal returns are now 1.35% for the day of the event and 2.25% on the day after. The neutral time periods of 12 days before and after the event show the biggest difference. The pre-adoption period (–4; –15) has a CAR of 1.05%. Similarly, the post-adoption period (+4; +15) displays a positive abnormal return of 0.96%. Therefore, the equally weighted market model indicates more accurately the neutrality, controlled for the period before and after the event.
Finally, the CRSP value weighted index is used as a variation of the market model. Again, the outcome is similar to the previous two variations of the market model. In this version, the abnormal return on the day of the event is 1.33% and 2.25% for the following day respectively.
To sum up, all three variations of the market model lead to relatively similar results. Consequently, the results can be interpreted as robust. All three models indicate positive abnormal returns, especially centred on the day the poison pill was adopted. Taking all outcomes into consideration, the evidence of the market model clearly argues in favour of the wealth maximisation hypothesis, as the abnormal returns are thorough, positive and statistically significant.
4.2 Fama-French model approach
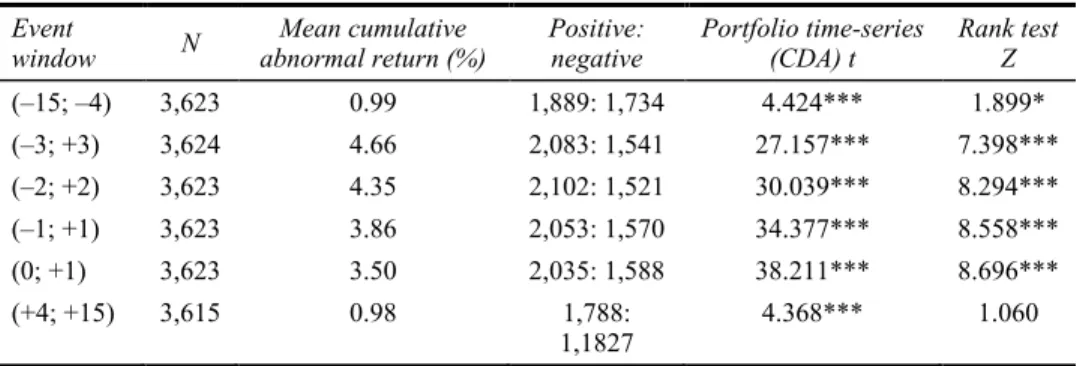
Fama and French (1993) include additional factors in their model. This study also incorporates the analysis of the MOM factor in line with Carhart (1997). These factor models (value weighted index and equally weighted index) are supposed to have a higher explanatory power. The results are evidenced in Table A4 and Table A5.
The comparison to the market model is drawn with the value weighted index as a benchmark. This version reflects a more reasonable view of reality that accounts for bigger firms having a greater impact on economic life than smaller ones. First of all, the
day of the event (‘0’) has a highly significant, positive abnormal return of 1.29%. Adding the 2.21% abnormal return of the following day, leads to a CAR of 3.50%, centred on the day of the event (0; +1). A longer event window of three days (–1; +1) reveals a CAR of 3.86%. The market model indicates a relatively higher abnormal return of 3.97% for the same period. This tendency can also be recognised steadily in longer event windows of five (–2; +2) and seven days (–3; +3). The longest event window (–3; +3) states a CAR of 4.66%. In this scenario, the market model expresses a 5.2% higher value compared to the factor model.
In order to present robust results, the same analysis has also been conducted for the equally weighted index. In essence, the outcome provides similar results to the prior analysis. The main period, centred on the poison pill adoption date, states a CAR of 3.52% for the Fama-French version versus 3.59% for the market model respectively. The similar results of the two different models provides evidence in favour of the robustness of the calculations.
To sum up, the market model shows higher positive abnormal returns than the factor model. This is in line with previous expectations because factor models have additional explanatory power. Hence, the factor model can identify certain proven empirical market anomalies while the market model recognises them as additional abnormal returns.
In general, this empirical research finds highly significant, positive abnormal returns for various event windows. Thus, the full sample analysis clearly argues in favour of the shareholder wealth maximisation hypothesis. In order to provide further specific statements, this paper also introduces controls of various sub-samples.
4.3 Industry analysis
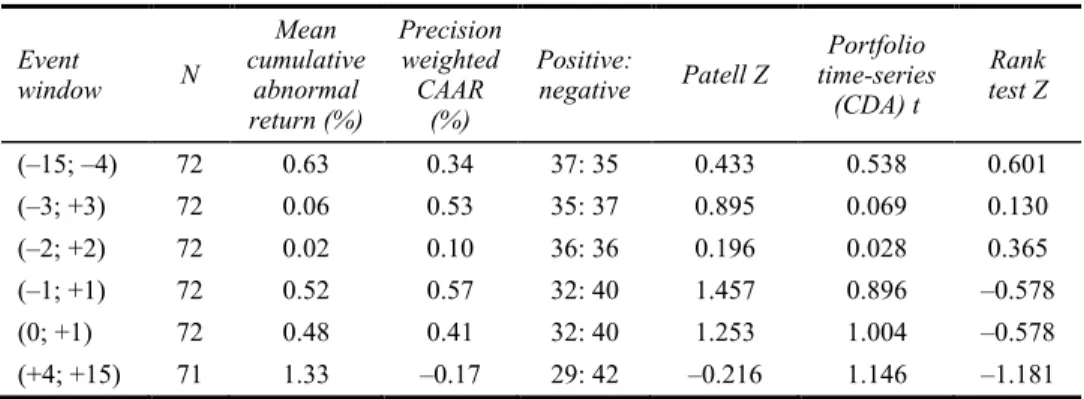
In order to ascertain a deeper analysis of the positive abnormal returns, this study also introduces control of industry characteristics. Therefore, the sample of 4,479 adoption dates is divided into the corresponding main industries in which the firms operate. As expected, the results vary across industries. On the day of the event, a majority of 44 adoptions are negative, while only 28 occurrences show positive results. However, the results remain insignificant. Contrary to this example, the result for the ‘software’ industry (Table A6) shows highly significant abnormal returns on the day of the event (2.73%) and the following day (4.13%). A similarly strong reaction is detected for the pharmaceuticals industry with 1.68% and 5.59% respectively. A possible explanation might indicate the distinction between industries with high and low takeover activity. The software and the pharmaceutical industries are known to be takeover intense. Their success relies on the successful implementation of certain products such as drugs or software programs. Mergers and acquisitions are relatively rare in the banking sector (Table A7). However, this argumentation should be interpreted with caution, as the industry samples differ in their employment of poison pills. Interestingly, the banking sample has a remarkably high share of routine adoptions (84.88%), while the software industry (56.94%) and pharmaceuticals industry (68.99%) have significantly lower stakes. This finding supports the earlier insight that the reason for poison pill adoption needs to be incorporated into the analysis when measuring market reaction.
The event window centred on the expiration date (0; +1) displays a small abnormal return of 0.41%. However, the level of significance (0.05) is relatively low in relation to previous results. Consequently, there is no real evidence supporting a market reaction on the expiration date of the pill. A possible explanation is that the date of the termination is
declared in advance so that shareholders do not need to adjust their stock price expectation suddenly. Additionally, on the day of the expiration, there might already be a new adoption in place, or in the process of planning. This is especially the case for routine-measure adoptions.
Poison pills are controversial devices. However, this empirical research clearly offers evidence in favour of the shareholder wealth maximisation hypothesis. Shareholder rights plans have a positive impact on shareholder value, as the market model shows strong abnormal returns. This finding is robust for the S&P 500, the CRSP weighted index, as well as the CRSP equally weighted index, used as market benchmark options. In addition, the Fama-French-MOM factor model shows that the results are robust and not model biased. Controlling for various sub-periods leads to the insight that economic conditions do influence stock price reaction. However, the positive market reaction to poison pill adoptions remains robust for all time frames. Further analysis indicates a weak market reaction to routine-measure adoption cases, while an unwelcome takeover threat leads to highly significant abnormal returns. Remarkably, this is also the case if the company has recently completed a friendly deal. Shareholders do not value the isolation from the external forces of the corporate control market but do seem to oppose hostile takeover attempts. This result is in line with another current paper of Schepter et al. (2016). In this scenario, shareholders seem to value the protection of this anti-takeover device positively. The positive outcome of poison pill adoption coincides with the prior findings of Comment and Schwartz (1995). All of these authors found that poison pills protected companies with an increased bargaining position and higher takeover premiums in case of a takeover. In addition, Danielson and Karpoff (2002) reported a rise in performance for firms with a shareholder rights plan in place. Moreover, there is no strong positive market reaction to poison pill termination.
All in all, in the early literature – such as that by Ryngaert (1988) or Malatesta and Walkling (1988) – one finds negative market reactions to poison pill adoption. Alongside this empirical study, other current papers show a tendency for a positive market reaction, as Heron and Lie (2015), for instance. Taking all the evidence together, therefore, this paper finds positive abnormal market returns for poison pill adoption and therefore argues in favour of the shareholder maximisation hypothesis: poison pills have a positive effect on shareholder value. Our results confirms the outcomes achieved by Wanasika and Limbu (2015) in the context of pharmaceutical industry, and contributes as corroborative insights carried out by other previous researches such as Comment and Schwartz (1995), Bojanic and Officer (2004), Danielson and Karpoff (2006), Campbell and Varma (2010), Goh and Caton (2008), Heron and Lie (2006, 2015), Schepter et al., 2016, among others. Broadly, despite the decline of the use of antitakeover defences over the years, and the severe limitations in some countries (e.g., UK), a Delaware incorporation has a positive effect on firm value and performance. However, the corporate governance mechanisms, the impact of intellectual capital pillars measurements and disclosures, and the implementation of transparency mechanisms as required by law, have been contributed over time to reduce the asymmetry of information, in the scope of institutional theory.
5 Conclusions, limitations and directions
Martin Lipton invented the poison pill in 1982 and, since then, this device has been viewed as controversial (Sunder, 2014). Poison pills intervene in an ordinary corporate control market, and US law allows them to be implemented without shareholder approval. The early literature, such as that by Malatesta and Walkling (1988) or Ryngaert (1988) tends to define shareholder right plans as management entrenching provisions. Recent research, however – such as Schepter et al. (2016) or Heron and Lie (2015) – tends to find a positive market reaction to poison pill adoption. Their conclusions are in line with the empirical findings of this paper.
This analysis shows highly significant abnormal returns centred on the day the poison pill was adopted. Diverse model variations confirm the robustness of this outcome. Further sub-sample analysis indicates that poison pill adoption together with an unwelcome takeover threat drive the positive results in the sample. This does not mean that shareholders automatically value the isolation of the firm in the corporate control market. In fact, the protection of ‘friendly deals’ is appreciated the most. Contrary, routine poison pills do not show clear positive abnormal returns on the day of adoption.
To sum up, shareholders react positively to poison pill adoption, especially if a hostile takeover attempt had been anticipated. Shareholders seem to value the protective effect of poison pills as they are seen to provide management a superior bargaining position. This position allows management to negotiate to the maximal possible bid premium (Datta and Iskandar-Datta, 1996).
In conclusion, it is necessary to keep the limitations of this study in mind. First, this study focuses on poison pill adoption dates, where in essence the limitation is the possibility that there may have been an earlier effect due to an advance media announcement. In this case, the entire effect would not be seen solely on the day of the adoption. In order to minimise this effect, this study introduced controls for a variety of event windows. As already mentioned, the market reaction to poison pill expiration might be blurred through renewed routine measures.
Generally, this empirical study could be the basis for further research. Following Lipton’s invention of the poison pill device in 1982, a vast amount of research has since been published about it, especially in the 1980s and 1990s. Most analysis of that period was quite basic and supported the managerial entrenchment hypothesis. In the 21st century, the research conducted in the area has declined. Although research into poison pills remains controversial, currently there seems to be a tendency in favour of the shareholder wealth maximisation hypothesis. Further research on the basis of this study might finally clarify the extent to which shareholders value poison pills.
References
Binder, J.J. (1998) ‘The event study methodology since 1969’, Review of Quantitative Finance and
Accounting, Vol. 11, No. 2, pp.111–137.
Bojanic, S. and Officer, D. (1994) ‘Corporate takerover barriers: valuation and firm performance’,
Journal of Business Finance & Accounting, Vol. 21, No. 1, pp.589–599.
Brown, S.J. and Warner, J.B. (1985) ‘Using daily stock returns – the case of event studies’, Journal
of Financial Economics, Vol. 14, No. 1, pp.3–31.
Campbell, T. and Varma, R. (2010) ‘Does incorporating in Delaware enhance firm value: evidence from poison pills’, Corporate Board: Role, Duties and Composition, Vol. 6, No. 1, pp.53–69. Carhart, M. (1997) ‘On persistence in mutual fund performance’, Journal of Finance, Vol. 52,
No. 1, pp.57–82.
Catan, E.M. and Kahan, M. (2016) ‘The law and finance of antitakeover statutes’, Stanford Law
Review, Vol. 68, No. 1, pp.629–680.
Comment, R. and Schwartz, G.W. (1995) ‘Poison or placebo? Evidence on the deterrence and wealth effects of modern antitakeover measures’, Journal of Financial Economics, Vol. 39, No. 1, pp.3–43.
Danielson, M. and Karpoff, J. (2006) ‘Do pills poison operating performance?’, Journal of
Corporate Finance, Vol. 12, No. 3, pp.536–559.
Datta, S. and Iskandar-Datta, M. (1996) ‘Takeover defenses and wealth effects on securityholders: the case of poison pill adoptions’, Journal of Banking and Finance, Vol. 20, No. 7, pp.1231–1250.
DiMaggio, P. and Powell, W. (1991) ‘The iron cage revisited: institutional isomorphism and collective rationality in organization fields’, in Powell, W. and DiMaggio, W. (Eds.): The New
Institutionalism on Organizational Analysis, The University of Chicago Press, Chicago.
Fama, E.F. and French, K.R. (1993) ‘Common risk factors in the returns on stocks and bonds’,
Journal of Financial Economics, Vol. 33, No. 1, pp.3–56.
Fama, E.F. and French, K.R. (1996) ‘Multifactor explanations of asset pricing anomalies’, Journal
of Finance, Vol. 51, No. 1, pp.55–84.
Fama, E.F. and French, K.R. (2014) A Five-factor Asset Pricing Model, Fama-Miller Working Paper [online] http://www8.gsb.columbia.edu/programs-admissions/sites/programs-admissions/files/finance/Finance Seminar/spring 2014/ken french.pdf (accessed 15 October 2017).
Foley, M., Cebula, R., Jun, C. and Boylan, R. (2015) ‘An analysis of withdrawn shareholder proposals’, Corporate Governance, Vol. 15, No. 4, pp.546–562.
Forjan, J. and Van Ness, B. (2003) ‘An investigation of poison pill securities, long-term debt, and the wealth of shareholders’, American Journal of Business, Vol. 18, No. 2, pp.17–22.
Ge, W, Tanlu, L. and Zhang, J. (2016) ‘What are the consequences of board destaggering?’, Review
of Accounting Studies, Vol. 21, No. 1, pp.808–858.
Goh, J. and Caton, G. (2008) ‘Corporate governance, shareholder rights, and shareholder rights plans: poison, placebo, or prescription?’, Journal of Financial and Quantitative Analysis, Vol. 2, No. 1, pp.381–400.
Heron, R.A. and Lie, E. (2006) ‘On the use of poison pills and defensive payouts by takeover targets’, The Journal of Business, Vol. 79, No. 4, pp.1783–1807.
Heron, R.A. and Lie, E. (2015) ‘The effect of poison pill adoptions and court rulings on firm entrenchment’, Journal of Corporate Finance, Vol. 35, No. 1, pp.286–296.
Higgins, E. and Nelling, E. (2002) The Effect of Poison Pill Securities on Shareholder Wealth in
Real Estate Trusts, Federal Research Press, Boston.
Jirapom, P. (2005) ‘An empirical analysis of corporate takeover defenses and earnings management: evidence from the US’, Applied Financial Economics, Vol. 15, No. 5, pp.293–303.
Kothari, S.P. and Warner, J.B. (2007) ‘Econometrics of event Studies’, in Eckbo, B.E. (Ed.):
Handbook of Empirical Corporate Finance, Vol. 1, Part 1, pp.3–36.
Lopes, I.T. and Ferraz, D.P. (2016) ‘The value of intangibles and diversity on boards looking towards economic future returns: evidence from non-financial Iberian business organizations’,
Int. J. Business Excellence, Vol. 10, No. 3, pp.392–417.
MacKinley, C. (1997) ‘Event studies in economics and finance’, Journal of Economic Literature, Vol. 35, No. 1, pp.13–39.
Malatesta, P.H. and Walkling, R.A. (1988) ‘Poison pill securities’, Journal of Financial
Economics, Vol. 20, No. 1, pp.347–376.
Rhee, E. and Fiss, P.C. (2014) ‘Framing controversial actions: regulatory focus, source credibility, and stock market reaction to poison pill adoption’, Academy of Management Journal, Vol. 57, No. 6, pp.1734–1758.
Ryngaert, M. (1988) ‘The effect of poison pill securities on shareholder wealth’, Journal of
Financial Economics, Vol. 20, No. 1, pp.377–417.
Schepter, D., Oh, W. and Patel, P. (2016) ‘Interpreting equivoical signals: market reaction to specific-purpose poison pills adoption’, Journal of Management, Vol. 18, DOI: 10.1177/ 01492206316635250.
Sekaran, U. and Bougie, R. (2013) Research Methods for Business, 6th ed., John Wiley & Sons, Chichester.
Shapoval, R., Demenko, O. and Solntseva, K. (2017) ‘The experience of the European Union in the field of administrative and legal support for asset-grabbing prevention’, Journal of Advanced
Research in Law and Economics, Vol. 8, No. 3, pp.994–1008.
Sikes, S.A., Tian, X. and Wilson, R. (2014) ‘Investors’ reaction to the use of poison pills as a tax loss preservation tool’, Journal of Accounting and Economics, Vol. 57, Nos. 2/3, pp.132–148. Straska, M. and Waller, H.G. (2014) ‘Antitakeover provisions and shareholder wealth: a survey of
the literature’, Journal of Financial and Quantitative Analysis, Vol. 49, No. 4, p.933.
Sundaramurthy, C., Mahoney, J.M. and Mahoney, J.T. (1997) ‘Board structure, antitakeover provisions, and stockholder wealth’, Strategic Management Journal, Vol. 18, No. 3, pp.231–245.
Sunder, D.L. (2014) ‘The controversial ‘poison pill’ takeover defense: how valid are the arguments in support of it?’, Introduction, November 2013, Vol. 21, No. 1, pp.47–66.
Wanasika, I. and Limbu, Y.B. (2015) ‘Effects of antitakeover defenses on value in the pahrmaceutical industry’, American Journal of Management, Vol. 15, No. 1, pp.59–72. Yeh, T.M. (2014) ‘The effects of anti-takeover measures on Japanese corporations’, Review of
Appendix
Table A1 Market Model Abnormal Returns: S&P 500 Composite Index
Event window N Mean cumulative abnormal return (%) Precision weighted CAAR (%) Positive: negative Patell Z Portfolio time-series (CDA) t Rank test Z (–15; –4) 3,623 1.16 0.74 1,877: 1,746 4.639*** 4.956*** 2.191* (–3; +3) 3,624 3.95 3.95 2,104: 1,520 32.549*** 27.413*** 7.870*** (–2; +2) 3,623 3.70 3.70 2,107: 1,516 36.078*** 29.993*** 8.548*** (–1; +1) 3,623 3.27 3.27 2,052: 1,571 41.121*** 33.918*** 8.450*** (0; +1) 3,623 2.93 2.93 2,064: 1,559 45.016*** 37.511*** 8.638*** (+4; +15) 3,615 0.56 0.56 1,851: 1,764 3.551*** 4.908*** 1.850* Notes: *p < 0.05; **p < 0.01; ***p < 0.001.
Table A2 Market model abnormal returns: equally weighted index
Event window N Mean cumulative abnormal return (%) Precision weighted CAAR (%) Positive: negative Patell Z Portfolio time-series (CDA) t Rank test Z (–15; –4) 3,623 1.05 0.74 1,880: 1,743 4.615*** 4.561*** 2.127* (–3; +3) 3,624 4.92 4.02 2,109: 1,515 33.163*** 28.025*** 8.389*** (–2; +2) 3,623 4.56 3.77 2,129: 1,494 36.825*** 30.764*** 9.174*** (–1; +1) 3,623 3.99 3.32 2,057: 1,566 41.795*** 34.702*** 8.982*** (0; +1) 3,623 3.59 2.95 2,052: 1,571 45.545*** 38.285*** 9.013*** (+4; +15) 3,615 0.96 0.47 1,796: 1,819 2.920** 4.199*** 1.333 Notes: *p < 0.05; **p < 0.01; ***p < 0.001.
Table A3 Market model abnormal returns: value weighted index
Event window N Mean cumulative abnormal return (%) Precision weighted CAAR (%) Positive: negative Patell Z Portfolio time-series (CDA) t Rank test Z (–15; –4) 3,623 1.14 0.73 1,878: 1,745 4.613*** 4.875*** 2.129* (–3; +3) 3,624 4.90 3.95 2,103: 1,521 32.682*** 27.533*** 7.955*** (–2; +2) 3,623 4.53 3.70 2,111: 1,512 36.247*** 30.145*** 8.642*** (–1; +1) 3,623 3.97 3.26 2,048: 1,575 41.271*** 34.060*** 8.481*** (0; +1) 3,623 3.58 2,92 2,057: 1,566 45.144*** 37.661*** 8.671*** (+4; +15) 3,615 1.11 0.54 1,835: 1,780 3.398*** 4.763*** 1.720* Notes: *p < 0.05; **p < 0.01; ***p < 0.001.
Table A4 Fama-French MOM model abnormal returns: value weighted index
Event
window N abnormal return (%) Mean cumulative Positive: negative Portfolio time-series (CDA) t Rank test Z
(–15; –4) 3,623 0.99 1,889: 1,734 4.424*** 1.899* (–3; +3) 3,624 4.66 2,083: 1,541 27.157*** 7.398*** (–2; +2) 3,623 4.35 2,102: 1,521 30.039*** 8.294*** (–1; +1) 3,623 3.86 2,053: 1,570 34.377*** 8.558*** (0; +1) 3,623 3.50 2,035: 1,588 38.211*** 8.696*** (+4; +15) 3,615 0.98 1,788: 1,1827 4.368*** 1.060 Notes: *p < 0.05; **p < 0.01; ***p < 0.001.
Table A5 Fama-French MOM model abnormal returns: equally weighted index
Event
window N abnormal return (%) Mean cumulative Positive: negative Portfolio time-series (CDA) t Rank test Z
(–15; –4) 3,623 0.93 1,888: 1,735 4.103*** 1.698* (–3; +3) 3,624 4.69 2,084: 1,540 27.149*** 7.515*** (–2; +2) 3,623 4.40 2,079: 1,544 30.117*** 8.461*** (–1; +1) 3,623 3.89 2,055: 1,568 34.356*** 8.669*** (0; +1) 3,623 3.52 2,026: 1,597 38.103*** 8.753*** (+4; +15) 3,615 0.87 1,802: 1,813 3.846*** 0.797 Notes: *p < 0.05; **p < 0.01; ***p < 0.001.
Table A6 Poison pill adoption by software firms, market model abnormal returns: S&P 500 composite index Event window N Mean cumulative abnormal return (%) Precision weighted CAAR (%) Positive: negative Patell Z Portfolio time-series (CDA) t Rank test Z (–15; –4) 175 2.67 0.69 96: 79 0.590 1.750* 1.965* (–3; +3) 175 9.30 7.72 116: 59 9.483*** 8.627*** 4.993** (–2; +2) 175 8.70 7.24 118: 57 10.515*** 9.559*** 5.296** (–1; +1) 175 7.59 6.40 118: 57 12.022*** 10.756*** 5.296** (0; +1) 175 6.86 5.85 115: 60 13.442*** 11.911*** 4.841** (+4; +15) 174 4.75 3.88 103: 71 3.628*** 3.364*** 3.106** Notes: *p < 0.05; **p < 0.01; ***p < 0.001.
Table A7 Poison pill adoption by banks, market model abnormal returns: S&P 500 composite index Event window N Mean cumulative abnormal return (%) Precision weighted CAAR (%) Positive: negative Patell Z Portfolio time-series (CDA) t Rank test Z (–15; –4) 72 0.63 0.34 37: 35 0.433 0.538 0.601 (–3; +3) 72 0.06 0.53 35: 37 0.895 0.069 0.130 (–2; +2) 72 0.02 0.10 36: 36 0.196 0.028 0.365 (–1; +1) 72 0.52 0.57 32: 40 1.457 0.896 –0.578 (0; +1) 72 0.48 0.41 32: 40 1.253 1.004 –0.578 (+4; +15) 71 1.33 –0.17 29: 42 –0.216 1.146 –1.181 Notes: *p < 0.05; **p < 0.01; ***p < 0.001.