DOI: 10.1590/1808-057x201808070
*Article presented at the XVII USP International Conference in Accounting and at the XIV USP Congress on Scientific Initiation in Accounting, São Paulo, SP, Brazil, July 2017.
Original Article
Analysis of the impact of Fies on the stock returns
from the higher education sector*
Marília Cordeiro Pinheiro¹ https://orcid.org/0000-0002-0168-530X
Email: [email protected]
André Luiz Marques Serrano¹ https://orcid.org/0000-0001-5182-0496
Email: [email protected]
¹ Universidade de Brasília, Faculdade de Economia, Administração, Contabilidade e Gestão Pública, Programa de Pós-Graduação em Contabilidade, Brasília, DF, Brazil
Received on 04.28.2018 – Desk acceptance on 05.21.2018 – 2nd version approved on 10.22.2018 Associate Editor: Fernanda Finotti Cordeiro Perobelli
ABSTRACT
This article aims to analyze if the issuance of Series E Treasury Bonds (CFT-Es) generates abnormal returns in a higher education stock portfolio and verify if the Brazilian higher education market is efficient in its semi-strong form. The main purpose of CFT-Es is to transfer funds to institutions with the aim of providing finance to students enrolled in private universities. These issuances have effects on the capital market, considering that after the program began, the first initial public offering (IPO) of a Brazilian university occurred. Moreover, according to the National Institute for Educational Studies and Research Anísio Teixeira/Ministry of Education and Culture (Inep/MEC), Brazil has the largest market for higher education in Latin America. Several studies have been conducted to analyze the relationship between monetary policy and financial markets, but this has not occurred within the scope of fiscal policy. Such research is appropriate, considering the discussion on the need to contain government spending, but at the same time stimulate the Brazilian economy. The main contribution of the study is it indicates that the higher education market has tended towards the efficiency hypothesis, considering that in the first analysis, H0 was not rejected for 82% of the windows of events, and in the second analysis, H0 was not rejected for any of
the windows of events, with there being no evidence of abnormal gains due to funds being released for the Student Finance Fund (Fies). The event study methodology was used to test the hypotheses of abnormal returns obtained due to CFT-Es being issued through the release of ordinances. A portfolio composed of higher education stocks was elaborated, weighted by the quarterly amount receivable from Fies for each institution, and covering 2009 to 2017. The results show that the stocks of institutions benefiting from Fies tend to react efficiently to CFT-E issuances authorized by the National Treasury.
Keyword: Fies, event study, abnormal returns, higher education, Brazilian higher education market.
Correspondence address
Marília Cordeiro Pinheiro
Universidade de Brasília, Faculdade de Economia, Administração, Contabilidade e Gestão de Políticas Públicas, Programa de Pós-Graduação em Contabilidade
1. INTRODUCTION
Stock prices tend to be sensitive to news related to policies that alter economic activity, given that this has a direct impact on company cash flow, which is reflected in the risk premium for investors and, consequently, in asset returns. Thus, changes in macroeconomic variables are also of interest within the scope of corporate finance.
Based on Keynesian theory, governments interfere with macroeconomic variables in order to achieve economic equilibrium and social well-being. For this, two mechanisms of government control are used: monetary policy and fiscal policy.
In the context of the capital market, the effect of alterations in monetary policy is a topic that is constantly being explored in the academic environment, especially concerning the relationship between interest rate variations and their impact on stock prices. However, unlike with monetary policy, there is a gap in the literature regarding the effect of changes in fiscal policy on the financial market (Afonso & Sousa, 2011).
Fiscal policy relates directly with levels of activity in the private sector, since its two instruments are: control of government revenues, the result of taxes raised by the public sector; and control of government spending, the result of the sum of public sector consumption and investment. These fiscal stimuli are used in order to interfere in economic cycles, whether to extend them or retract them. Despite their aim of correcting market flaws, the benefits derived from fiscal policy generate contradictions, especially with regard to public spending (Blanchard & Perroti, 2002).
Expenditures are initially taken as determinants for development, since they constitute a direct demand for goods and services. However, poor management of these expenditures can create long-term economic instability, due to the growth in public debt, as well as putting pressure on the private sector (Blanchard & Perroti, 2002). Thus, public spending policies cause uncertainties regarding economic strategy, which also impacts capital market expectations.
In Brazil, public spending is primarily funded through internal debt government bonds, issued via public
offerings or direct issuances. Publicly-offered bonds are fixed income assets, normally indexed to price indices, and taken as risk-free assets for the financial market. Direct issuances differ from public offerings as they have a specific purpose, aiming to raise funds for a particular sector.
One example of direct issuances is the Series E, Sub-series 1 Treasury Bond (CFT-E1), issued in favor of the Student Financing Fund (Fies). CFT-E1s are used exclusively to pay higher education institutions in return for financing students enrolled on private higher education courses, professional and technological education courses, and master’s and Ph.D. programs (Law n. 10,260, July 12th of 2001).
Although the main aim of these securities is to capture funds for financing students on private university courses, it should be noted that they have also had an impact on the results of the educational economic sector, since after the program began, in 2007, the first IPO of a higher education institution occurred on the stock exchange. According to the 2015 higher education census of the National Institute for Educational Studies and Research Anísio Teixeira/Ministry of Education and Culture (Inep/ MEC), Brazil has the largest market for higher education in Latin America and the fifth largest in the world.
Based on these considerations, this article aims to answer the following question: do issuances of CFT-E1s intended for Fies generate abnormal returns on higher education institution stocks? The article is appropriate due to the discussion on the duality between the need to reduce public spending and, at the same time, stimulate the Brazilian market. In addition, it is also relevant due to the effect of public spending in the context of the financial market having been barely explored in the Brazilian academic literature.
2. THEORETICAL FRAMEWORK
The main role of the State can be understood within the dimensions of promoting the stability of the infrastructure in its broadest sense: educational, technological, financial, physical, environmental, and social well-being. Since markets do not function within a vacuum, it is essential for the State to guarantee this infrastructure so that the private sector is able to fulfill its central role of generating wealth and, consequently, promoting economic development. As the well-being interest goes beyond the capacity or interest of a single company, this role is attributed to the government (Stiglitz, 1997). According to Angelopoulos, Philippopoulos, and Tsiona (2008), the State has the potential to correct market flaws, as well as causing various distortions in the economy, and in this context the government faces a trade-off based on the size-efficiency relationship. If the government is very big and/or has very low efficiency, the negative effects tend to exceed the positive ones.
In his theory on public finances, Musgrave (1959, 1989) presented three main fiscal roles of the State, which are still widely spread and applied in the context of the public sector: allocative, stabilizing, and distributive. The allocative role is in essence the provision, on the part of the State, of goods and services that the private sector is incapable of satisfactorily providing to society. The distributive role refers to organizing the distribution of income derived from the means of production and sale of the factors in the market. This is achieved through redistributive legislation, based on the majority and primarily aiming to apply a progressive tax policy. Finally, the stabilizing role consists of using fiscal policy instruments to achieve economic equilibrium, primarily based on the pillars of price level stabilization and full employment.
The two fiscal policy instruments consist of taxation and public spending, which when used together with monetary policy aim not only to maintain economic stability, but also development and growth. The main proposal of Keynes (2003) is based on the development of compensatory fiscal mechanisms that enable the absence of private expenditures to be offset when expectations of these expenditures are lower or when the expansionary impulse has decreased. For the author, reducing public
spending causes a decline in economic activity, since government expenditures contribute significantly to economic development, causing the so-called multiplier effect; that is, any alteration in public spending, whether an increase or decrease, will cause an effect that is proportionally greater than the cut or increase made.
Government deficits can be used as a government strategy, since they have various effects on the market, which range from forcing the real interest rate – in order to force the removal of private investments – to the implementation of additional installations and equipment – in order to stimulate the demand for family consumption (Aschauer, 1989). However, there is no consensus among economists regarding the real effect of fiscal policies on the economy. In the 19th century, the British economist David Ricardo (1951) elaborated the concept of Ricardian equivalence (RE), which presents two interpretations. The first is the proposal by Pasinetti (1989), which states that changes in the form of government funding would not alter the income portion of capitalists. The second interpretation is based on the post-Keynesian models, from Barro (1974), in which the Cambridge equation is presented. According to this segment, the long-term growth rate would not be dependent on anything but the tendency to save. With this, for the post-Keynesian RE vision, the form of funding the government deficit would not affect the long-term growth rate of the economy. However, the RE depends on the occurrence of various premises, with there being divergences among the authors regarding its real application.
2.1 Public Spending and Capital Market
Table 1
Studies on the effect of government policies on the capital market
Author(s) Objective Sample Results
Pastor and Veronesi (2012)
To analyze how alterations to government policies in the private sector impact stock returns.
Stocks belonging to Standard & Poor’s 500 (S&P500) and events involving policy alterations in the US economic environment.
Alterations in government policies negatively impact stock returns, increasing volatility. Such behavior is not only due to the uncertainty of investors but also to companies that reduce their investments.
Afonso and Sousa (2011)
To verify the link between fiscal policy and capital market.
Tax exemption and public spending events and the stock prices in the UK, US, German, and Italian markets.
Public spending has a negative effect on stock prices, while tax exemptions, which have a smaller impact on spending, produce positive effects on stock returns.
Belo et al. (2013)
To verify the variation in stock returns caused by alterations in public spending due to the alternation between Republican and Democratic governments.
Portfolios of US sectoral assets weighted according to the share of public resources going to each company.
The sectoral destination of public expenditures varies according to the political party in power, in that both negative and positive abnormal returns are generated for the companies benefited/harmed by the allocation of resources.
Darrat (1988)
To determine market efficiency given monetary and fiscal policy transition announcements.
Quarterly cumulative abnormal returns generated before change of economic policy announcements for the period in the Canadian context.
Past monetary policies have little predictive power with regard to stock returns, in that the market is efficient. However, fiscal policy was shown not to be very predictable, generating abnormal returns on the assets.
Source: Elaborated by the authors.
2.2 Public Spending in the Brazilian Educational Sector
The private higher education sector in Brazil underwent a transformation between 2000 and 2010, due to the public policies of the University for All Program (ProUni) and Fies (Corbucci, Kubota, & Meira, 2016). Both programs are carried out via fiscal policy instruments: ProUni is carried out by tax exemptions, while Fies is funded by CFT issuances, that is, by public spending.
Although private education has a bigger share of the number of college places than the public sector, since the end of the military government there has been a rise in the number of enrollments in private institutions in the last decade (Chaves, 2015). According to data made available by Inep (2016), from 1990 to 2000 there was 87% growth in private institution students, from 2000 to 2010 the number increased by 162%, and from 2010 to 2013 there was 13% growth. Some of this increase can
be explained by the expansion of both programs. In the period between 2005 and 2014, the number of scholarships granted by Fies varied by more than 800%, while ProUni saw an increase of approximately 130%.
Although the programs were devised as a distributive fiscal policy, it should be noted that they also caused effects in the private higher education market. Based on the database of the Union of Higher Education Establishment Entities in the State of São Paulo (Semesp) (2016), in 2000 there were 1,004 private institutions. By 2007, this number had risen to 2,032, and maintained a pattern of growth until 2012, when there were 2,113 institutions. After this period, there was a decline in the number of institutions, with there being 2,070 in 2014. This may have been caused by the purchase of smaller universities/ faculties by larger ones. Although there was a reduction in the number of private institutions, in 2014 these still accounted for approximately 71.5% of all students enrolled on presential courses.
3. METHODOLOGY
This article aims to analyze the impact of issuances of CFT-E1s intended for Fies on the stock returns of companies in the publicly-traded higher education sector. For this, the following hypotheses are tested:
H0: CFT-E issuances generate abnormal returns on stocks belonging
to the educational sector;
H1: CFT-E issuances do not generate abnormal returns on stocks
The following subsections present the procedures used to test the proposed hypotheses.
3.1 Data
To compose the sample, the stocks were gathered of all higher education institutions that are or were publicly traded during the period from January of 2008 to December of 2017. It should be noted that assets from this specific market niche were selected with the aim of
discovering the direct effect of Fies on the asset returns of universities that benefited directly from the program. Next, the daily liquidity of stocks criterion was used, that is, of universities whose assets were traded daily on the B3, totaling five institutions. The database used to collect the quotations was Economatica.
Table 2 contains the information on the companies, their stocks, the analysis period, and the number of observations.
Table 2
Description of the assets used in the sample
Company Stock Date of trading Observations
(n)
Anhanguera Educacional AEDU3 12/06/2010 to 07/03/2014 885
Anima Educação ANIM3 10/25/2013 to 12/30/2017 1,030
Kroton Educacional KROT3 07/14/2008 to 12/28/2017 2,296
Ser Educacional S. A. SEER3 10/28/2013 to 12/28/2017 1,030
Estácio Participações ESTC3 07/10/2008 to 12/28/2017 2,034
Source: Elaborated by the authors.
Note that the sample period for Anhanguera Educacional (AEDU3) closed before those of the other companies due to the merger with Kroton Educacional (KROT3), which meant its stocks ceased to be traded on the stock exchange.
With relation to the events analyzed, the dates were chosen of the ordinances available on the National Treasury website with authorizations for direct issuances intended for Fies. Eighty-four issuance events involving debt securities intended for the program were studied. To analyze the tests, the first date to be considered will be April 6th of 2009, due to the need to estimate parameters (180 days) calculated based on the record of quotations prior to the event. In the months in which the values of the direct issuances were divided, when there was the release of more than one ordinance, the largest value event was considered as a solution so that there was no overlapping between the events.
To compose the expected returns estimation regression models, macroeconomic variables were collected from the website address of the Applied Economic Research Institute Data Science Laboratory (Ipeadata) with daily frequency, given that for the applied methodology the daily quotations of the Bovespa Index (Ibovespa) were used, as it is the most representative theoretical portfolio in the Brazilian market.
3.2 Method
As a way of fulfilling the aim of this article, the events studies method was adopted, which is a tool traditionally used to analyze the impact of events, particularly of an economic nature, on the value of companies’ stocks. As established by MacKinlay (1997), the first procedure to be carried out in an events study is to identify the event of interest, which for this study consists of the authorization to issue CFT-Es with the resources intended for Fies, carried out via ordinances released by the National Treasury. Next, it is necessary to define the period around the event in which the stock returns will be examined – the window of events. To choose the window of event, the date of issuance was defined as day 0 and a period of -4 and +4 for observing the returns, taking into consideration that this interval cannot be longer, in order to avoid other different events from the target one being included in the analysis. Next, an observation period prior to the window of events (called the window of estimation) is chosen, with an interval of -180 days prior to t0. The window of estimation is used to calculate the parameters of the expected stock returns, as will be described below.
Table 3
Analysis periods of the window of events
Window Period of the window for analysis
1 -4 to 0
2 0 to +4
3 -4 to +4
Source: Elaborated by the authors.
Having defined the event and windows of event and of estimation, the returns on the assets of the companies selected for the analysis are calculated, in this case higher education institutions with stocks traded on the market. The logarithmic form was used to calculate the daily return, obtained by the following equation:
in which Ritis the observed return, Pitis the price of asset
i on day t, and Pit-1is the price of asset i on day t-1.
Next, as a way of reducing the effects of specific events of each institution (mergers, purchase, sales, etc.), a portfolio was elaborated, weighted by the proportion of the quarterly Fies amount to be transferred to each one of the institutions. This information was collected based on the quarterly income statement of the institutions, so that the portfolio is updated with the same periodicity. The equation below presents the procedure for calculating the weights of the stocks in the portfolio.
in which Wiis the weight of stock i in the portfolio, Qiis the Fies amount to be transferred to institution i, and Qtis the total Fies amount to be transferred to the institutions in the Fies sample.
It should be noted that:
Thus, the total daily return on the portfolio of the higher education institutions is obtained by:
That is, the total return RT is the result of the sum of the returns on the assets weighted by their share in the portfolio.
To calculate the expected portfolio return, the Capital Asset Pricing Model (CAPM) created by Sharpe (1964) and by Lintner (1965) was used, along with the Arbitrage Pricing Theory (APT) created by Ross (2013), both models
being widely applied for estimating the pricing of assets. The CAPM is based on the premise that the risk of a stock should be measured in relation to a comprehensive market portfolio (Fama & French, 2007).
The model is given by the following equation:
in which Rfis the return on the risk-free asset (Interbank Deposit Certificate – CDI), βm is the angular coefficient, and Rmis the return on the market portfolio (Ibovespa).
The APT emerges as a response to the simplicity of the CAPM, since this is a generalized single-factor model. Considering the premise that market efficiency should be consistent with the arbitrariness of the income from trading, the APT shows that every equilibrium is characterized by a linear relationship between the expected return on the asset and macroeconomic factors that are relevant in its risk (Roll & Ross, 1980). It is not specified which and how many factors are adequate, so that the model assumes the following form:
in which λ corresponds to the number of explanatory factors for the expected return of Ri.
Having carried out the expected returns calculations, the abnormal return is calculated, which corresponds to the residual of each daily return in relation to its expected value, given by:
in which Ai,tis the abnormal return on asset i in t, Ri,t is the return obtained on asset i in t, and REi,tis the expected return on asset i in t.
To analyze the results of the test, the cumulative abnormal return was calculated for each period of the window, obtained by:
in which CARi,tis the sum of the abnormal returns. Finally, the annual average return of all the aggregated events for each period of the window was calculated, in accordance with:
in which in which ∑����𝑅𝑅𝑅𝑅𝑅𝑅�,� is the sum of the abnormal returns on the portfolio for each period and is the sum of the abnormal returns 𝑛𝑛 on the portfolio for each period and is the number of
events in the year.
3.3 Statistical Test
Considering that the statistical parametric tests do not consider normality of the sample prior to choosing
1
𝑅𝑅�� = ln �𝑃𝑃𝑃𝑃�� ��� �
2 𝑊𝑊�=𝑄𝑄𝑄𝑄�
�
3 𝑤𝑤�+ 𝑤𝑤�+ ⋯ 𝑤𝑤�= 1
4 𝑅𝑅� = � 𝑤𝑤�(𝑅𝑅�)
�
���
5
E(𝑅𝑅�) = 𝑅𝑅�+ 𝛽𝛽��𝑅𝑅�− 𝑅𝑅��
6 𝐸𝐸(𝑅𝑅�) = 𝑅𝑅�+ 𝛽𝛽�λ�+ 𝛽𝛽�λ�+ 𝛽𝛽�λ�… + 𝛽𝛽�λ�
7
A�,�= R�,�− 𝑅𝑅𝑅𝑅�,�
8
CAR�,�= � A�,� �
���
9
𝑅𝑅𝑅𝑅𝑅𝑅�,�
the test of significance, the Jarque-Bera normality test was carried out. Its null hypothesis is that, if the p-value is higher than 0.05, the normality of the sample is accepted; otherwise, it is rejected. As H0 was rejected, the non-parametric Wilcoxon Signed-Rank test was used, taken as an alternative to the t test when the condition of normality is not satisfied. The test is provided by:
in which 𝑟𝑟�� is the positive classification of the absolute
value of the abnormal returns.
This test assumes that none of these absolute values is equal and, additionally, that each one is a non-null value (Dutta, 2014).
4. EMPIRICAL ANALYSIS
4.1 Descriptive Analysis
Table 4 presents the annualized statistical calculations of the portfolio and, for comparative purposes, of the Ibovespa and CDI (considered the risk-free asset). Mean return,
median, standard deviation, risk premium represented by the Sharpe index, asymmetry and kurtosis were calculated. The data were obtained based on the monthly returns from January of 2008 to December of 2017.
Table 4
Descriptive statistics for the period from 2008 to 2017
Portfolio Ibovespa CDI
Annualized mean return (%) 34.11 2.90 10.81
Median -0.03 0.01 0.80
Standard deviation 43.48 29.28 0.01
Sharpe index 0.23 -0.27
-Asymmetry 3.40 0.10 -0.11
Kurtosis 41.33 6.51 -1.10
CDI = Interbank Deposit Certificate; Ibovespa = Bovespa index. Source: Elaborated by the authors.
Based on Table 4, it is observed that, for the sample period, the portfolio composed of educational sector stocks was the investment that provided the highest return, but also the one that presented the greatest volatility. The kurtosis coefficient indicates a leptokurtic distribution, which is common in financial series, with fat tails and a bottleneck around the mean. The distribution was also shown to be asymmetric to the right. The risk premium of the portfolio was 0.233. The Ibovespa, a proxy for the market portfolio, obtained the lowest mean return among the three assets, returning a negative risk premium, although its volatility was lower than that of the educational portfolio. The kurtosis and asymmetry coefficients also indicate the non-normality of the distribution of the returns. The CDI was the only asset that presented a platikurtic distribution, characterized as being flatter than normal. In addition, it presented negative asymmetry, which may have been an effect of the policy of reducing interest rates in the last two years.
Robustness statistical tests were also carried out for the pricing calculation models used, the CAPM and
APT, as a way of supporting the results found. First, the p-values of the explanatory variables for the expected return were calculated, with the aim of verifying the quality of the regression. In addition, the augmented Dickey-Fuller (ADF) test was also carried out, with the aim of verifying whether the series are stationary and, consequently, whether the regression is spurious. Table 5 presents the results found for the CAPM model, while Table 6 presents those for the APT model.
Table 5
Performance of the Capital Asset Pricing Model (CAPM)
Variable Coefficient p-value
Intercept 0.01 0.03
Market premium (Rm-Rf) 0.54 0.00
R² 0.123
-Source: Elaborated by the authors.
According to Table 5, the market premium presented a significant and positive relationship in the expected return of the higher education stocks portfolio. The results
10 𝑤𝑤 = � 𝑟𝑟��
�
of the ADF test returned critical values of 3.96 at 1% significance and -3.41 at 5%, which are superior to the statistical value of -12.80, enabling the rejection of H0 of a unit root for the two confidence intervals, confirming that the regression is not spurious and is I (0). Despite the favorable results, it is noted that the R² returned a coefficient of 0.12, indicating a low value for quality of adjustment of the regression.
Table 6
Performance of the Arbitrage Pricing Theory (APT) model
Variable Coefficient p-value
Intercept 0.01 0.03
Market premium (Rm) 0.54 0.00
EMBI -0.05 0.00
Dollar 0.80 0.00
R² 0.60
-EMBI =Emerging Markets Bond Index Plus. Source: Elaborated by the authors.
Table 6 contains the results of the macroeconomic variables that were significant in the estimation of the pricing of the educational portfolio based on the APT model. The Emerging Markets Bond Index Plus(EMBI), the most widely used measure for measuring country risk, presented an inverse relationship with expected return, which was predicted, given that the lower the sovereign risk, the lower the discount rate, the greater the discounted cash flow, and, consequently, the greater the value of the companies. However, the dollar showed a positive relationship, which may be due to the share of foreign capital in these institutions. The results of the ADF test returned critical values of -3.43 at 1% significance and -2.86 at 5%, which are superior to the statistical value of -43.09, leading to the rejection of H0 of a unit root for the
two confidence intervals, confirming that the regression is not spurious and is I (0). The R² returned a value of 0.60, showing better quality of adjustment of the regression when compared to the CAPM.
4.2 Events Study
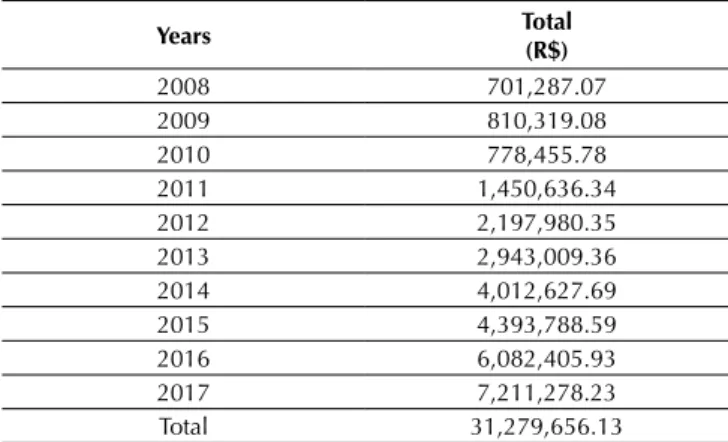
To help in the interpretation of the results obtained from the events study, Table 7 was used, which contains the annual values of CFT-E1s intended for Fies issued by the National Treasury.
Table 7
Annual issuances intended for the Student Finance Fund (Fies) from 2008 to 2017
Years Total
(R$)
2008 701,287.07
2009 810,319.08
2010 778,455.78
2011 1,450,636.34
2012 2,197,980.35
2013 2,943,009.36
2014 4,012,627.69
2015 4,393,788.59
2016 6,082,405.93
2017 7,211,278.23
Total 31,279,656.13
Source: Elaborated by the authors.
Table 8 presents the results of the cumulative abnormal returns and of the Wilcoxon statistical test at 5% significance for the CAPM model, while Table 9 presents the same information, but obtained by the APT model. Remember that the latter returned a higher coefficient of determination than the CAPM, indicating better explanatory power of the independent variables.
Table 8
Abnormal returns and p-values from the Capital Asset Pricing Model (CAPM) for the periods from 2009 to 2017 Periods
t-4 to t0 t0 to t+4 t-4 to t+4
2009
Abnormal return (%) 6.35 1.00 2.75
p-value 0.146 0.405 0.238
2010
Abnormal return (%) 0.32 -0.01 -0.01
p-value 0.595 0.145 0.359
2011
Abnormal return (%) -0.01 2.22 -3.90
p-value 0.072 0.000 0.000
2012
Abnormal return (%) -0.01 1.75 1.18
Periods
t-4 to t0 t0 to t+4 t-4 to t+4
2013
Abnormal return (%) -1.45 0.01 -3.06
p-value 0.213 0.287 0.128
2014
Abnormal return (%) 2.88 -0.74 1.24
p-value 0.1348 0.463 0.600
2015
Abnormal return (%) 1.48 7.40 8.12
p-value 0.49 0.001 0.001
2016
Abnormal return (%) 0.12 0.17 3.26
p-value 0.074 0.057 0.498
2017
Abnormal return (%) 0.01 1.26 2.23
p-value 0.761 0.851 0.878
Source: Elaborated by the authors.
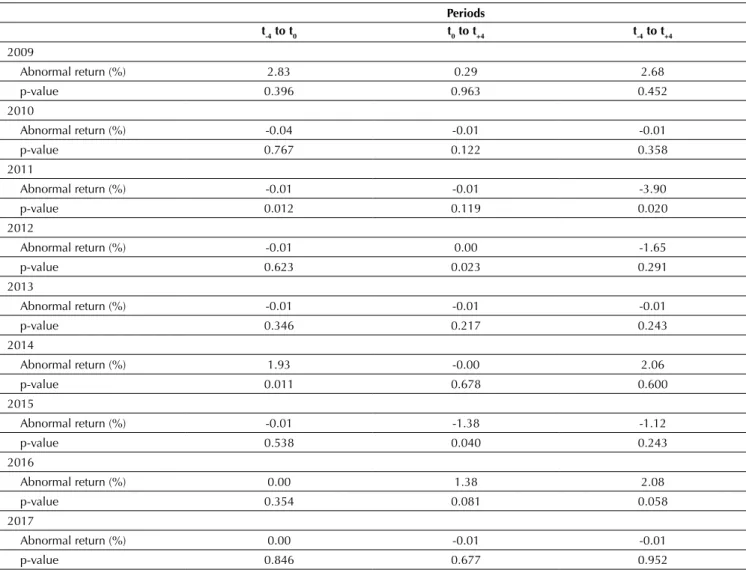
Table 9
Abnormal returns and p-values from the Arbitrage Pricing Theory (APT) model for the periods from 2009 to 2017
Periods
t-4 to t0 t0 to t+4 t-4 to t+4
2009
Abnormal return (%) 2.83 0.29 2.68
p-value 0.396 0.963 0.452
2010
Abnormal return (%) -0.04 -0.01 -0.01
p-value 0.767 0.122 0.358
2011
Abnormal return (%) -0.01 -0.01 -3.90
p-value 0.012 0.119 0.020
2012
Abnormal return (%) -0.01 0.00 -1.65
p-value 0.623 0.023 0.291
2013
Abnormal return (%) -0.01 -0.01 -0.01
p-value 0.346 0.217 0.243
2014
Abnormal return (%) 1.93 -0.00 2.06
p-value 0.011 0.678 0.600
2015
Abnormal return (%) -0.01 -1.38 -1.12
p-value 0.538 0.040 0.243
2016
Abnormal return (%) 0.00 1.38 2.08
p-value 0.354 0.081 0.058
2017
Abnormal return (%) 0.00 -0.01 -0.01
p-value 0.846 0.677 0.952
Source: Elaborated by the authors. Tabela 8
Initially, by comparing the abnormal returns obtained by the CAPM and APT, a heterogeneous behavior is observed, given that the first model presented a positive mean for seven of the nine years analyzed, indicating that the issuance of CFT-Es is favorable to the return on the educational portfolio, while the second one showed that the issuances were favorable only for 3 years. For the CAPM, the year that returned the highest mean abnormal returns was 2015 (5.67%), while 2013 presented the lowest mean (-1.50%). The second interval of the window of analysis (t0 to t+4) presented the highest mean returns, while the first (t-4 to t0) presented the lowest. Thus, based on the CAPM, the results are consistent with those of Fisher and Peters (2010) and Belo et al. (2013), showing that stocks of companies belonging to sectors benefited by public spending policies tend to react positively.
In the APT model, 2009 presented the highest mean abnormal returns (1.93%) and 2011 presented the lowest (-1.31%), which was not expected considering that it was the year that saw the highest percentage growth in the value of issuances in relation to the previous year. The first interval (t-4 to t0) obtained the highest mean abnormal returns (0.52%), while the third (t-4 to t+4) presented the lowest. This may be indicative of the market’s anticipation in response to the expectation of the amount of CFT-E issuances. For the model, in general, the annual mean abnormal returns was mostly negative, indicating return below that priced by the APT. This result, in the context of the educational sector, is consistent with the study by Laopodis (2009), in which it was found that the market tends to react with mistrust to an increase in public spending, primarily due to the generation of an economic deficit that impacts the sustainability of the country’s debt and, consequently, pressures the private sector.
When the efficiency hypothesis was tested and the significance of the abnormal returns analyzed, the behavior was relatively homogenous, given that the two models returned five statistically significant abnormal returns (18% of the windows) and that 2011 was the year that accounted for two of these results (CAPM t-0
to t+4; t-4 to t+4;APT t-4 to t+0; t-4 to t+4). Based on Table 7, it is observed that 2011 saw the highest percentage variation versus the previous year of CFT-E issuances (86%), which may have generated instability in relation to the market expectations in response to the returns on higher education stocks.
For the CAPM model, 2015 (t-0 to t+4; t-4 to t+4) also showed market inefficiency for two of the windows analyzed and 2012 only showed inefficiency for the second interval (t0 to t+4). One factor to consider is that 2011 and 2015 were post-election years, which tends to generate oscillations in market expectations in response to alterations in the political-economic cycles, even though the same government remains. According to Baker, Bloom, and Davis (2016), uncertainties in the political guidelines are directly reflected in market volatility, especially in sectors that are more dependent on the government, which may have caused the inefficiency for these two specific periods. In the APT, 2012 and 2015 were inefficient for the second interval (t0 to t+4), while 2014 only was for the first (t-4 to t0). No specific pattern of abnormality was found based on the issuance amounts, considering that although 2012 had the second percentage growth in issuance value (51%), 2015 and 2014 had median variations (9 and 36%). Thus, for the first part of the analysis and for the two pricing models, H0 was not rejected for 82% of the windows of event relating to CFT-E issuances, showing a tendency towards the market efficiency hypothesis in its semi-strong form for the higher education stocks.
With the aim of confirming the results found in the first analysis, a second test was also carried out, considering the complete sample period (2009-2017). Besides the three 4-day windows of events, another three intervals (t-1 tot0,t0 tot+1, and t-1 tot+1) were included, with the aim of observing the effect of the issuances on the stock returns in the period immediately after and immediately before the event. Tables 10 and 11 present the cumulative abnormal returns for each pricing model of all the events in the sample and their respective p-values resulting from the Wilcoxon Signed-Rank test at 5% significance.
Table 10
Abnormal returns and p-values of the cumulative abnormal returns from the Capital Asset Pricing Model (CAPM) aggregated annually from 2009 to 2017
2009-2017
Windows 1 2 3
Periods t-4 to t0 t0 to t+4 t-4 to t+4
Aggregated abnormal return (%) 0.36 0.41 0.84
p-value 0.782 0.246 0.086
Periods t-1 to t0 t0 to t+1 t-1 to t+1
Aggregated abnormal return (%) -0.01 0.23 0.13
p-value 0.778 0.176 0.001
Table 11
Abnormal returns and p-values of the cumulative abnormal returns from the Arbitrage Pricing Theory (APT) model aggregated annually from 2009 to 2017
2009-2017
Windows 1 2 3
Periods t-4 to t0 t0 to t+4 t-4 to t+4
Aggregated abnormal return (%) 0.31 0.43 0.81
p-value 0.491 0.896 0.314
Periods t-1 to t0 t0 to t+1 t-1 to t+1
Aggregated abnormal return (%) -0.08 -0.04 0.52
p-value 0.328 0.299 0.551
Source: Elaborated by the authors.
For this analysis, based, firstly, on the first 4-day window, the signs of the abnormal returns obtained both for the CAPM and for the APT were homogenous, indicating a positive market reaction to the CFT-E issuances. This reaction converges with that of the first part for the CAPM, with there being a positive tendency in the stock returns of companies directly benefited by public policies. This was expected, considering that Fies directly impacts the number of students enrolling in the institutions and the cash flow generated. For the APT, which had negative mean abnormal returns in the first analysis, the results were divergent, which may have been caused by particular expectations regarding the annual returns, given that each year has its own characteristic economic cycle and that the model used considered three macroeconomic variables for estimation.
Considering the additional window of event of only 1 day, the signs were different only for the second interval; in the first window (t-1 to t0), both presented negative coefficients, which may indicate an underestimation of the market in relation to the amount going to the program.
For the two other windows, the CAPM presented positive coefficients (t0 to t+1; t-1 to t1), which is consistent with the previous analyses, while the APT presented negative abnormal returns for the second interval (t0 to t+1) and positive ones for the third (t-1 to t1).
When the p-values of the intervals were analyzed, the results of the two windows of event tested were convergent, with no statistically significant abnormal returns. Thus, it is concluded that the market for higher education stocks was efficient in its semi-strong form for the event of issuance of debt securities, supporting the efficient market hypothesis that investors incorporate all available information into the pricing of the asset, with there being no abnormal gains derived from the release of resources for Fies. Comparing the results with other studies carried out within the scope of monetary policy, the results converge with those of Gonçalves and Eid (2011) and Zabot, Caetano, and Caldeira (2013), who did not find evidence of abnormalities in the stock returns before Monetary Policy Committee (Copom) announcements of an alteration in the interest rate.
5. FINAL REMARKS
This article aimed to analyze the impact and market efficiency of the event of direct issuances of CFT-Es on the return on private higher education institution stocks traded on the B3. For this, the events studies methodology was used and the aggregated abnormal returns were calculated for three periods of the window of events: t-4 to t0; t0 to t+4; and t-4 to t+4. The sample is composed of five private institutions and the period analyzed for the issuance events covered 2009 to 2017, totaling 84 events. As a way of reducing the effects of individual events occurring in each teaching institution, a portfolio was elaborated, which was updated quarterly and weighted by the values of the Fies transfers received
by each university. For the expected return calculation, the CAPM and APT models were used, and the latter presented a higher coefficient of determination, indicating better quality of adjustment of the regression.
the highest number of rejections. Despite the APT having returned negative mean abnormal returns in 2011, the inefficiency result may have been due to two factors: the first being the political uncertainties, given that 2011 corresponds to a post-electoral cycle; and the second being the variation in the amount of CFT-E issuances, with 2011 being the year with the highest percentage variation versus the previous year in the sample.
A second analysis was carried out with the aim of confirming the results found, but considering cumulative abnormal returns for the complete sample period and including an additional window with a 1-day interval. The results for the aggregate period were less heterogeneous between the models, and for the 4-day interval both showed a positive market reaction to the issuances. For the 1-day window of events, the CAPM returned a negative coefficient only for the first window, while the APT presented negative signs for the first and second windows. The divergent results between the two analyses carried out for the APT may be the result of specific macroeconomic factors for the years, due to the model incorporating more than one relevant factor in the estimation of the portfolio price.
The study, however, presents some limitations. First, the Brazilian scenario from 2008 to 2012 underwent
transitions that vary between periods of economic expansion and contraction, so that other factors may have affected the behavior of the stocks. In addition, the educational sector also underwent transformations, with there being, over the course of the period, events such as acquisitions of smaller institutions, which may also have affected the price. It should also be considered that, as it is a relatively recent sector when compared to others in the B3, the stocks may have been more sensitive to speculations, such as uncertainties in relation to the continuation of educational public policies. With regard to the method, the conclusions of the event study are limited both by the specific weaknesses of the models used to estimate the portfolio price and by the length of the window of analysis, in that for a longer or shorter interval than that of the window applied, the abnormality results could be different.
For future studies, we suggest conducting the same research, but considering ProUni, carried out via tax exemption, thus exploring the other dimension of the fiscal policy. We also suggest studying the effect of the public spending for other economic sectors, since this approach has still barely been explored in finance research.
REFERENCES
Afonso, A., & Sousa, R. M. (2011). What are the effects of fiscal
policy on asset markets? Economic Modelling, 28(4),
1871-1890.
Angelopoulos, K., Philippopoulos, A., & Tsionas, E. (2008). Does public sector efficiency matter? Revisiting the relation between fiscal size and economic growth in a world sample.
Public Choice, 137(1-2), 245-278.
Aschauer, D. A. (1989). Is public expenditure productive? Journal
of Monetary Economics, 23(2), 177-200.
Baker, S. R., Bloom, N., & Davis, S. J. (2016). Measuring economic
policy uncertainty. The Quarterly Journal of Economics,
131(4), 1593-1636.
Barro, R. J. (1974). Are government bonds net wealth? Journal of
Political Economy, 82(6), 1095-1117.
Belo, F., Gala, V. D., & Li, J. (2013). Government spending, political cycles, and the cross section of stock returns. Journal of Financial Economics, 107(2), 305-324.
Blanchard, O., & Perotti, R. (2002). An empirical characterization of the dynamic effects of changes in government spending and taxes on output. The Quarterly Journal of Economics, 117(4), 1329-1368.
Caparelli, C. E., Barros, L. A. B. C., & Dias, E. A. (2010). Sustentabilidade e retorno ao acionista: um estudo sobre o índice de sustentabilidade empresarial. XIII SemeAd –
Seminários em Administração. São Paulo, SP. Retrieved from http://www.anpad.org.br/admin/pdf/FIN-B946.pdf
Chaves, V. L. J. (2015). Política de financiamento e a expansão da educação superior no Brasil: o público e o privado em questão. ETD: Educação Temática Digital, 17(2), 427-441. Chen, N. F., Roll, R., & Ross, S. A. (1986). Economic forces and
the stock market. Journal of Business, 59(3), 383-403. Corbucci, P. R., Kubota, L. C., & Meira, A. P. B. (2016). Evolução
da educação superior privada no Brasil: da reforma
universitária de 1968 à década de 2010. Retrieved from http:// repositorio.ipea.gov.br/bitstream/11058/7066/1/Radar_n46_ evolu%C3%A7%C3%A3o.pdf.
Darrat, A. F. (1988). On fiscal policy and the stock market. Journal
of Money, Credit and Banking, 20(3), 353-363.
Dutta, A. (2014). Parametric and nonparametric event study tests: A review. International Business Research, 7(12), 136. Fama, E. F., & French, K. R. (2007). The Capital Asset Pricing
Model: Theory and evidence. Journal of Economic Perspectives,
18(3), 25-46.
Fisher, J. D., & Peters, R. (2010). Using stock returns to identify
government spending shocks. The Economic Journal,
120(544), 414-436.
Gonçalves, R. S., Barbosa, N. M., Barroso, C. R., & Medeiros, O.
eventos em empresas brasileiras abertas no período de 2005 a 2012. Revista de Contabilidade e Organizações, 9(24), 56-70. Gonçalves, W., Junior & Eid, W., Junior (2011). Surpresas com
relação à política monetária e o mercado de capitais: evidências do caso brasileiro. Revista de Economia Política, 31(3), 435-454. Instituto Nacional de Estudos e Pesquisas Educacionais Anísio
Teixeira. (2016). Censo da educação superior. Retrieved from http://download.inep.gov.br/educacao_superior/ censo_superior/documentos/2016/notas_sobre_o_censo_da_ educacao_superior_2016.pdf
Keynes, J. M. (2003). The general theory of employment, interest,
and money [Versão digital]. Retrieved from https://ebooks. adelaide.edu.au/k/keynes/john_maynard/k44g/complete.html. Laopodis, N. T. (2009). Fiscal policy and stock market efficiency:
Evidence for the United States. The Quarterly Review of
Economics and Finance, 49(2), 633-650.
Law n. 10,260, of July 12th of 2001. (2001, July 12th). Describes the
Higher Education Student Finance Fund and makes other arrangements. Retrieved from http://www.planalto.gov.br/ ccivil_03/LEIS/LEIS_2001/L10260.htm.
Lintner, J. (1965). Security prices, risk, and maximal gains from diversification. The Journal of Finance, 20(4), 587-615. MacKinlay, A. C. (1997). Event studies in economics and finance.
Journal of Economic Literature, 35(1), 13-39.
Musgrave, R. A. (1959). Theory of public finance: a study in public economy. New York, N.Y.: McGraw Hill.
Musgrave, R. A. (1989). The three branches revisited. Atlantic
Economic Journal, 17(1), 1-7.
Pasinetti, L. L. (1989). Ricardian debt/taxation equivalence in the
Kaldor theory of profits and income distribution. Cambridge
Journal of Economics, 13(1), 25-36.
Pastor, L., & Veronesi, P. (2012). Uncertainty about government policy and stock prices. The Journal of Finance, 67(4), 1219-1264.
Ricardo, D. (1951). The works and correspondence of David
Ricardo. On the principles of political economy and taxation. P. Sraffa, M. H. Dobb. (Eds.). Cambridge:
Cambridge University.
Roll, R., & Ross, S. A. (1980). An empirical investigation of the Arbitrage Pricing Theory. The Journal of Finance, 35(5), 1073-1103.
Ross, S. A. (2013). The arbitrage theory of capital asset pricing. In
Handbook of the fundamentals of financial decision making: Part I (pp. 11-30). Singapore: Word Scientifc.
Sindicato das Entidades Mantenedoras de Estabelecimentos de Ensino Superior no Estado de São Paulo. (2016). Mapa do Ensino Superior do Brasil. Retrieved from http:// convergenciacom.net/pdf/mapa_ensino_superior_2016.pdf Sharpe, W. F. (1964). Capital asset prices: A theory of market
equilibrium under conditions of risk. The Journal of Finance,
19(3), 425-442.
Stiglitz, J. E. (1997). The role of government in economic
development. In Annual World Bank Conference on
Development Economics (p. 11-23). Washington, DC. Zabot, U. C., Caetano, S. M., & Caldeira, J. F. (2013). Antecipação
e surpresa monetária e seus efeitos nas taxas de juros de