Characterization of Portuguese old varieties of
hazelnut (Corylus avellana L.) by morphological,
molecular, biochemical and nutritional parameters
Tese de Doutoramento em
Genética Molecular Comparativa e Tecnológica
Sandra Cristina Regalado Martins
Professor Catedrático Valdemar Pedrosa Carnide
Doutor José António Santos Pereira Matos
regulamentos em vigor da Universidade de Trás-os-Montes e Alto Douro. Declaro, ainda, que as doutrinas apresentadas nesta Tese de Doutoramento são da inteira responsabilidade do autor.
Ao Magnífico Reitor da Universidade de Trás-os-Montes e Alto Douro, Professor Catedrático António Augusto Fontainhas Fernandes, pela disponibilização dos meios físicos para a realização desta tese.
À Escola de Ciências da Vida e do Ambiente, na pessoa do atual Presidente Professor Doutor Luís Herculano Melo de Carvalho, pela disponibilização dos meios físicos para a realização deste trabalho.
À comissão permanente do conselho científico da Escola de Ciências da Vida e do Ambiente, na pessoa do seu atual Presidente, Professor Doutor Victor Manuel Machado dos Reis, pela aceitação da intenção de Doutoramento.
Ao IBB/CGB-UTAD – Instituto de Bioengenharia e Biotecnologia, Centro de Genómica e Biotecnologia da Universidade de Trás-os-Montes e Alto Douro, nas pessoas dos seus antigos Diretores, os Professores Doutores Henrique Guedes-Pinto e Arlete Mendes-Faia, expresso o meu profundo agradecimento pela disponibilização de meios para a realização desta tese.
Às Comissões do 3º Ciclo em Genética Molecular Comparativa e Tecnológica, na pessoa da Professora Doutora Paula Filomena Martins Lopes, pelo trabalho realizado, que garantiu a continuidade deste curso e o término do meu doutoramento.
À Fundação para a Ciência e a Tecnologia, pela concessão da bolsa de doutoramento (SFRH / BD / 40686 / 2007), sem a qual seria impossível a concretização deste trabalho.
Ao meu Orientador, Sr. Professor Catedrático Valdemar Carnide, pelo seu conhecimento, pela amizade, por o aconselhamento, pelo apoio e disponibilidades constantes, pela competência e pela orientação deste trabalho, muito obrigada.
Ao meu Coorientador Doutor José António Santos Pereira Matos, pelo seu conhecimento, pela orientação deste trabalho, profissionalismo, competência, e por toda a ajuda e disponibilidade, muito obrigada.
À Doutora Fernanda Paula Silva Simões de Matos, agradeço pelos ensinamentos, conselhos, por toda a ajuda técnica e científica, e por toda a amizade e motivação que sempre me transmitiu que foram contribuições essenciais para o sucesso deste trabalho.
sempre me transmitiu.
À Doutora Mercè Rovira, por me ter acolhido no centro de investigação IRTA- Mas Bover em Reus, Espanha, para a realização do trabalho de alelos de incompatibilidade, pela ajuda técnica e científica, e por toda a amizade e motivação que me transmitiu, que foram contribuições essenciais para este trabalho.
À Professora Doutora Maria Manuela Outeiro de Matos, agradeço pela revisão da tese, pelos conselhos, e por toda a amizade e motivação que sempre me transmitiu.
À Doutora Ana Isabel Carvalho, agradeço os conselhos, a amizade, a paciência, a revisão da tese, e pelo apoio e incentivo que sempre me deu.
Aos funcionários do DGB, em particular à Sr.ª Dona Cecília, ao Sr. Alcídeo e ao Sr. Ilídio agradeço a ajuda nos trabalhos de campo e por toda a amizade.
A todos os meus amigos, pela paciência, apoio e incentivo que me deram, o meu muito Obrigada.
Por último, mas não de somenos importância, agradeço à minha querida mãe e ao meu querido marido, as palavras de incentivo, a ajuda prestada a diferentes níveis e o apoio incondicional que sempre me ofereceram. Para vocês os dois, um Especial
Obrigado!!
E a todos os que de algum modo contribuíram para o sucesso deste trabalho, e que os inevitáveis lapsos de memória me impedem de ter presente neste momento, sendo igualmente merecedores do meu reconhecimento.
AFLP - Amplified Fragment Length Polymorphism Al - Aluminum
AMOVA- analysis of molecular variance
AOAC - Association of Official Analytical Chemists BCAAs - Branched-Chain Amino Acids
Bo – Boron bp - Base pair BP – Before Present
BSA – Bovine Serun Albumin °C - Degree Celsius
Ca - Calcium
CAC – Microsatellite primer developed in Corvallis CAPS - Cleaved Amplified Polymorphic Sites CaT – Microsatellite primer developed in Torino Ccmp – Consensus Chloroplast microsatellite primer Cd - Cadmium
cm - Centimeter Co - Cobalt
cpDNA - Chloroplast DNA
cpSSR - Chloroplast microsatellites Cu - Copper
DK - Ad hoc statistic
DNA – Deoxyribonucleic acid
dNTPs - Deoxyribonucleotides (dATP, dCTP, dGTP, dTTP)
EcoRI – Restriction endonuclease isolated from Escherichia coli
EDTA – Ethylene-diamine-tetraacetic acid EMR - Effective multiplex Ratio
F – Forward
FAM – 6-carboxyfluorescein
FAO - Food and Agriculture Organization
Fst – Fixation index g – Gram
GABA - Gamma-Aminobutyric Acid GLA - Gamma Linolenic Acid
GST- Relative magnitude of differentiation among groups H - Genetic diversity H2O - Water Ha - Hectare HDL - High-Density Lipoprotein HEX – Hexachorofluorescein Hg - Hectogram
HindIII – Restriction enzyme isolated from Haemophilus influenzae
HPLC - High Performance Liquid Chromatography HS- Genetic Diversity within groups
HSD - Honestly Significant Difference HT- Total Genetic diversity
HTP - High-Throughput
I - Shannon’s Information index
INDEL - Insertion-Deletion polymorphism INE – Instituto Nacional de Estatística
IRTA - Institute of Research and Technologie food and Agriculture ISSR –Inter-Simple Sequence Repeats
K – Number of populations K - Potassium
Ka BP – Thousands years ago Kbp – Kilobase
Km – Kilometers
LDL - Low-Density Lipoprotein m - Meter
MCMC - Markov Chain Monte Carlo Mg - Magnesium
MI - Marker index min - Minutes mm – Millimeter Mn - Manganese
MseI – E. coli strain that carries the cloned MseI gene from Micrococus species
MUFA – Monounsaturated Fatty Acids N - Nitrogen
N - North
Na - Number of alleles Na – Sodium
Ne - Effective Number of alleles ng - Nanograms
NGS - Next Generation Sequencers Ni - Nickel
NILs - Non-Isogenic Lines NJ - Neighbor Joining Nm- Estimate of Gene Flow nm - Nanometre
nSSR – Nuclear Simple Sequence Repeats P - Phosphorus
PC - Principal Coordinates
PCA - Principal Component Analysis PCoA - Principal Coordinate Analysis PCR – Polimerase Chain Reaction PIC - Polymorphic Index Content pmoles - Picomoles
PNA-Alvão Natural Park
PNDI- Douro International Natural Park; PNPG- Peneda-Gerês National Park; PUFA - Polyunsaturated Fatty Acids r – Correlation
RDA – Recommended Dietary Allowance
RFLP - Restriction Fragment Length Polymorphism Rp - Resolving power
s - Second
SCAR - Sequence Characterized Amplified Region Se - Selenium
SI - Self-incompatibility SLG - S-locus glycoprotein
SMRT - Single-Molecule Real-Time SNP – Single Nucleotide Polymorphism SRK - S receptor kinase gene
SSI - Sporophytic Self-Incompatibility SSRs – Simple Sequence Repeats
Stage Ff2 - Female flowering at stages (peak) Stage Fm1 – Male flowering at stages Fm1 (start) TAE - Tris-Acetate-EDTA
TAG – Triacylglycerol TBE - Tris-Borate –EDTA
UBC - University of British of Columbia UFA – Unsatureted Fatty Acids
UK – United Kingdom
USA – United States of America
UTAD - Universidade de Trás-os-Montes e Alto Douro W - West
Zn - Zinc
μL - Microliter μM - Micromolar
Fagales. This species is native from Europe and Eastern Asia, and is cultivated for more than 5,000 years. During the last centuries, most of the cultivars were selected from local wild populations. Hazelnut is found at north and center of Portugal. Since the 90s, the production of hazelnut has declined, and could allow the lost of landraces.The evaluation of genetic diversity in wild genotypes and local populations is highly important for the use and management of the existent collections.
With the aim of evaluating the genetic diversity and understanding the phylogenetic relationships among the Portuguese hazelnut landraces and reference cultivars, it were studied 58 genotypes, including landraces, wild genotypes and reference cultivars, at the morphological, molecular and biochemical levels.
In Chapter 1 is presented a review of the origin and domestication of hazelnut, molecular markers, self-incompatibility alleles (S-alleles) and nutritional composition of the fruit.
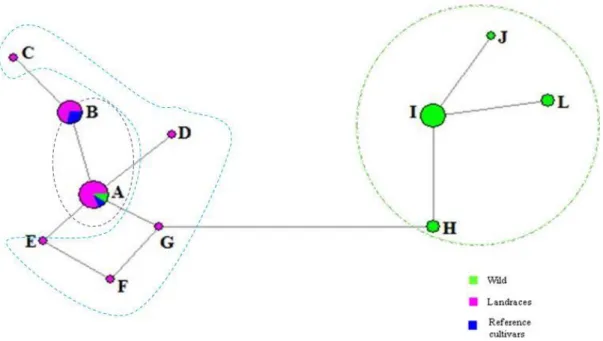
The evaluation of genetic diversity at the cloroplastidial DNA (cpDNA) level by microsatellites (cpSSRs), is presented in Chapter 2. Four out of ten studied loci were polymorphic. In total, 11 haplotypes were detected, and haplotype A was the most frequent in both landraces and reference cultivars. In the wild genotypes were found four exclusive haplotypes (H, I, J and L). This diversity could indicate the North of Portugal as a potential refugium during the last glacial period.
The genetic diversity and the phylogenetic relationships, evaluated by inter-simple sequence repeat (ISSR) and amplified fragment length polymorphism (AFLP) markers are presented in Chapter 3. A total of 570 markers was obtained, and 541 (95.03%) revealed to be polymorphic. The similarity indexes ranged from 0.239 for reference cultivars versus wild genotypes, and 0.143 for landraces versus wild genotypes. The phylogenetic relationships distributed the hazelnuts into three groups, showing a clear separation among wild genotypes, landraces and reference cultivars.
In Chapter 4 were presented the results achieved with the nuclear microsatellite (SSR) markers for the evaluation of the phylogenetic relationships. The level of polymorphism was high as verified by the mean values of expected heterozygosity (0.74),
cultivars. These results reinforce the hypothesis that wild genotypes constitute a hotspot of diversity and provided us clues about the origin of some landraces.
The results about the identification of S-alleles are presented in Chapter 5. In this study were used hazelnut landraces that were pollinated in the field with pollens from genotypes with known S-alleles. Three landraces revealed to have the S2 allele, two presented the S5 allele, and four showed one of following alleles S3, S5, S10, or S18. One landrace was compatible with the 17 S-alleles tested, and in two landraces was possible to identify two alleles, S5 and S9.
The phenotypic variability and nutritional composition of the fruits are presented in Chapter 6. The landraces showed the highest average for the nut and kernel weight and oil content, while the reference cultivars presented the lowest mean values. The wild genotypes presented the highest amount of protein, and the lowest values in essential amino acids. The reference cultivars demonstrated the highest mean values for essential amino acids and for the minerals phosphorus and iron. The highest average values of potassium, calcium and boron were found in the landraces, whereas the wild genotypes presented the highest averages in magnesium, zinc, manganese, and sodium. An analysis based on the principal components and a dendrogram allowed the identification of the most interesting genotypes (eight landraces) concerning the morphological traits and the nutritional composition.
In Chapter 7 are presented the general conclusions and future perspectives.
The results obtained in this work, could contribute for the definition of the best pollinators for the planning of new orchards and development of new cultivars. The genetic diversity found on wild genotypes and landraces may provide relevant information for the conservation of the genetic diversity that still remains. The high oil content and the reduced amount of linoleic acid could allow the selection of progenitors for breeding programs with the goal of increasing the kernel oil stability and the nutritional value of the fruits.
Keywords: Corylus avellana L., genetic diversity, landraces, nutritional composition, S-alleles, wild genotypes
Fagales. Esta espécie é originária da Europa e Ásia Ocidental e é cultivada há mais de 5000 anos. Ao longo dos últimos séculos, a maioria das variedades cultivadas foram selecionadas a partir de populações silvestres. Em Portugal, a aveleira encontra-se na região norte e centro. Desde a década de 90 que a sua produção está em declínio,
podendo conduzir ao desaparecimento das variedades locais (“landraces”). A avaliação
da diversidade genética de espécies silvestres e populações locais revela-se de grande importância para a sua utilização e para a gestão das coleções existentes.
Com o objetivo de avaliar a diversidade genética e conhecer as relações filogenéticas das aveleiras portuguesas e variedades comerciais, procedeu-se ao estudo de 58 genótipos, incluindo variedades locais, silvestres e comerciais, ao nível morfológico, molecular e bioquímico.
No Capítulo 1 apresenta-se uma revisão bibliográfica sobre a origem e a domesticação da aveleira, os marcadores moleculares, os alelos de incompatibilidade (alelos S) e a composição nutricional dos frutos.
A avaliação da diversidade genética ao nível do DNA cloroplastidial (cpDNA) através de microssatélites (cpSSR), encontra-se no Capítulo 2. Quatro dos dez loci estudados revelaram-se polimórficos. Encontraram-se, no total, onze haplótipos, sendo o haplótipo A o mais frequente, quer nas variedades locais quer nas comerciais. Nos genótipos silvestres detetaram-se quatro haplótipos exclusivos (H, I, J e L). Esta diversidade pode indicar o norte de Portugal como um potencial refúgio durante o último período glaciar.
A diversidade genética e as relações filogenéticas, avaliadas através de marcadores inter-microssatélites (ISSRs) e Polimorfismo de Comprimento de Fragmentos Amplificados (AFLPs), apresentam-se no Capítulo 3. Foram obtidos um total de 570 marcadores, dos quais 541 (95,03%) se revelaram polimórficos. Os valores dos índices de similaridade variaram entre 0,239 para as variedades comerciais versus genótipos silvestres, e 0,143 para as variedades locais versus genótipos silvestres. As relações filogenéticas distribuíram as aveleiras por três grupos, mostrando uma clara separação dos genótipos silvestres das variedades locais e comerciais.
encontrado foi elevado, conforme o indicado pela heterozigocidade média esperada (0,74), pela heterozigocidade média observada (0,71) e pelo conteúdo de informação de polimorfismo (0,78). O dendrograma mostrou uma clara separação dos genótipos silvestres, variedades locais e variedades comerciais. Os resultados reforçam a hipótese de que os genótipos silvestres constituem um ‘hotspot’ de diversidade e fornecem pistas sobre a origem de algumas variedades locais.
Os resultados obtidos para a identificação dos alelos S encontram-se no Capítulo 5. Para este estudo foram utilizadas variedades locais de aveleira que foram polinizadas no campo, com pólen de genótipos cujos alelos S são conhecidos. Três variedades locais revelaram ter o alelo S2, duas apresentaram o alelo S5, e quatro, um dos quatro alelos S3,
S5, S10, S18. Uma variedade local foi compatível com todos os 17 alelos S testados, e em
duas foi possível identificar dois alelos, S5 e S9.
A variabilidade fenotípica e a composição nutricional dos frutos apresentam-se no Capítulo 6. Nas variedades locais observou-se o valor médio mais elevado para o peso do fruto, peso do miolo e teor em óleo, tendo as variedades comerciais apresentado os valores médios mais baixos. Os genótipos silvestres revelaram o teor médio mais alto em proteína e os valores médios mais baixos para o teor em aminoácidos essenciais. As variedades comerciais demonstraram os valores médios mais elevados para o teor em aminoácidos essenciais e para os minerais fósforo e ferro. Os valores médios mais altos de potássio, cálcio e boro foram encontrados nas variedades locais, enquanto os genótipos silvestres apresentaram as médias mais elevados em magnésio, zinco, manganésio e sódio. Uma análise baseada em componentes principais e outra hierarquizada permitiram identificar os genótipos mais interessantes (oito variedades locais) relativamente aos caracteres morfológicos e à composição nutricional.
No Capítulo 7 apresentam-se as conclusões gerais e as perspetivas futuras
Os resultados obtidos neste trabalho podem contribuir para a definição dos melhores polinizadores para o planeamento de novos pomares e desenvolvimento de novas variedades. A diversidade genética encontrada nos genótipos silvestres e nas variedades locais pode fornecer informações relevantes para a conservação da diversidade genética ainda existente. O elevado teor em óleo e o reduzido teor em ácido
Palavras-chave: Alelos S, composição nutricional, Corylus avellana, diversidade genética, genótipos silvestres, variedades locais.
General Introduction and objectives
Chapter 2
Chloroplast SSR genetic diversity indicates a refuge for Corylus avellana in northern Portugal
2.1 Abstract --- 41 2.2 Introduction --- 41
1.5 Molecular markers --- 16
1.5.1 Low-throughput, hybridization-based markers --- 17 1.5.1.1 Restriction Fragment Length Polymorphisms (RFLPs) --- 17 1.5.2 Medium-throughput, PCR-based markers --- 18 1.5.2.1 Random Amplified Polymorphic DNA (RAPD) --- 18 1.5.2.2 Amplified Fragment Length Polymorphism (AFLP) --- 18 1.5.2.3 Microsatellite (SSR) --- 19 1.5.3 High-throughput (HTP) sequence-based markers --- 20 1.5.3.1 Single nucleotide polymorphism (SNPs) --- 20 1.5.3.2 Insertion-deletions (InDels) --- 21 1.5.4 DNA sequencing --- 22 1.6 Objectives --- 24 1.7 References --- 25 1.1 Introduction --- 3 1.1.1 Origin and domestication of the common hazelnut (Corylus avellana) -- 3 1.1.2 Biology of Corylus avellana --- 3
1.2 Genetic resources --- 6 1.2.1 Conservation of genetic resources --- 7 1.3 International and National Production and Economic Importance --- 9 1.4 Fruit Nutrient and Non-Nutrient Composition and Health Benefits --- 12
1.4.1 Fatty Acids --- 14
1.4.2 Protein and Amino Acids --- 14
2.5 Discussion --- 48 2.6 References --- 51
Chapter 3
Genetic relationship among wild, landraces and reference cultivars of hazelnut (Corylus avellana) from Portugal revealed through ISSR and AFLP markers
3.1 Abstract --- 57 3.2 Introduction --- 57 3.3 Material and methods --- 59
3.4 Results --- 65 3.4.1 AFLP --- 65 3.4.2 ISSR --- 65 3.4.3 AFLP and ISSR combined data --- 66 3.5 Discussion --- 71 3.6 References --- 76
Chapter 4
Western European wild and landraces hazelnuts evaluated by SSR markers
4.4 Results --- 89 3.3.1 Plant material --- 59 3.3.2 DNA isolation --- 61 3.3.3 AFLP analysis --- 61 3.3.4 ISSR analysis --- 62 3.3.5 Data analysis --- 62 4.1 Abstract --- 83 4.2 Introduction --- 83 4.3 Material and methods --- 85
4.3.1 Plant material --- 85 4.3.2 DNA isolation --- 87 4.3.3 SSR analysis --- 88 4.3.4 Data analysis --- 88
Chapter 5
Incompatibility alleles in Portuguese hazelnut landraces
5.1 Abstract --- 105 5.2 Introduction --- 105 5.3 Material and methods --- 106 5.4 Results --- 108 5.5 Discussion --- 111 5.6 References --- 114
Chapter 6
Variability in fruit morphology and fruit composition of landraces and wild hazelnuts (Corylus avellana L.)
6.1 Abstract --- 119 6.2 Introduction --- 119 6.3 Material and methods --- 121 6.3.1 Plant material --- 121 6.3.2 Morphological descriptors --- 121 6.3.3 Determination of amino acids, protein, minerals and oil content --- 122 6.3.4 Statistical analysis --- 123 6.4 Results and discussion --- 123 6.4.1 Morphological characterization --- 123 6.4.2 Protein, essential and non- essential amino acids --- 126 6.4.3 Minerals content --- 132 6.4.4 Oil content and fatty acid composition --- 134 6.4.5 Correlation among variables --- 137 6.4.6 Principal component analysis and cluster analysis --- 139 6.5 Conclusions --- 142 6.6 References --- 144
7.1 Concluding remarks --- 153 7.2 Perspectives for future --- 156
General Introduction and objectives
Table 1.3.1 Values of productions of hazelnut fruits in nine top producers --- 10 Table 1.3.2 Values of importation and exportation of hazelnut fruits in Portugal --- 11 Table 1.3.3 Values of importation and exportation value of hazelnut fruits of the five top producers --- 12
Table 1.4.1 Nutritional value of hazelnuts per 100 g --- 13
Chapter 2
Chloroplast SSR genetic diversity indicates a refuge for Corylus avellana in northern Portugal
Table 2.1 Chlorotypes and origins of Corylus avellana genotypes studied --- 44
Table 2.2 Eleven chlorotypes based on four polymorphic cpSSR lociz. Allele sizes are in
base pairs as determined by capillary electrophoresis --- 46
Table 2.3 Chlorotype number and frequency in 32 Portuguese Corylus avellana genotypes and three reference cultivars --- 48
Chapter 3
Genetic relationship among wild, landraces and reference cultivars of hazelnut (Corylus avellana) from Portugal revealed through ISSR and AFLP markers
Table 3.1 List of Corylus avellana accessions used in this study --- 59 Table 3.2 ISSR and AFLP primers sequences --- 64
Table 3.4 Genetic variation among Portuguese landraces, wild and Reference cultivars of hazelnuts --- 66 Table 3.3 Number of bands, percentage of polymorphic bands, polymorphism information content (PIC), resolving power (Rp), effective multiple ratio (EMR) and marker index (MI) of ISSR, AFLP and ISSR+AFLP markers used to fingerprint 58 hazelnut --- 66
Table 3.6 Pairwise values for Fstof hazelnuts groups studied --- 70 Table 3.7 Population differentiation analysis --- 70
Chapter 4
Western European wild and landraces hazelnuts evaluated by SSR markers
Table 4.1 List of Corylus avellana accessions used in this study --- 85 Table 4.2 Characterization of 16 simple sequence repeat (SSR) loci based on 58 hazelnut accessions --- 91
Chapter 5
Incompatibility alleles in Portuguese hazelnut landraces
Table 5.3 Results of pollinating ten Portuguese hazelnut landraces with testers --- 109 Table 5.4 Summary of compatibility of female inflorescences of ten Portuguese hazelnut
landraces with 18 pollen testers --- 110
Chapter 6
Variability in fruit morphology and nutritional composition among hazelnut (Corylus avellana L.) landraces and wild genotypes
Table 6.1 List of Corylus avellana accessions used in this study --- 122 Table 6.2 Physical parameters of the fruits of landraces, wild genotypes and reference cultivars --- 125
Table 4.3 Pairwise values for FSTfor three hazelnut groups --- 93
Table 5.2 Pollen testers (18) used to identify S-alleles in Portuguese hazelnut landraces Alleles expressed in the pollen are underlined --- 108 Table 5.1 Origin of the Portuguese hazelnut landraces studied --- 107
Table 6.4 Non-essential amino acid composition of landraces, wild genotypes and reference cultivars --- 131
Table 6.5 Mineral composition of landraces, wild genotypes and reference cultivars - 133 Table 6.6 Total fat content and fatty acid composition of landraces, wild genotypes and reference cultivars --- 135
Table 6.7 Correlation between the nine traits in the kernel of 28 hazelnuts studied --- 138 Table 6.8 Eigenvalues proportion of total variability and correlations among the variables and the first 3 principal components (PCs) --- 140
Chapter 2
Chloroplast SSR genetic diversity indicates a refuge for Corylus avellana in northern Portugal
Figure 2.1 Map of northern Portugal showing sampling sites --- 43 Figure 2.2 Haplotype median network representing all haplotypes (A, B, C, D, E, F, G, H, I, J and L) identified in hazelnut. Circle areas are proportional to haplotype frequencies obtained in all 35 samples analyzed. The haplotypes that lie within the dashed circle are exclusive of wild genotypes --- 47
Chapter 3
Genetic relationship among wild, landraces and reference cultivars of hazelnut (Corylus avellana) from Portugal revealed through ISSR and AFLP markers
Figure 3.1 NJ cluster analysis of hazelnut genotypes based on the Jacard distance using 25 primers for ISSRs +AFLPs --- 67
Figure 3.2 Principal coordinates analysis of 58 unique hazelnut genotypes shown by groups for the AFLPs+ISSRs --- 68
Figure 3.4 Assignment of 58 Corylus genotypes to 3 groups by Structure for AFLP+ ISSR system. Each individual bar represents an accession. Numbers 1-19 = Landraces, 20-32 = Wild and 33- 58 = Reference cultivars --- 71 General Introduction and objectives
Figure 1.3.1 Hazelnut fruit production in Portugal (2004-2014) --- 11
Figure 3.3 Relationship between ISSR and AFLP+ISSR data sets for the genetic distances --- 69
Figure 4.1 Map of northern Portugal showing sampling sites --- 87 Figure 4.2 NJ cluster analysis of hazelnut accessions based on the proportion of shared allele distance for 16 dinucleotide containing SSRs --- 92
Figure 4.3 Principal coordinates analysis of 58 unique hazelnut accessions shown by groups --- 93
Figure 4.4 Hierarchical organization of genetic relatedness of 58 hazelnut genotypes based on 16 SSR markers and analyzed by the STRUCTURE program, with three, four, and five populations (K=3, K=4, and K =5 --- 94
Chapter 5
Incompatibility alleles in Portuguese hazelnut landraces
Figure 5.1 Compatible cross Ca5 x Butler (S3) --- 111
Chapter 6
Variability in fruit morphology and nutritional composition among hazelnut (Corylus avellana L.) landraces and wild genotypes
Figure 6.1 Scatter plot for the first two principal components (PCs) for 23 Portuguese hazelnuts genotypes and five reference cultivars studied --- 141
Figure 6.2 Hierarchical analysis derived from Euclidean distances of similarity showing the relationship among the 28 hazelnuts --- 141
1. Introduction
The Corylus L. genus contains a wide diversity of deciduous shrub and tree species that are important components of many temperate forests across the Northern Hemisphere. At present it is characterized by an enormous area of distribution. In Europe it extends from Portugal, Ireland and Orkney Island to the southern part of the Ural mountains and from Norway to Sicily and Greece, being particularly abundant throughout the Balkan countries. In Asia it is found from Turkey through Caucasia to Iran in the east and from Anatolia to Syria and Lebanon in the south. The European hazelnut (Corylus avellana L.), is the most widely known and well-studied member of the Corylus genus and is also an economically valuable commercial tree nut crop, ranking fifth in world production behind cashew (Anacardium
occidentale L.), almond [Prunus dulcis (Miller) D.A. Webb], walnut (Juglans regia L.), and
chestnut (Castanea spp.) (FAOSTAT, 2013). The hazelnut has a long history intertwined with human civilization. Ancient Chinese and Greek manuscripts described the uses of this nut (Hummer, 1995). In China, the hazelnut was considered one of the five sacred nourishments, endowing temple priests with powers of clairvoyance. In the first century A.D., Dioscorides, the Greek physician noted the use of hazel in remedies to cure the common cold as well as baldness and Virgil wrote that the hazel was more honored than vine myrtle or bay. In Roman and Celtic cultures, hazelnut has been attributed with mystical powers, symbolizing fruitfulness in marriage, providing protection against lightning, and divining the hidden location of treasures, veins of metals and water (Hummer, 1995).
1.1. Origin and domestication of the Corylus avellana
European hazelnut (Corylus avellana) is native to most of Europe, Asian part of Turkey, the Caucasus mountains and western Asia. It was one of the first species to colonize Europe after the last ice age, with pollen records and chloroplast DNA variation studies suggesting expansion from refugia in southwestern France into most of Europe, except for southern Italy and the Balkans, where expansion was from local populations (Palme and Vendramin 2002; Boccacci and Botta 2009). During the last glacial maximum most of Europe had a climate that was unsuitable for hazel but low levels of pollen have been found in central Europe as early as 17 500 ka BP and in southern Sweden as early as 13 500 ka BP. These data suggest that hazel was locally present in central Europe during the full glacial period and also, just after the ice retreated, in southern Scandinavia, although this is still debated. The present day distribution of C. avellana was established about 7000 BP as a result of postglacial
recolonization that had started ~11,000 years earlier (Huntley and Birks, 1983). Between 10,000 and 9000 BP there was a sharp increase in the amount of Corylus pollen found across Europe (Huntley and Birks, 1983). Nut dispersal during the postglacial recolonization was caused by small mammals, birds, and human migration. Archaeologists have repeatedly found nuts, kernels and shell remains from many archaeological sites all over Europe. Hazelnuts were been used as food since prehistoric days and has been cultivated at least since Roman times (Vaughn & Geissler 1997). During this period, artificial selection to improve the yield will certainly have taken place, maybe using hybridization with other species, hence creating gene flow between the cultivated and wild Corylus. Humans might also historically have influenced the natural distribution of hazelnut by artificial transfer of the nuts. Palmé and Vendramin (2002) based in chloroplast haplotypes found a clear geographical structure that divides Europe into two parts: northern and western Europe and Italy and the Balkan area. This structure seems to be associated mainly with the migration history of this species and indicates that hazelnut colonized most of Europe from western refugia. The two other putative refugia did not contribute significantly to the recolonization processes of Europe, and these populations remained trapped in the Italian and Balkan peninsulas (Palmé and Vendramin, 2002). More recently, Boccacci and Botta (2009, 2010); Gökirmak et al. (2009) and Gürcan et al. (2010a) have suggested that C. avellana seems to have been domesticated independently in six different areas: British Islands, central Europe, Spain, Italy, Black Sea, and Iran. Martins et al. (2013) based on chloroplast data and in combination with fossil pollen data found in Gerês mountains (Ramil et al., 1995) and in Douro estuary (Naughton, 2002), suggest that Northern Portugal was a refuge during the last ice age. Although, where and when the domestication of C. avellana was started is not yet clear.
1.1.1. Biology of Corylus avellana
Hazelnut is a member of the Betulaceae family, belongs to the order Fagales and to
Corylus genus. Corylus avellana are multi-stemmed shrubs 3–10 m tall, with a growth habit
ranging from very erect to drooping. Ornamental forms also exist that have weeping or contorted branches. Plants spread by suckers, but the rate and number of suckers produced from the base of the plant varies considerably. Shoots are glandular pubescent and vary in their thickness and branching density. Leaves range from 5–10 cm in length and are elliptic to ovate to rounded in shape, slightly cordate at the base, and have doubly serrate margins. Nuts develop in clusters of 1–12, each separately enclosed in an involucre made up of two
overlapping, leafy bracts that vary considerably across the species in terms of the length, constriction around the nut, indentation and serration at the apex, and thickness at the base. Nuts of cultivated forms, which may or may not be released from the involucre at maturity, are by far the largest of the genus, although they vary tremendously in size, shape (from oblate to long and tapered), shell thickness, and percent kernel (ratio of kernel to shell by weight) (Smolyaninova, 1936; Kasapligil, 1972; Deacon, 1974; Mehlenbacher, 1991; Thompson et al., 1996).
The floral biology of hazelnut is distinct from other orchard crops. The plants are diploid (2n = 2x = 22), monoecious, wind-pollinated and bloom in midwinter, from December to March in the Northern hemisphere. Staminate flowers are borne in catkins at nodes on one-year wood. Pistilate clusters are borne on one-one-year wood, on catkin peduncles or on very short spurs from older wood. At anthesis several stigmatic styles emerge and can remain receptive for up to three months. If the exposed parts of the styles are damaged by frost, the lower parts subsequently emerge as functional tissues. Pollen tubes grow to the base of the styles and rest for five months. The ovary becomes mature in the spring. Fertilization occurs when the nut is about one-half of the mature size (Thompson, 1996). Compatible pollination is essential for the development of the ovary or nut shell. Most cultivars are dichogamous, but some overlapping of staminate and pistillage anthesis occurs. Incompatibility in hazelnut is of sporophytic type and under the control of a single locus with multiple alleles (Thompson, 1979a). The stigmatic surface is the site of the incompatibility reaction and pollen tube growth is arrested in the stigmatic surface (Mehlenbacher and Thompson, 1988; Hampson et al., 1993). In sporophytic incompatibility system, the pollen exine carries two S-alleles determined by plant which produced the pollen (Me et al., 2000).Thus, each pollen grain in plants with sporophytic self-incompatibility presents the products of two S-alleles, and rejection occurs when either one of these alleles matches either of the S-alleles expressed in the pistil (Matton et al., 1994). To date, in hazelnut 33 S-alleles have been identified (Thompson, 1979; Mehlenbacher and Thompson, 1988; Mehlenbacher, 1997; Mehlenbacher, 2014). All are codominant in the pistil, although they may show co-dominance or dominance in the pollen (Mehlenbacher and Thompson, 1988).
1.2. Genetic resources
The loss of genetic resources can reduce the genetic diversity, which is potentially catastrophic since genetic diversity is widely recognized as a key requirement for the
long-term survival of species on an evolutionary time-scale. Genetic diversity provides the template for adaptation, evolution and survival of populations and species, especially in environments that are subject to climate change or to introduction of new pests, pathogens or competitors (Rajora and Mosseler 2001). The expression crop genetic resources, usually refers to the total sum of genes, gene combinations, or genotypes available for the genetic improvement of crop plants. Following the proposal of Harlan and de Wet (1971), plant genetic resources were classified in three gene pools that reflected the increasing difficulty in performing sexual crosses and obtaining viable and fertile progenies. Gene Pool I includes the crop species itself and its wild progenitor. Crosses within Gene Pool I can generally be easily made and the resulting progeny is viable and fertile. This gene pool corresponds to the biological species concept. Gene pools II and III include other species that are related, yet different from the crop species of interest. Crosses between Gene Pool I and II are possible but are usually more difficult to achieve (Gepts, 2000). The progeny shows reduced viability and fertility. Crosses between Gene Pools I and III are the most difficult. Special techniques such as tissue culture have to be used to obtain a progeny from these crosses. The progeny often shows a severe reduction in viability and fertility. The operational definition of Harlan and de Wet (1971) has been very useful because it reflects the realities of the breeding process, particularly the introduction of new genetic diversity into the populations of a breeding program by sexual hybridizations. Nevertheless, one could argue that this definition may need to be expanded to a Gene Pool IV based on advances in scientific technology and increased awareness of the benefits of biodiversity in general (Gepts, 2000). Comparative genomics now plays an important role in the discovery of genetic diversity by facilitating the identification of genes that are responsible for important agronomic traits through the determination of macrocolinearity (by comparative mapping) and microcolinearity (sequence comparison). Thus, comparative genomics can lead to the identification of candidate genes within the species of interest or other species (Gepts, 2000). In turn, this information can lead to a better understanding of the genetic basis of the trait of interest and a more direct selection for this trait. For the foreseeable future, the main sources of genetic diversity for plant breeding, therefore, remain the three gene pools as defined by Harlan and de Wet (1971). Agricultural production increases are attributed generally in equal proportions to genetic improvement (development of elite cultivars) and improved cultural practices (e.g., fertilization, pesticide application, planting time and density, and irrigation) (Fehr, 1984). Genetic diversity is the raw material that spurs genetic improvement, both to increase yield
potential per se (i.e., production per unit area) and to decrease reliance on production inputs. Crop genetic diversity provides an assurance of future genetic progress and an insurance against unforeseen threats to agricultural production such as disease epidemics or climate changes. Thus, the fate of genetic diversity in these gene pools is of utmost importance if plant breeding will continue to address pressing needs of society such as increased yield, genetic resistance to diseases and pests, improved nutritional and processing quality of crop products, and reduction in environmental effects (Gepts, 2000).
1.2.1. Conservation of genetic resources
As agriculture is becoming more and more intensified and location specific, crop improvement objectives are also becoming more and more complex. To meet these objectives, it is necessary to conserve available genetic variability and further collect, augment and enhance it. The conservation of genetic resources is to be viewed particularly in the face of their genetic erosion and eventual wipe-out. On one side, with the modernization in agriculture, the expansion of a relatively small number of improved cultivars to large tracts of land leads to the elimination of vast diversity in primitive landraces of different crop plants. On the other hand, the development in all spheres of life is leading to acute scarcity of land and water. These factors are forcing changes in the land use and agriculture practices, resulting in disappearance of habitats, which harbour wild progenitors and weedy forms of our basic food plants. This emphasizes the importance of conservation and use of germplasm diversity for desired sustainable agriculture in the world (Malik and Singh, 2006). The main reasons for conserving plant genetic resources are to ensure the future adaptability of cultivars and wild populations; to preserve data and traits that ensure sustainable agriculture; to promote the use of genetic resources in commerce and biotechnology; to conserve genetic diversity for cultural reasons. Conservation of genetic resources can be carried out in two forms, namely in situ and ex situ. In situ conservation is defined as conservation of ecosystems and natural habitats, the maintenance of viable populations of the species in their natural surroundings and, in the case of the cultivated species, in the surroundings where they have developed their distinctive properties. In situ conservation can be done in farmers’ fields, in pasture lands, and in protected areas (IBC-FAO, 2007). For cultivated species, in
situ conservation concerns the maintenance of the local intra- and inter-population diversity
available in various ecological and geographical sites (Kjaer et al., 2001; Borokini et al., 2010). Thus, it allows ongoing host-parasite co-evolution, which is likely to provide material
resistance to pests and diseases, and conservation of biological diversity (CBD) recognized it as a primary approach to conserve biodiversity (IBC, 2005). However, in situ conservation has certain limitations like more difficult access to breeders requiring the application of its complimentary technique. For example, some of the natural habitats or wild habitats are very risky when compared to relatively safe captive environment (Leus, 2011). Ex situ conservation entails conservation of biological diversity components outside their natural
habitats. The main storage infrastructures for such conservation techniques are: botanical gardens and gene banks. Botanical gardens consist of living plants, grown outdoors or under glass in greenhouses and conservatories. It can be taxonomic collection of a particular family, genus or group of cultivars, native plants, wild relatives, medicinal, aromatic, or textile plants (IBC, 2005). There are over 2,000 botanic gardens, holding 80,000 plant species in their living collection (Blackmore et al., 2011; Brutting et al., 2013). Botanical gardens give opportunity for arable plants to be grown under relatively modified environmental conditions (intense cultivation, relatively high fertility, and high levels of disturbance) (Brutting et al., 2013). Genome resource banking is another management technique used for biodiversity conservation. Different types of gene banks have been established for the storage of biodiversity, depending on the type of materials conserved. These include seed banks (for seeds), field gene banks (for live plants), in vitro gene banks (for plant tissues and cells), pollen, chromosome, and deoxyribonucleic acid (DNA) banks (living sperm, eggs, embryos, tissues, chromosomes, and DNA) that are held in short term or long term laboratory storage; usually cryopreserved or freeze-dried (Clark, 2009). Seeds are usually the most convenient and easiest material to collect and to maintain in a viable state for long periods of time and that makes it preferred for conservation in gene banks (Vertuccj, 1993; Brutting et al., 2013). Seed banking techniques rely on the storage of dried seeds of threatened or other plants at low temperatures as the most important factors influencing seed longevity are temperature, seed moisture content, and relative humidity (Ellis and Roberts, 1980; Dickie et al., 1990; Brutting et al., 2013). Seeds are typically conserved at moisture content between 3 and 7 percent and stored at 4 degrees Celsius for short-term conservation, and between −18 and −20 degrees Celsius for long-term conservation (Vertuccj, 1993; Dulloo et al., 2010). Plants that cannot be conserved as seeds because of their recalcitrant nature (i.e. seeds that are desiccation and/or cold sensitive) or are clonally propagated are traditionally conserved as live plants in ex situ field gene banks. In vitro conservation refers to one type of gene bank known as slow-growth conservation method. It involves culturing of different parts of the plant (meristem, tissues,
and cells) into pathogen-free sterile culture in a synthetic medium with growth retardants, which has been cited as a good way of complementing and providing backup to field collections (Dulloo et al., 2010). The other genome conservation technique is cryopreservation, in which living tissues are conserved at very low temperatures (−196°C) in liquid nitrogen to arrest mitotic and metabolic activities (Dulloo et al., 2010). It is now realized that cryopreservation method can offer greater security for long-term, cost effective conservation of plant genetic resources, including orthodox seeds (Dulloo et al., 2010). The storage in liquid nitrogen clearly prolonged shelf life of lettuce seeds with half-lives projected as 500 and 3400 years for fresh lettuce seeds stored in the vapor and liquid phases of liquid nitrogen, respectively (Dulloo et al., 2010).
1.3. International and National Production and Economic Importance
The world's largest producer of hazelnuts is Turkey, which typically produces more than 70% of the world hazelnut production, (549,000 tons in 2013). Turkey is followed by Italy, which produces around 10-15% (112,643 tons) of the total world hazelnut production, and the US, which produces < 5% (40,500 tons). Georgia, Azerbaijan, China, Iran, Spain, and France are also significant producers of hazelnuts (FAOSTAT 2013) (Table 1.3.1).
Table 1.3.1 Values of productions of hazelnut fruits in top ten producing countries (FAOSTAT, 2013)
World Producers (2013)
Turkey Italy USA Georgia Azerbeijan China Iran Spain France Poland
Prodution (Tons) 549 000 112 643 40 500 39 700 31 202 23 000 21 537 15 300 7 619 5 132 Area (Ha) 422 501 71 484 11 120 16 000 24 882 11 500 25 246 13 800 4 528 4 006 Yield (Hg/Ha) 12 994 15 758 36 421 24 813 12 570 20 000 8 531 11 087 16 826 12 811
The Portuguese production has little meaning in the global or European context, since the production does not exceed 1000 tons. In the national context, the importance of culture is modest when compared to other nuts, like almond, walnut and chestnut. In Portugal, hazelnut is a culture that has been suffering a gradual abandonment. There are several factors
contributing to this situation: the low prices paid to production, high dispersion of orchards, poor use of implantation techniques and cultivation, lack of skilled labor, the low level mechanization and lack of organization of the sector. For these reasons, the hazelnut production was declined in the period between 2000 (660 tons) and 2012 to half of the production. However, in the last few years (2013 and 2014) it seems that the production of hazelnuts began to increase. According to the data published by the INE (2015) the production of hazelnut fruit in Portugal decreased from 2004 to 2005, but in 2006 has showed a slightly increased of production. The following three years period (2007-2009) there was a decrease in production. In the years 2010 and 2011 there was a reversal of the situation and again a slight increase in production has occurred. In 2012 the production decreased, however in the last few years (2013 and 2014) it has been noted an increased in production (Figure 1.3.1).
Figure 1.3.1 Hazelnut fruit production in Portugal (2004-2014) (Source: FAOSTAT, 2013)
The level of exportations between 2004 and 2014, reached the highest level in 2014 with 41 tons. Our major buyer of hazelnuts in the last five years was Angola with 23.8 ton, followed by Mozambique and France. Comparing with other nuts the major importers for almond are Spain (3 909 ton) and Brazil (104 ton), for walnut are Spain (91 ton) and Angola (72 ton), and for chestnut are France (4 694 ton), Italy (4 451 ton) and Spain (2 288 ton) (Yearbook of Agriculture, Market Information, 2013). Regarding importations, in the last five years we have imported a mean value of 279.9 tons of hazelnuts per year. The year 2013 was
the one that showed a higher value of importation with 261 ton and a lower value was reached in 2011 with 197.7 tons (Table 1.3.2)
Table 1.3.2. Values of importation and exportation of hazelnut fruits in Portugal (INE, 2015)
The mean values of exportations and importations of the last five years, for the top five hazelnut world producers are presented in table 1.3.3. The world major exporter of hazelnut was Turkey with 144 151 tons, followed by Italy, Georgia and Azerbaijan (14 166 tons, 12 484 tons, 10 008 tons, respectively), concerning importation, Italy has showed the highest level of importation with 29 134 tons, followed by USA and Georgia (3 303 and 1 290 tons, respectively).
Table 1.3.3 Annual means of the period 2008-2012 of importation and exportation value of hazelnut fruits of the five top producers (FAOSTAT, 2013)
EXPORTATION / IMPORTATION(2008 – 2012)
Turkey Italy Georgia Azerbaijan USA Portugal Exportation
(Tons) 144 151 14 166 12 484 10 008 1 420 17
Importation
(Tons) 1 224 29 134 1 290 152 3 303 201
1.4. Fruit Nutrient and Non-Nutrient Composition and Health Benefits
Hazelnuts are widely used in the food industry such as chocolate, confectionery and baking, ice-cream, dairy products and can be added to a wide array of dishes from cereals and breads, to yogurts, soups, salads, and from main dishes to confections (Fallico et al. 2003; Özkutlu et al. 2011). The nutritional and sensory properties of hazelnuts make them a unique
2010 2011 2012 2013 2014
Exportation
(Tons) 23.5 19.6 30.8 33.0 41.0
Importation
and ideal raw material for food products. In terms of nutrition and health, hazelnuts have a significant place, among the types of dried nuts, owing to their special composition of fats,
Table 1.4.1. Nutritional value of hazelnuts per 100 g
Principle Nutrient Value Percentage of RDA
Energy 628 Kcal 31% Carbohydrates 16.7 g 13% Protein 14.95g 26.50% Total Fat 60.75 g 202% Dietary Fiber 9.7 g 25.50% Vitamins Folates 113 µg 28% Niacin 1.8 mg 11% Pantothenic acid 0.918 mg 18% Pyridoxine 0.563 mg 43% Riboflavin 0.113 mg 9% Thiamin 0.643 mg 53.50% Vitamin A 20 IU <1% Vitamin C 6.3 mg 10.50% Vitamin E 15 mg 100% Vitamin K 14.2 µg 12% Electrolytes Sodium 0 mg 0% Potassium 680 mg 14% Minerals Calcium 114 mg 11% Copper 1.725 mg 192% Iron 4.7 mg 59% Magnesium 163 mg 41% Manganese 6.17 mg 268% Phosphorus 290 mg 41% Zinc 2.45 mg 22% Phyto-nutrients Carotene-α 3 µg --Carotene-ß 11 µg --Lutein-zeaxanthin 92 µg
minerals, protein, carbohydrates, vitamins, dietary fibers, and phenolic antioxidants (Table 1.4.1) (Özdemir et al. 2001; Alasalvar et al. 2006; Balta et al. 2006; Kornsteiner et al. 2006;Simsek and Aykut 2007; Cristofori et al. 2008; Güneş et al. 2010; Jakopic et al. 2011; Solar & Stampar 2011). Hazelnut oil decreases the cholesterol level in blood and also controls adverse effects of hypertension (Durak et al., 1999) and its composition in minerals are essential to maintaining a healthy nerve function and for keeping the body systems, bones, and cells healthy and well balanced (Açkurt et al. 1999; Özdemir et al. 2001; Köksal et al.
2006; Güneş et al. 2010; Özkutlu et al. 2011; Cosmulescu et al. 2013). Besides their rich
mineral content, hazelnuts are a valuable source of essential vitamins, such as vitamins B1, B6, niacin and tocopherol. There is growing, although inconclusive, evidence that α-tocopherol, the active form of vitamin E, helps to lower the risk of certain chronic diseases, such as heart disease (Iannuzzi et al., 2002), type 2 diabetes (Dhein et al., 2003), hypertension (Boshtam et al., 2002), and cancer (Venkateswaran et al., 2002) and that it may combat some of the negative effects associated with aging (Grodstein et al., 2003). α-Tocopherol may also be protective against cognitive decline and Alzheimer’s disease (Martin, 2003). In addition, hazelnuts are a good source of amino acids because they can provide ten amino acids that human cannot synthesize, and must be provided by the diet (Anderson et al., 1998). They are the precursors of secondary plant metabolites and are involved in the production of compounds which directly or indirectly affect human health (Gomes and Rosa, 2000).
1.4.1. Fatty Acids
Polyunsaturated fatty acids (PUFA) and mono-unsaturated fatty acids (MUFA) are present in higher levels in hazelnut fruits. MUFA and PUFA are known for prevention of cholesterol-based, their anticancer effects, atherosclerosis and their association with a decreased risk of development of cardiovascular diseases and neurological function disorders (Hardaman, 2002; Whelan and Rust, 2006). Hazelnuts present low levels of saturated fatty acids and high levels of unsaturated fatty acids and the major unsaturated fatty acids that can be found in fat/total lipids of are oleic (C18:1), linoleic (C18:2) and α-linolenic (C18:3), constituting more than 85% of the total fatty acid content (Amaral et al., 2006; Gunes et al., 2010 and Bacchetta et al., 2013). According to Whelan and Rust (2006) the omega-3 fatty acids cannot be synthesised by the human organism since humans are not able to denaturate the n-3 or n-6 bonds, so they are obtained exclusively from the diet. The same authors stated
from which all the n-3 fatty acids are derived. The major ALA dietary sources are soybean and canola oils as well as nuts (peanuts, hazelnuts, almonds, etc), seeds, vegetables and fruits (Nettleton, 1991). Hardaman (2002) emphasized the beneficial effects of omega-3 fatty acids for decreasing the risk of developing arteriosclerosis and breast, prostate and colon cancers. Omega-6 fatty acids are derived from linoleic acid and are found in leafy vegetables, seeds, nuts, grains, and vegetable oils (corn, safflower, soybean, cottonseed, sesame, sunflower) (Barnard, 1998).
1.4.2. Protein and Amino Acids
Proteins are an important part of a balanced diet and they participate in most of processes within cells (e.g. enzymes that catalyze biochemical reactions and are vital for various metabolic processes) and others have structural or mechanical functions, (e.g. the proteins in the cytoskeleton, that form a system of scaffolding that maintains cell shape). Proteins are also important in cell signalling, immune responses, cell adhesion, and the cell cycle. Humans and animals cannot synthesize all the amino acids necessary and they must obtain various essential amino acids from the diet. The amino acids present in the dietary proteins, are also of high importance and can be divided in two classes: essential amino acids (the ones that the human body does not synthesize and are obtained exclusively from the diet) and non-essential amino acids (synthesized by the human body in adequate concentrations). Total amino acids (including free and protein-derived) have been previously analyzed in hazelnuts fruits from various cultivars revealing that the predominant protein-derived amino acids are aspartic acid, alanine, arginine and glutamic acid (Köksal et al., 2006; Silva et al., 2007; Gunes et al., 2010). The non-protein amino acid, γ-aminobutyric acid (GABA), derived from the glutamic acid is an important inhibitory neurotransmitter of the central nervous system found mainly in the brain but also in the spinal cord, where about half of the inhibitory synapses use GABA (Tortora and Grabowski, 2000). Aspartic acid helps every cell in the body work and it plays an important role in hormone production and release. The alanine is a non-essential amino acid and is involved in sugar and acid metabolism, increases immunity, and provides energy for muscle tissue, brain, and the central nervous system (Chen et al., 2005a). Arginine is the amino acid that plays an important role in cell division, in the healing of wounds, to removing ammonia from the body, promote immune function and the release of hormones (Tapiero et al., 2002; Witte and Barbul, 2003; Stechmiller et al., 2005).
1.4.3. Minerals
Minerals are essential to maintaining a healthy nerve function and for keeping the body systems, bones and cells healthy and well balanced. Alasalvar et al. (2003) considered hazelnuts a excellent source of the minerals like potassium, phosphorus, calcium, magnesium, copper, manganese and selenium, and they seem to have a positive effect on human health (Cristofori et al., 2008; Oliveira et al., 2008; Schmitzer et al., 2011; Silva et al., 2007). Among the vast metabolic functions of minerals some can be highlighted, for example, calcium confers rigidity to the skeleton, playing an important role in signal transduction pathways, in contraction of all muscle cell types and also acting as an enzyme cofactor (Piste et al., 2013). The potassium is important for an healthy nervous system and normal heart rate (Demigne et al., 2004). The magnesium (30-40% present in muscles and soft tissues) is often a cofactor of enzymes involved in energy metabolism, protein synthesis, nucleic acids synthesis and maintains the electrical potential of nervous tissues and cell membranes (Rude, 2012). The essential mineral zinc is also performing an important role as part of the active site of over 300 enzymes that participate in the synthesis and degradation of carbohydrates, lipids, proteins, and nucleic acids, and it also playing an important role in polynucleotide transcription (genetic expression) and in the immune system (Hambidge et al. 1986). The iron functions, as an integrated part of enzyme systems and as component of haemoglobin in red blood cells, was the transporter of oxygen through the body (Abbaspour et al., 2014). The trace mineral boron appears to promote bone and joint health, particularly in women (Hunt 1997). It seems to affect the balance and absorption of calcium, magnesium and phosphorus, by the cell membranes and the way signals are transmitted across these membranes (McCoy et al., 1994). Hazelnuts and other nuts such as almond and walnut, leafy vegetables, fruits, raisins are recommended as good sources of Boron (Souci et al. 2000; Simsek et al. 2003).
1.5. Molecular markers
A molecular marker is defined as a particular segment of DNA that is representative of the differences at the genome level (Agarwal et al., 2008). They become the centre point of modern genetics to answer many important questions in population genetics, ecological genetics and evolution. A genetic marker is a gene or DNA sequence with a known location on a chromosome that can be used to identify cells, individuals, and species, or traits of interest. It can be described as an observable variation from mutation or alteration in the genomic loci. A genetic marker can be a short DNA sequence, such as a sequence
surrounding a single base-pair change (single nucleotide polymorphism, SNP), or a long one, like microsatellite or simple sequence repeats (SSRs). DNA markers are available in many forms. In addition to older types of markers, such as restriction fragment length polymorphism (RFLP), random amplified polymorphic DNA (RAPD), and amplified fragment length polymorphism (AFLP), combination of molecular markers, simple sequence repeats (SSRs),insertion-deletion polymorphisms (INDELs), PCR-based SNPs, and CAPS (cleaved amplified polymorphic sites) markers, are markers that can be used for many purposes including genotyping. DNA markers can be used to identify or verify a true identity of cultivars or breeding lines, the F1 hybrids, seed purity, or intra -varietal variation. The analyses are relatively simpler, easier, and more accurate than phenotypic evaluation. One of the major marker contributions is better understanding of genetic diversity, population structures, genetic relationship among subspecies, genetic relationship within specific germplasm collections, and family relationship among breeding lines and cultivars (Utomo et al., 2012). Molecular markers provide high quality genetic data that may not be possible to produce through other genetic methods. Evolution of molecular markers has been primarily driven by the throughput and cost of detection method and the level of reproducibility (Bernardo, 2008). Depending on detection method and throughput, all molecular markers can be divided into three major groups (Mammadov et al., 2012): low-throughput, hybridization-based markers such as restriction fragment length polymorphisms (RFLPs) (Botstein et al., 1980); medium-throughput, PCR-based markers that include random amplification of polymorphic DNA (RAPD) (Welsh and McClelland, 1990), amplified fragment length polymorphism (AFLP) (Vos et al.,1995), SSRs (Jacob et al., 1991); high-throughput (HTP) sequence-based markers such as SNPs (Wang et al 1997).
1.5.1. Low-throughput, hybridization-based markers
1.5.1.1. Restriction Fragment Length Polymorphism (RFLP)
Restriction Fragment Length Polymorphism (RFLP) is a technique that exploits variations in homologous DNA sequences. In RFLP analysis, DNA samples are cut by restriction enzyme(s) and the resulting fragments are separated according to their lengths by agarose gel electrophoresis. RFLP was first used in 1975 to identify DNA sequence polymorphisms for genetic mapping of a temperature-sensitive mutation of adeno-virus serotypes (Grodzicker et al., 1975). It was then used for human genome mapping (Botstein et al., 1980) and plant genomic research (Helentjaris et al., 1986; Weber and helentjaris., 1989).
RFLP analysis was the first DNA profiling technique and widely used in genome mapping and variation analysis, such as genetic fingerprinting (Ali et al., 1986; Becker et al., 1995), construction of genetic maps in rice (McCouch et al. 1988), maize (Helentjaris 1987), wheat (Chao et al 1989), soybean (Keim et al. 1990), tomato and potato (Tanksley et al. 1992), barley (Graner et al. 1991), chickpea (Simon and Muehlbauer 1997) and ruber tree (Lespinasse et al., 2000); identification of candidate gene locations in soyben (Lark et al., 1994), wheat (Amer et al., 1997) and potato (Zimnoch-Guzowska et al., 2000); hereditary disease diagnostics (Chartier-Hariln et al., 1994; Inoue et al., 1998) and paternity tests (Allen et al., 1989; Morling and Hansen, 1990). The foremost advantage of RFLP is that this technique is robust and readily transferable between laboratories. In comparison with other techniques for genotyping, RFLPs have a few disadvantages. These limitations include: requirement of high DNA quantity; it depends on the development of specific probe libraries for the species; the level of polymorphism is low, and few loci are detected per assay; involvement of radioactivity; very laborious and expensive overall lengthy procedure.
1.5.2. Medium-throughput, PCR-based markers 1.5.2.1. Random Amplified Polymorphic DNA
The randomly-amplified polymorphic DNA marker (RAPD) detects nucleotide sequence polymorphism in DNA by using a single primer of arbitrary nucleotide sequence (Oligonucleotide primer mostly ten bases long) (William et al, 1991). In this reaction, a single primer anneals to the genomic DNA at two different sites on complementary strands of DNA template. Advantages associated with RAPD analysis include: the use of small amount of DNA which makes it possible to work with population that is not accessible with RFLP; it is fast and efficient in analysis having high-density genetic mapping as in many plant species; non involvement with radioactive assays (Kiss et al, 1993); on – requirement of species specific probe libraries; non – involvement in blotting or hybridization. The limitations of RAPD markers are: its polymorphisms are inherited as dominant or recessive characters causing a loss of information relative to markers which show co-dominance; primers are relatively short, a mismatch of even a single nucleotide can often prevent the primer from annealing, hence leads to a loss of band; suffers from problems of reproducibility in many systems, especially when transferring between populations or laboratories that is frequently necessary for marker assisted selection programs (Liu et al, 1994). Due to the speed and efficiency of RAPD analysis, high-density genetic mapping in many plant species such as
alfalfa (Kiss et al. 1993), faba bean (Torress et al. 1993) and apple (Hemmat et al. 1994) was developed in a relatively short time. The RAPD analysis of NILs (non-isogenic lines) has been successful in identifying markers linked to disease resistance genes in tomato (Martin et al. 1991), lettuce (Paran et al. 1991) and common bean (Adam-Blondon et al. 1994). In hazelnut was used in the identification of self-incompatibility alleles (Pomper et al. 1998) and in resistance to eastern filbert blight (Mehlenbacher et al. 2004).
1.5.2.2. Amplified Fragment Length Polymorphism (AFLP)
AFLP technology combines the power of RFLP with the flexibility of PCR-based technology by ligating primer recognition sequences (adaptors) to the restricted DNA and selective PCR amplification of restriction fragments using a limited set of primers (Vos et al. 1995). The AFLP technique generates fingerprints of any DNA regardless of its source, and without any prior knowledge of DNA sequence. Most AFLP fragments correspond to unique positions on the genome and hence can be exploited as landmarks in genetic and physical mapping. The technique can be used to distinguish closely related individuals at the sub-species level (Althoff et al. 2007) and can also map genes. Applications for AFLP in plant mapping include establishing linkage groups in crosses, saturating regions with markers for gene landing efforts (Yin et al. 1999) and assessing the degree of relatedness or variability among cultivars (Mian et al. 2002). For high-throughput screening approach, fluorescence tagged primers are also used for AFLP analysis. AFLP has been successfully applied to many kinds of plants such as rice (Mackill et al., 1996), wheat (Barrett and Kidwell, 1998), tea (Balasanavanan et al., 2003), larch (Semerikov et al., 2003) and hazelnuts (Chen et al., 2005; Martins et al., 2014). In poplar AFLP has been used to assess genetic diversity (Storme et al., 2004), screen interspecific hybrids (Chauhan et al., 2004), determine the genetic structure of natural populations (Arens et al,.1998) and construct genetic linkage maps (Zang et al,.2004).The advantages of AFLP include highly reliable and reproducible (Jones et al., 1997), it not require any DNA sequence information from the organism under study and it is information-rich due to its ability to analyze a large number of polymorphic loci simultaneously with a single primer combination on a single gel as compared to RFLPs and microsatellites (Russell et al., 1997). Disadvantages include the need for purified, high molecular weight DNA, the dominance of alleles, and the possible non-homology of co-migrating fragments belonging to different loci. In addition, due to the high number and