ABSTRACT
RESUMO
Correlação entre as propriedades nutricionais dos grãos e viscosidade de pasta de farinhas
pré-gelatinizadas de arroz -vermelho
Assim como as de qualquer variedade de arroz, as características do arroz-vermelho estão sujeitas a diferenças varietais, condições de cultivo e forma de processamento, propriedades nutricionais e reológicas. Neste trabalho, determinaram-se as características nutricionais (composição centesimal e de minerais) e as propriedades de viscosida-de da pasta dos grãos crus viscosida-de quatro genótipos viscosida-de arroz-vermelho (Tradicional, MNAPB0405, MNACE0501 e MNACH0501) e as propriedades de viscosidade de pasta de farinhas pré-gelatinizadas, obtidas em diferentes tempos de cocção (20, 30 e 40 min). Foram correlacionadas as principais propriedades nutricionais com as propriedades de pasta das farinhas pré-gelatinizadas. As amostras apresentaram diferenças nutricionais e de viscosidade de pasta. MNAPB0405 e MNACE0501 mostraram maiores teores de fibras e lipídios e forneceram maior energia calórica que Tradicional e MNACH0501, os quais, por sua vez, apresentaram maiores teores de amilose. MNACH0501 apresentou
Recebido para publicação em 14/12/2010 e aprovado em 23/01/2011
1 Food Engineer, Doctor. Postgraduate Course of Agricultural Engineering at the Universidade Estadual de Goiás (UEG). Rod. BR 153, nº 3.105, Fazenda Barreiro do Meio, Caixa
Postal 459, 75132-903, Anápolis, GO, Brazil [email protected] *Corresponding author
2 Food Engineer, Master of Sciences. Agroindustrial/CEFET. Fazenda Palmital, Km 2,5, Zona Rural, 75790-000, Urutaí, GO, Brazil. [email protected]
3 Agronomist Engineer, PhD, Researcher. Embrapa Arroz e Feijão. Rodovia GO-462, Km 12, Zona Rural, 75375-000, Santo Antonio de Goiás, GO, Brazil [email protected] 4 Food Engineer, Doctor. Embrapa Agroindústria de Alimentos. Av. de las Américas 29.501, Guaratiba, 23020-470, Rio de Janeiro, RJ. Brazil. [email protected]
Diego Palmiro Ramirez Ascheri1* Josianny Alvez Boêno2 Priscila Zaczuk Bassinello3, José Luís RamírezAscheri4
Correlation between grain nutritional content and pasting properties
of pre-gelatinized red rice flour
As with any variety of rice, red rice characteristics are subject to varietal differences, growing conditions, types of processing, and nutritional and rheological properties. This study determined the nutritional characteristics (centesimal composition and minerals) and paste viscosity properties of raw grains of four red rice genotypes (Tradicional MNAPB0405, MNACE0501 and MNACH0501) and the paste viscosity properties of pre-gelatinized flours obtained at different cooking times (20, 30 and 40 min). The main nutritional properties were correlated with the pasting properties of the pre-gelatinized flours. The samples showed differences in nutritional properties and paste viscosity. MNAPB0405 and MNACE0501 showed higher levels of fiber and fat and provided higher caloric energy than Tradicional and MNACH0501, which, in turn, showed higher levels of amylose. MNACH0501 showed higher peak viscosity (2402 cP), higher breakdown viscosity (696 cP) and a greater tendency to retrogradation (1510 cP), while Tradicional, MNAPB0405 and MNACE0501 had pasting profiles with peak viscosities varying between 855 and 1093 cP, breaking viscosity below 85 cP and retrogradation tendency between 376 and 1206 cP. The factors genotype and cooking time influenced the rheological behavior of pre-gelatinized flours, decreasing their pasting properties. The protein and amylose levels are correlated with the pasting properties and can be used as indicators of these properties in different genotypes of red rice, whether raw or processed into pre-gelatinized flours.
INTRODUCTION
Red rice, also known as de-Veneza” and “arroz-da-terra” (Pereira et al., 2010), and in English as weedy rice and red yeast rice, belongs to the same botanical species of the Asian rice (Oryza sativa L.), but in commercial rice crops, it is considered an invasive plant for causing considerable damage, mainly by reducing the quality of the final product (Santos et al., 2007).
Although there is abundant literature on its control, in an attempt to eliminate it from white rice crops, the genetic viability of red rice should be preserved to maintain rice quality and promote its genetic improvement. That is, the white rice actually originated from a mutation that changed the red seed of wild rice into the white seeds of modern rice and has finally become a characteristic of great commercial interest, and therefore a priority in most rice breeding programs (Pereira et al., 2007, Pereira et al., 2008, Pereira et al., 2010). In addition, new red rice genotypes have emerged to supply the demands for products that improve the eating pattern of its consuming population, meeting the concepts of productivity and quality.
Little is known about its nutritional quality, but in Asia and Oceania, the red rice is valued for its antioxidant properties and is used in the preparation of breads, colored pasta, vinegar, alcoholic beverages, drugs and cosmetics (Pantindol et al., 2006). In Brazil, it is cultivated in small areas of semi-arid Northeast, predominantly by family farmers, and it is estimated that the currently acreage does not reach 10,000 hectares (Pereira, 2004); however, its consumption is appreciated for the nutritional value and flavor.
According to Stork et al., (2005), the polished white rice contains (dry basis) 8.94% protein, 0.36% lipids, 0.30% ash and 2.87% of total dietary fiber. Juliano (1985) reported different concentrations of calcium (11.6 to 34.9), magnesium (23.3 to 58.1), potassium (81.4 to 151.2), zinc (0.2-0.3), copper (0.7 to 2.7), manganese (0.7 to 2.0 ) and
iron (0.2 to 3.3 ) mg per 100 g rice. The Food and Agriculture Organization of the United Nations (FAO, 2010) highlights the main components of red rice (non-specific genotype) in 7.0% protein, 2.0% fiber and the micronutrients iron and zinc at 5.5 and 3.3 mg per 100 g rice, respectively.
As with any variety of rice, red rice characteristics are subject to varietal differences, growing conditions (climate, soil, location) and types of processing. Pereira et al., (2009), studying four different genotypes of red rice, observed variations in productivity (6000-11000 kg ha-1), amylose
content (15-25%), content of zinc (19-40 mg kg-1 ) and iron
(14-18 mg kg-1), cooking time (35-41 min) and pot yield
(200-250%).
The nutritional composition is considered a key factor affecting the technological properties of rice. During cooking, proteins and lipids can interact with the starch, affecting the viscosity, volume and stickiness of cooked rice (Martin & Fitzgerald, 2002). Proteins form a network of starch-protein that restricts uptake of water during cooking. Lipids tend to form complexes with starch, also preventing water uptake. Rice with high levels of lipids and proteins tends to absorb less water during cooking, resulting in a looser and less sticky rice (Saleh & Meullenet, 2006).
The amylose content is considered one of the most important variables to assess the cooking behavior of rice (Xie et al., 2007), directly affecting the firmness of grain and, conversely, the stickiness of cooked rice. Pereira et al., (2009) observed that the red rice has a lower amylose content than white rice and requires more time for effective cooking, even because it is traditionally consumed as partially milled (or barely polished).
Viscosity is an important technological property in the assessment of cooking quality of rice and paste properties of pre-gelatinized flours. Hu et al., (2004) as cited in Zhang et al., (2008) reported that the viscosity profile is useful in the selection of strains with certified quality in rice breeding programs and is subject to varietal differences. maior pico de viscosidade (2.402 cP), maior viscosidade de quebra (696 cP) e maior tendência à retrogradação (1510 cP), enquanto as amostras Tradicional, MNAPB0405 e MNACE0501 apresentaram pastas com picos de viscosidade entre 855 e 1093 cP, com quebra de viscosidade inferior a 85 cP e tendência à retrogradação entre 376 e 1206 cP. Os fatores genótipo de arroz-vermelho e tempo de cocção influenciaram no comportamento viscoso das farinhas pré-gelatinizadas, diminuindo suas propriedades de pasta. Os teores de proteínas e de amilose estão correlacionados com as proprieda-des de pasta, podendo ser empregados como indicadores proprieda-destas propriedaproprieda-des nos diferentes genótipos de arroz-vermelho, sejam crus ou transformados em farinhas pré-gelatinizadas.
Ascheri et al., (2010) submitted five cultivars of upland rice to different cooking times and found that the maximum viscosity and the retrogradation tendency of the flours prepared depended on the interaction of these factors and were reduced as a function of the cooking time.
Therefore, it is believed that grains of different genotypes of red rice have different properties and produce pre-gelatinized flours also with different properties. Thus, in this study, we determined the nutritional and viscoamylographic properties of four genotypes of red rice in the form of raw and pre-gelatinized flours obtained at different cooking times and correlated the main nutritional properties with the pasting properties.
MATERIALS AND METHODS
Red rice seeds of genotypes Tradicional (Tr), MNAPB0405 (PB), MNACE0501 (EC) and MNACH0501 (CH) were kindly supplied by the Red Rice Breeding Program - Embrapa Meio-Norte (Teresina/PI). Sowing was carried out in an experimental field with irrigation system belonging to Embrapa Meio-Norte in July 2007 and harvested in November of the same year.
After harvest, 5 kg of paddy rice of each genotype were stored in plastic bags and taken to the Food Analysis Laboratory at Embrapa Arroz e Feijão (Santo Antônio de Goiás-GO) for processing in a Suzuki TM-95 milling machine (Suzuki Co., Sao Paulo, Brazil). Semi-polished grain rice was obtained based on the comparison with a commercial sample (polishing defined at 15s). The degree of polishing was determined by the Satake Milling Meter MM1B.
The analysis of nutritional properties was carried out using semi-polished red rice dried in a FANEM 520 oven (Fanem, Sao Paulo, Brazil) at 105 °C and ground in a hammer mill Perten Laboratory Mill 3100 (Petern Instruments, Huddinge, Sweden) to pass a sieve with 0.63 mm mesh opening. Moisture, ash, protein and lipids were determined according to the methods described by the Association of Official Analytical Chemists (AOAC, 2000). The crude fiber content was determined as described by Gonçalves (1998).
Total carbohydrate content was calculated by subtraction of the sum of the moisture, total fat, ash and crude protein from 100; carbohydrate values include the total dietary fiber (Taco, 2006). The total energy was calculated by multiplying the levels of lipids, proteins and carbohydrates in each sample by their respective caloric values: 9.4 and 4 kcal, according to the conversion factor Atwarter.
The amylose content was determined by the colorimetric method of Martinez & Cuevas (1989), using
as indicator the iodine/potassium iodide solution and the formed complex was measured by a spectrophotometer (Femto, 432, São Paulo) at 620 nm.
Ca, Mg, Zn, Cu, Mn, Fe and K were determined using the method of Battaglia et al., (1978). Preliminarily, unbroken red rice grains were washed in distilled water and dried at 50 ºC in an air-forced oven (Nova Ética, 400/ 5ND 300°, São Paulo) for 48 h. Then, the material was ground in a zirconium ball mill (Retsch, MM200, Germany), weighed (500 mg) in parchment paper, using an analytical balance (Kern 410, Germany) and transferred into digestion tubes for nitroperchloric digestion. The elements were quantified by an atomic absorption spectrophotometer (Perkin Elmer, Aanalyst 100, Massachusetts) using the instrumental parameters (lamp wavelength, lamp current and slit width) specific for each element in atomic absorption. Potassium was determined by the intensity of radiation emitted, and readings were held in a flame photometer (D-igimed, DM-61, São Paulo).
The changes that occur in the pasting properties of pre-gelatinized red rice flours were studied as a function of genotype and cooking time. The experiment was arranged in a completely randomized design as a 3 x 4 factorial, with three cooking times (20, 30 and 40 min) and four red rice genotypes (Tr, PB, CE, and CH), with two replicates.
Rice cooking was analyzed by the method described by Bassinello et al., (2004) with modifications to the cooking time. Rice and water were added in an aluminum pan and allowed to boil until before the water dried up, covering the pan and then reducing the gas flame for slow cooking; 150 g of rice and 300 mL of distilled water were used for each cooking time of 20, 30 and 40 min. During the cooking, 75, 150 and 225 mL of water were added to complete these times, respectively, otherwise, the samples would burn and would not be boiled sufficiently. The raw and cooked samples were dried in an Fanem 520 oven (Fanem, Sao Paulo, Brazil) at 45 °C for 16 h, and ground in a hammer mill Perten Laboratory Mill 3100 (Petern Instruments, Huddinge, Sweden) to obtain the red rice flours.
detected at the beginning of the increase in flour viscosity; the peak time and peak viscosity were detected at the maximum peak viscosity; and the values for viscosity breakdown and the tendency to retrogradation (setback) were calculated by the difference between peak viscosity and final viscosity (Vfim, detected at the time 20 min of the RVA reading) and hot paste viscosity (Vmin was detected during the cooling cycle), respectively.
The statistical analysis of the experimental data was performed according the method described by Gomes (2000). The measurements (means of three replicates) were expressed as mean value ± standard deviation. The effect of rice genotype (independent variable) on the red rice physicochemical properties and the effects caused by the factor genotype x time on the pasting properties of the flours were examined by the analysis of variance at 5% probability and significant responses were tested using the Tukey’s test at 5% probability level.
The relationship between the main nutritional properties and paste viscosity of raw and pre-gelatinized flours was obtained with the degree of correlation, applying the Pearson correlation matrix (Pearson’s product-moment correlation coefficient, r) at 5 and 10% probability. The r values were interpreted as follows (Callegari-Jacques 2003):
- If 0.00 < r <0.30, weak linear correlation exists; - If 0.30 < r <0.60, moderate linear correlation exists; - If 0.60 < r <0.90, there is a strong linear correlation; The statistical analysis and graphs were performed using the software Statistica 8.0 (Statsoft, 2007).
RESULTS AND DISCUSSION
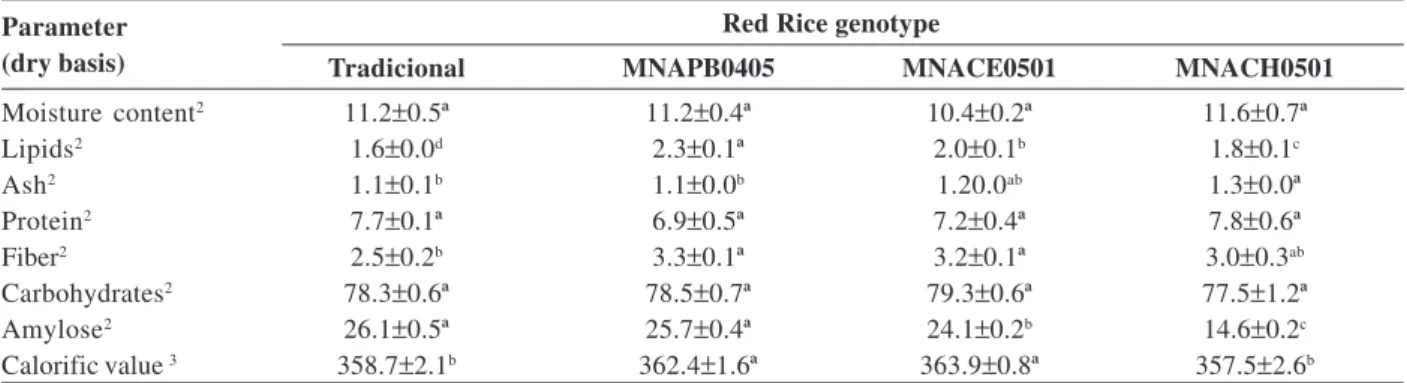
Tables 1 and 2 show the centesimal composition and mineral profile of the red rice genotypes, respectively. Red rice had high contents of carbohydrates (77.5-79.3%), protein (6.9-7.8%), potassium (198-268 mg per 100 g of grains), magnesium (70 -86 mg per 100 g of grains) and calcium (12-18 mg per 100 g of grains) and low lipid content (1.6-2.3 dag kg-1), ash (1.1-1.3 dag kg-1), fiber
(2.5-3.3 dag kg-1), zinc (2-2.5 mg per 100 g of grains),
copper (0.1-0.4 mg per 100 g grains), manganese (1.2-2.5 mg per 100 g grains) and iron (1.0-1.2 mg per 100 g grains), providing a calorific value of 357.5 to 363.9 kcal per 100 g of grains.
Tables 1 and 2 shows that the levels of ash, fat, fiber, amylose, energy value, calcium, magnesium, potassium, copper, manganese and iron, differed between genotypes, indicating that the improvement of red rice brought about variation in the grain chemical composition.
The protein contents were similar to those described by FAO (2010) for red rice (7.0%), the Brazilian Table of
Food Composition (Taco, 2006), for long grain brown and polished (raw) rice (7.3 and 7.2%, respectively), and Lumen & Chow as cited in Walter et al., (2008) for polished white rice (4.3-18.2%). Juliano & Bechtel (1985) stated that this variation is due to the genetic characteristics of rice and other factors such as soil (nitrogen), environmental conditions (solar radiation and temperature), etc.. However, Liu et al., (2005) found, not only difference in the total protein concentration (7.35 to 11.47%) between genotypes of Japanese rice, but also variation in the types of proteins.
The contents of ash and lipids were higher than those reported for polished white rice (Storck et al., 2005; Taco, 2006, Walter et al., 2008) and are close to the contents of ash (1.2%) and lipids (1.9%) of raw brown rice (Taco, 2006), even because red rice is classified as barely polished, and as such, during the polishing part of the bran is not removed, remaining a reddish color which is related to the concentration of phenols, polyphenols, anthocyanins (Pantindol et al., 2006) and other fatty substances.
The red rice genotypes have the same energy value of brown and polished (raw) rices, which provide between 357 and 364 kcal per 100 g grains, respectively (Taco, 2006). However, the Tukey test (Table 1) showed that the genotypes PB and CE had higher fiber and fat contents and provided higher caloric energy than the genotypes Tr and CH. On the other hand, Tr and PB had higher amylose content, followed by the genotypes CE and CH.
The amylose contents are in agreement with those reported by Pereira et al., (2009) for the same red rice genotypes studied. Tr, PB and CE showed intermediate levels of amylose (between 24.1 and 26.1%), which characterizes their grain as dry and loose after cooking, and soft during rewarming. Genotype CH had low amylose content (14.6%) and its grains are characterized as soft, watery and sticky during cooking. Red rice genotypes are characterized by sticky grains and, therefore, they usually have low contents of amylase (Pereira, 2004). But, other factors affect the cooking quality of rice; for example, the distribution of long chains of amylopectin in the starch, climatic and growing conditions. Furthermore, the cooking method of red rice, traditionally done in a large quantity of milk rather than water, can produce a more soggy rice. In this study, we used the optimum amount of water, not in excess, for the cooking.
However, it has been observed, as in Table 2, that the red rice has approximately two, three and eight times the content of magnesium, potassium and zinc contained in the polished rice, as reported by Juliano (1985) and Taco (2006). Although the genotypes PB and CE had higher manganese contents, the other nutrients (calcium, copper, and iron) had levels that were intermediate to those reported by Juliano (1985) and Taco (2006). These results show that these red rice genotypes provide one or more times the amount of minerals in relation to the white polished rice.
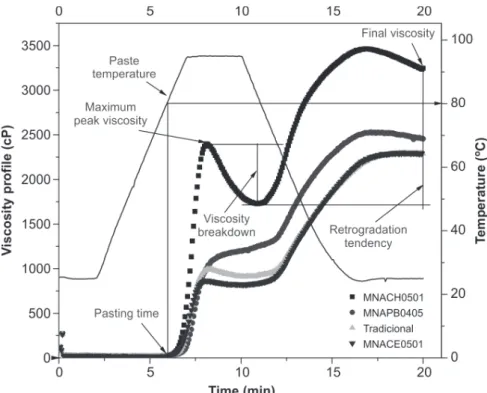
Figure 1 shows the paste viscosity profile obtained from flour of raw grains of the red rice genotypes studied. It also highlights the points of peak viscosity, paste temperature, breakdown and setback.
Figure 1 shows that during the initial heating phase, the viscosity starts to increase because of the swelling of starch and the leaching of amylose and other lower molecular weight polymers, forming a paste. Pasting started between 5 and 6 min at 70-80 ºC. Genotype PB spent less energy (70 ºC) and time (5 min) to form a paste, while the other genotypes spent 6 min, at a temperature of approximately 80 ºC.
Maximum peak viscosity was reached during pasting and occurred between 8 and 9 min at 95 ºC. According to Tsai et al., (1997), this phenomenon occurs when most of
the starch granules are fully swollen and other granules and dissolved polymers remain molecularly non-aligned within the field of friction of the Rapid Visco Analyzer (RVA).
Genotype CH formed the highest peak viscosity (2402 cP), faster than the others, with a sharp shape. According to Matuda (2004), the sharp shape of peaks of viscosity indicates the presence of starch granules with expansion and break properties more uniform during the hydrothermal treatment. This fact was not observed in the other genotypes. The flat shape of peak viscosity of genotypes PB, Tr and CE, wich had viscosity values lower than genotype CH, indicates that the starch granules have low resistance to expansion/break during the hydrothermal treatment.
After the peak, genotype CH showed a more precise profile, with a steep decline in viscosity (696.0 cP break), until it reached a viscosity of 1706.0 cP, within 11 min at 81 ºC. However, the profile of genotypes Tradicional and CE formed a platform, indicating a very small decrease in viscosity (70 and 26 cP, respectively). The platform was formed due to remaining starch granules which were not gelatinized during heating and therefore, they have a certain resistance to expansion/break during the hydrothermal treatment. Although we have considered the viscosity peak at 1137 cP for genotype PB, this profile
Table 1. Centesimal composition, energy value and amylose content in processed grains of different red rice genotypes1
Red Rice genotype
Tradicional MNAPB0405 MNACE0501 MNACH0501
Moisture content2 11.2±0.5ª 11.2±0.4ª 10.4±0.2ª 11.6±0.7ª
Lipids2 1.6±0.0d 2.3±0.1ª 2.0±0.1b 1.8±0.1c
Ash2 1.1±0.1b 1.1±0.0b 1.20.0ab 1.3±0.0ª
Protein2 7.7±0.1ª 6.9±0.5ª 7.2±0.4ª 7.8±0.6ª
Fiber2 2.5±0.2b 3.3±0.1ª 3.2±0.1ª 3.0±0.3ab
Carbohydrates2 78.3±0.6ª 78.5±0.7ª 79.3±0.6ª 77.5±1.2ª
Amylose2 26.1±0.5ª 25.7±0.4ª 24.1±0.2b 14.6±0.2c
Calorific value 3 358.7±2.1b 362.4±1.6ª 363.9±0.8ª 357.5±2.6b
1 Mean values + standard deviation of three replicates. 2 As percentage. 3 In Kcal per 100 g of grains. Means followed by different letters
in rows differ at 5% by the Tukey’s test. Parameter
(dry basis)
Table 2. Profile of main minerals in processed grains of different red rice genotypes1 (mg/100g)
Red Rice genotype
Tradicional MNA PB0405 MNA CE0501 MNA CH0501
Calcium 15,1±0,5b 17,4±0,2a 12,9±0,9c 13,9±0,8bc
Magnesium 70,4±0,8c 80,7±1,7b 85,4±1,0a 84,8±0,2a
Potassium 198,1±1,9b 209,2±26,5b 267,1±5,0a 252,8±19,0a
Zinc 2,3±0,1a 2,2±0,0a 2,1±0,0a 2,2±0,1a
Copper 0,3±0,0b 0,2±0,0c 0,3±0,0b 0,3±0,0a
Manganese 1,7±0,0c 2,5±0,1a 2,1±0,2b 1,2±0,0d
Iron 1,0±0,1b 1,1±0,1ab 1,1±0,1ab 1,2±0,1a
1 Mean values + standard deviation of three replicates. 2 As percentage. 3 In Kcal per 100 g of grains. Means followed by different letters
in rows differ at 5% by the Tukey’s test. Parameter
has not stopped risen, reaching a negative value in viscosity breakdown (-117 cP).
During the cooling cycle, pastes of all genotypes showed a similar profile, increasing with time of RVA reading, and the highest retrogradation tendency was recorded for genotype CH. Although the genotypes Tr and CE had the same final viscosity (2281 cP), their retrogradation tendency differed in 94 cP; however, they were higher than that of PB, 1206 cP.
The viscosity profile in Figure 1 shows that different red rice genotypes have different rheological properties. Although the genotype CH has the same viscosity profile of the commercial white rice (Ascheri et al., 2006), their paste viscosity properties differ considerably, and these differences are even greater with the other genotypes. In general, the maximum viscosity peak of the red rice flour, the breakdown and tendency to retrogradation were 1-5, 1-40 and 2-2.5 times lower than those of the commercial white rice. That is, the pastes made with red rice are less sticky, both heated and cooled, which also allows inferring that the cooked grains can absorb less water when hot, and become soft and loose when cooled, in relation to the commercial white rice.
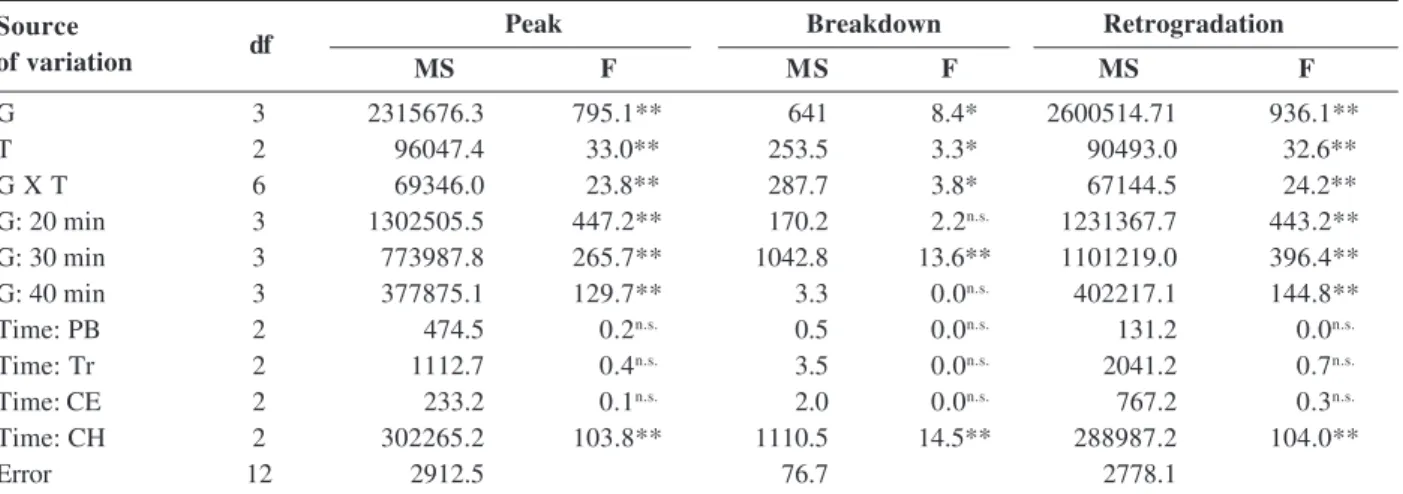
Table 3 shows the pasting properties of pre-gelatinized flours of red rice, as a function of genotype and cooking time and Table 4 shows the results of the variance analyzes. The statistical analysis (Table 4) shows that genotype CH differs from all others in cooking times, except for viscosity breakdown at 20 and 40 °C. Conversely, in the Table 3, the factor cooking time caused changes in the
starch structure of all genotypes of red rice studied, altering significantly the rheological behavior of the pre-gelatinized flours, reducing the peak viscosity and retrogradation, with irregular behavior of the viscosity breakdown. Pinkrová et al., (2003) and Yu & Wang (2007) also noted this type of viscous behaviour, but for rice starch irradiated in microwave oven and with gamma rays, respectively.
The pastes of pre-gelatinized flours of genotype CH are slimy and have higher setback viscosity than the flours of the other red rice genotypes studied. The peak viscosity, breakdown and setback tendency had values of 948-1725.5, 931.5-1640 and 21-47.5 cP, respectively, indicating that the pre-gelatinized flours from cooked grains of genotype CH can absorb more water when hot and become sticky when cold.
The low values of viscosity peak of pre-gelatinized flours of genotypes Tr (127.5-80.5 cP), PB (199.5-88.5 cP) and CE (89-67.5 cP) show that the crystalline structure of the starch granules that remain intact after cooking is resistant to gelatinization and retrogradation, suggesting that these flours can absorb less water when hot and are less sticky when cold.
The relationship between the main nutritional components of red rice, peak viscosity and retrogradation tendency of the raw and pre-gelatinized flours are shown in Table 5.
The lipid content showed strong positive correlation with the fiber content (r = 0.91) and negative correlation with the protein content (r = -0.92). Correlation was also
found, although not significant, between the fiber and protein contents (r = -0.75); however, it suggests a decreasing trend between the degree of polishing and the protein content in red rice, ie, the greater the degree of polishing, the greater the fiber removal and hence the greater the protein concentration in red rice. Therefore, the greater the retention of bran in the polished red rice, the higher the lipid content and the lower the protein content.
Nuwamanya et al., (2010) found a linear relationship between the fiber content and pasting properties in cas-sava starch. The increase in fiber content decreases the peak viscosity. In this study, this relationship was not observed; the peak viscosity was not linearly dependent on the fiber content (r = ~ 0).
The positive correlation between the protein content and pasting properties (0.52 < r < 0.65) suggests that proteins may contribute to the increase in viscosity; however, this correlation was not significant, contrary to the study of Moorthy (2000), which showed that a high protein content influences the properties of starchy materials, adversely affecting the pasting properties.
The contents of lipids, fiber and protein did not affect the amylose content of red rice genotypes, with very low correlations of 0.23, -0.09 and -0.58, respectively.
The amylose content is an important parameter to study the changes that occur in the starch pasting properties. In the genotypes studied, the amylose content
Table 3. Pasting properties of different red rice genotypes at different times of cooking1
Cooking time (min)
20 30 40
Viscosity peak (cP)
Tradicional 127.5±2.1bA 107.5±0.7bA 80.5±3.5bA
MNAPB0405 119.0±1.4bA 107.5±0.7bA 88.5±0.7bA
MNACE0501 89.0±1.4bA 76.5±3.5bA 67.5±0.7bA
MNACH0501 1725.5±169.0aA 1341.0±69.3aB 948.0±127.3aC
Viscosity breakdown (cP)
Tradicional 4.0±1.4bA 2.0±0.0bA 1.5±0.7 aA
MNAPB0405 1.5±2.1bA 2.0±0.0bA 2.5±3.5 aA
MNACE0501 2.5±3.5bA 1.5±2.1bA 3.5±0.7aA
MNACH0501 21.0±29.7aB 47.5±0.7aA 0.5±0.7aC
Retrogradation tendency (cP)
Tradicional 99.5±0.7bA 46.0±1.4bA 42.5±0.7bA
MNAPB0405 44.5±4.9b 31.0±1.4bA 30.0±2.8bA
MNACE0501 70.0±2.8bA 44.5±16.3bA 31.5±0.7bA
MNACH0501 1640.0±137.2aA 1524.5±16.3aB 931.5±118.0aC
1 Means + standard deviation of two replicates. Means followed by different small letters in the columns and different capital letters in the
rows are significantly different by the Tukey’s test at 5% probability. Red Rice genotype
Table 4. Summary of the analysis of variance of pasting properties of pre-gelatinized flours of red rice genotypes (G) obtained at different cooking times (T)
Peak Breakdown Retrogradation
MS F MS F MS F
G 3 2315676.3 795.1** 641 8.4* 2600514.71 936.1**
T 2 96047.4 33.0** 253.5 3.3* 90493.0 32.6**
G X T 6 69346.0 23.8** 287.7 3.8* 67144.5 24.2**
G: 20 min 3 1302505.5 447.2** 170.2 2.2n.s. 1231367.7 443.2**
G: 30 min 3 773987.8 265.7** 1042.8 13.6** 1101219.0 396.4**
G: 40 min 3 377875.1 129.7** 3.3 0.0n.s. 402217.1 144.8**
Time: PB 2 474.5 0.2n.s. 0.5 0.0n.s. 131.2 0.0n.s.
Time: Tr 2 1112.7 0.4n.s. 3.5 0.0n.s. 2041.2 0.7n.s.
Time: CE 2 233.2 0.1n.s. 2.0 0.0n.s. 767.2 0.3n.s.
Time: CH 2 302265.2 103.8** 1110.5 14.5** 288987.2 104.0**
Error 12 2912.5 76.7 2778.1
MS: mean square, F: F test, *, ** and ns: significant at 5%, 1% and not significant by the F test, respectively.
Source
showed inversely proportional correlations with peak viscosity (-0.99 < r < -0.96). Tukomane et al., (2007) reported that starches with low amylose content showed a higher degree of crystallinity, resulting from the reduction of amorphous regions in their granules, and tend to have higher peak viscosity.
Sarmento et al., (1999) found a positive correlation between the retrogradation of cassava starch pastes and amylose. Rodríguez-Sandoval et al., (2008) discuss that this phenomenon is caused by the aggregation of amylose, after cooling of the pastes, which acts as a nucleus during the rearrangement of amylopectin. The amylose tends to reassociate, through hydrogen bonds, with other adjacent amylose molecules forming double-helical crystal structures when the solution cools down and remains intact for a long period of time (Denardin & Smith, 2009) .
Nevertheless, retrogradation not always has this behavior, as it happened in this study; the amylose content and retrogradation tendency of the red rice samples were negatively correlated (-0.99 < r < -0.76), for some cause that has yet to be explained.
However, Denardin & Silva (2009) reported that retrogradation is a complex phenomenon and varies with several factors such as temperature, pH, starch source and presence of other components (lipids, electrolytes and sugars). Some studies have shown that as in gelatinization, some populations of amylopectin chains may promote or inhibit the retrogradation of amylopectin because of the greater or lesser formation of double helices during retrogradation (Vandeputte & Delcour, 2004). However, the exact influence of the amylose retrogradation is still obscure.
CONCLUSIONS
The genetic improvement influences the chemical composition of red rice, causing significant variation in the contents of fiber, lipids, amylose and minerals. Red rice is richer in fiber, fat and minerals than the commercial white rice.
The pasting properties of genotype CH indicate that their cooked grains can absorb more water when hot and are sticky when cold, while the genotypes Tr and CE (89-67.5 cP) may absorb less water when hot, and are less sticky when cold.
The protein and amylose contents are correlated with the pasting properties and can be used as indicators of these characteristics for different genotypes of red rice, either for raw grains or processed into pre-gelatinized flours.
ACKNOWLEDGMENTS
The authors would like to thanks the State Universi-dade Estadual de Goiás, Embrapa Arroz e Feijão and Embrapa Tecnologia de Alimentos for the help in conducting the experiments, and CAPES for the financial support.
REFERENCES
AOAC (2000). Official Methods of Analysis of AOAC International. 17. ed. Gaithersburg, AOAC International, v.2, 1219p.
Ascheri DPR, Andrade CT, Carvalho CWP & Ascheri JLR (2006) Obtenção de farinhas mistas pré-gelatinizadas a partir de arroz e bagaço de jabuticaba: efeito das variáveis de extrusão nas pro-priedades de pasta. Boletim do Centro de Pesquisa de Processamento de Alimentos, 24:115-144.
Table 5. Correlation matrix between the main nutritional properties and pasting properties of raw and pre-gelatinized flours of red rice genotypes
Nutritional characteristics Viscosity peak Retrogradation
Lip Prot Fibr Amil P0 P20 P30 P40 R0 R20 R30 R40
Lip 1.00
Prot -0.92¥ 1.00
Fib 0.91¥ -0.75ns 1.00
Amyl 0.23ns -0.58ns -0.09ns 1.00
P0 -0.21ns 0.57ns 0.03ns -0.96* 1.00
P20 -0.27ns 0.62ns 0.00ns -0.99* 0.99* 1.00
P30 -0.28ns 0.63ns 0.00ns -0.99* 0.99* 1.00* 1.00
P40 -0.27ns 0.62ns 0.00ns -0.98* 0.99* 1.00* 1.00* 1.00
R0 -0.36ns 0.52ns 0.06ns -0.76ns 0.54ns 0.65ns 0.66ns 0.65ns 1.00
R20 -0.31ns 0.65ns -0.03ns -0.99* 0.99* 1.00* 1.00* 1.00* 0.67ns 1.00
R30 -0.29ns 0.63ns -0.01ns -0.99* 0.99* 1.00* 1.00* 1.00* 0.67ns 1.00* 1.00
R40 -0.29ns 0.64ns -0.01ns -0.99* 0.99* 1.00* 1.00* 1.00* 0.66ns 1.00* 1.00* 1.00
* Correlation significant at 5% probability level; ¥ correlation significant at 10% probability level; ns non-significant correlation. Lip =
lipids, Prot = protein, Fib = fiber; Amyl = amylose, P0, P20, P30 and P40 and R0, R20, R30 and R40 = peak viscosity and retrogradation tendency, respectively, of raw and pre-gelatinized red rice flours cooked for 20, 30 and 40 min.
Ascheri DPR, Pereira LD, Bassinello PZ, Carvalho CWP & Ascheri JLR (2010) Calidad del arroz de tierras altas en función del tiempo de cocción y del cultivar de arroz. Scientia Agraria, 11:163-173.
Bassinello PZ, Rocha MS & Cobucci RMA (2004) Avaliação de diferentes métodos de cocção de arroz de terras altas para teste sensorial. Santo Antônio de Goiás, Embrapa, 8p.
Bataglia PZ, Teixeira JPF, Furlani PR, Furlani AMC & Gallo JR (1978) Análise química de plantas. Campinas, Instituto Agro-nômico. 31p. (Boletim Técnico, 87).
Callegari-Jacques SM (2003) Bioestatística: princípios e aplica-ções. Porto Alegre, Artemed. 255p.
Denardin CC & Silva LP da (2009) Estrutura dos grânulos de amido e sua relação com propriedades físico-químicas. Ciência Rural, 39: 945-954.
Fao (2010) El arroz y la nutrición humana. Año internacional del arroz 2004. Disponível em: http://www.fao.org/rice2004/es/f-sheet/hoja3.pdf. Acessado em 15 de outubro de 2010. Gomes FP (2000) Curso de estatística experimental. 12. ed. São
Paulo, ESALQ/USP. 467p.
Gonçalves AA, Badiale E & Soares LA (1998) Enzymatic determination of soluble and insoluble dietary fiber in rice and wheat bran. Archivos Latinoamericanos de Nutrición, 48:334-338.
Juliano BO & Bechtel DB (1985) The rice grain and its gross composition. In: Juliano BO (Ed.) Rice: chemistry and technology. Minnesota, American Association of Cereal Chemists. p.17-57.
Juliano BO (1985) Polysaccharides, proteins, and lipids of rice. In: Juliano BO (Ed.) Rice: chemistry and technology. Minnesota, American Association of Cereal Chemists. p.17-57.
Liu ZH, Cheng FM, Cheng, WD & Zhang GP (2005) Positional variations in phytic acid and protein content within a panicle of japonica rice. Journal of Cereal Science, 41:297-303. Martin M & Fitzgerald MA (2002) Proteins in rice grains influence
cooking properties. Journal of Cereal Science, 36:285-294. Martinez C & Cuevas F (1989) Evaluación de la calidad culinaria
y molinera del arroz: guía de estudio para ser usada como com-plemento de la unidad auditutorial sobre el mismo tema. 3. ed. Cali, Centro Internacional de Agricultura Tropical. 73p.
Matuda TG (2004) Análise térmica da massa de pão francês duran-te os processos de congelamento e descongelamento: otimização de uso de aditivos. Dissertação de Mestre. Escola Politécnica da Universidade de São Paulo, São Paulo, 142p.
Moorthy S (2000). Tuber crop starches. Tech Bulletin N° 18, Trivandrum: CTCRI. 44p.
Nuwamanya E, Baguma Y, Emmambux N, Taylor J & Patrick R (2010) Physicochemical and functional characteristics of cas-sava starch in Ugandan varieties and their progenies. Journal of Plant Breeding and Crop Science, 2:1-11.
Pantindol J, Flowers A, Kuo M, Wang Y, & Gealy D (2006) Comparison of physicochemical properties and starch structure of red rice and cultivated rice. Journal of Agricultural and Food Chemistry, 54:2712-2718.
Pereira JA (2004) O arroz vermelho cultivado no Brasil. Teresina, Embrapa Meio-Norte. 90p.
Pereira JA, Bassinello PZ, Cutrim VA & Ribeiro VQ (2009) Com-paração entre características agronômicas, culinárias e nutricionais em variedades de arroz branco e vermelho. Caatin-ga, 22:243-248.
Pereira JA, Bassinello PZ, Fonseca JR & Ribeiro VQ (2007) Po-tencial genético de rendimento e propriedades culinárias do ar-roz vermelho cultivado. Caatinga, 20:43-48.
Pereira JA, Morais OP de & Breseghello F (2008) Análise da heterose de cruzamentos entre variedades de arroz vermelho. Pesquisa Agropecuária Brasileira, 43:1135-1142.
Pinkrová J, Hubácková B, Kadlec P, Príhoda J & Bubník, Z (2003) Changes of starch during microwave treat-ment of rice. Czech Journal of Food Science, 21:176-184.
Rodríguez-Sandoval E, Fernández-Quintero A, Cuvelier G, Relkin P & Bello-Pérez L (2008). Starch Retrogradation in cassava flour from cooked parenchyma. Starch/Stärke 60:174-180. Sarmento SBS, Reis MM, Ferreira MMC, Cereda MP, Penteado
MVC & Anjos CB dos (1999) Análise quimiométrica de propri-edades físicas, físico-químicas e funcionais de féculas de mandi-oca. Brazilian Journal of Food and Technology, 2:131-137. Saleh MI & Meullenet JF (2006) Effect of surface lipids on cooked
long-grain rice textural properties. In: Norman RJ, Meullenet JF, Moldenhauer KAK (eds) B.R. Wells Rice Research Studies 2005. Fayetteville, Arkansas Agricultural Experiment Station. p.387-395.
Santos FM, Marchesan E, Machado SLO, Villa SCC, Avila LA & Massoni PFS (2007) Controle químico de arroz-vermelho na cultura do arroz irrigado. Planta Daninha, 25:405-412. Statsoft (2007) Statistica (data analysis software system) version
8.0. Tulsa, Statsoft, Inc. CD-ROM.
Storck CR, Silva LP & Fagundes CAA (2005) Categorizing rice cultivars based on differences in chemical composition. Journal of Food Composition and Analysis, 18:333-341.
Taco (2006) Tabela brasileira de composição de alimentos. 2. ed. Campinas, NEPA-UNICAMP. 113p.
Tsai ML, Li CF & Lii CY (1997) Effects of granular strutctures on the pasting behaviors of starches. Cereal Chemistry, 74:750-757.
Tukomane T, Leerapongnun P, Shobsngob S & Varavinit S (2007) Preparation and characterization of annealed- enzymatically hydrolyzed tapioca starch and the utilization in tableting. Starch/ Stärke, 59:33-45.
Vandeputte GE & Delcour JA (2004) From sucrose to starch gra-nule to starch physical behavior: a focus on rice starch. Carbohydrate Polymers, 58: 245-266.
Walter M, Marchezan E & Avila LA (2008) Arroz: composição e características nutricionais.Ciência Rural, 38:1184-1192.
Xie L, Chen N, Duan B, Zhu Z & Lio X (2007) Impact of protein on pasting and cooking properties of waxy and non-waxy rice. Journal of Cereal Science, 47:372-379.
Yu Y & Wang J (2007) Effect of ã-ray irradiation on starch granule structure and physicochemical properties of rice. Food Research International, 40:297-303.