Application of Performance Based Nonlinear
Seismic Design and Simulation
Static Pushover Analysis for Seismic Design
of RC Buildings
A.Q. Bhatti
National University of Sciences and Technology (NUST), Islamabad, Pakistan
H.Varum
University of Aveiro, Portugal
SUMMARY
Seismic retrofitting of already constructed buildings is one of the most effective methods of decreasing the risk. However the seismic performance of the structure may not be improved by Strengthening unless the professional engineer selects an appropriate modifying technique based on seismic evaluation of the already constructed structures. In this paper nonlinear static pushover analysis has been performed for the said building. The demand spectrum of ATC 40 procedure for this building was compared with real site based demand spectra. The simulation has been compared with and without strengthened structure. The plastic hinges of the building have been plotted for different safety margins.
Keywords: Performance based design, Pushover analysis, Seismic strengthening
1. INTRODUCTION
A component based procedure developed for seismic rehabilitation of already constructed buildings shall be used for a Tier3 Evaluation (ASCE/SEI 31-03). Analysis procedures for such kind of detailed evaluation include linear and nonlinear methods of static or dynamic analysis. These procedures include ATC 40, FEMA 356 & many other procedures. FEMA 356 is the recommended design procedure for evaluation of existing buildings. Acceptance criteria for these kind of detailed procedures for different performance levels depend on strength, stiffness and ductility properties of elements & components evaluated from laboratory testing and analytical procedures. Such kind of component based detailed evaluation methods should be used in accordance with the authority having jurisdiction (Bhatti et al., 2011a, 2011b). If linear analysis procedure is adopted, the analysis should implicitly and/or explicitly recognize nonlinear behavior. Force levels which are used for analysis in the provisions for seismic evaluation of already constructed existing buildings shall be multiplied by 0.75 factor when used in a Tier 3 Evaluation phase as these methods are intended for design. In Tier 1 and 2 Evaluations, this reduction factor is taken into account in various factors including material strength and m factor. The use of reduction factor is verified by following points.
1. The reduction factor reduce the earthquake shaking from conservative level followed in design to one that is trusted to be more accurate for evaluating existing building.
2. The actual strength of element and/or components will be greater than used in procedure. 3. An existing building does not necessarily need to have the same level of safety as newly
constructed building since the remaining useful life of a existing building is obviously less than a new building.
A building fulfilling all provisions for the seismic evaluation of existing buildings shall be considered compliant with this section. The section properties are shown in Table 1.
Figure 1. 3D Finite Element Model Figure 2. Real Picture of Building in Pakistan for
which Seimic evaluation is performed
Table 1. Section Properties Table
Member Dimension Reinforcement
Beam – B1 (width x height) 12” x 18” Top 5 # 6, Bot 5-#6 (Stirrup #3@6”)
Column – C1 12” x 16” 6 # 6 bars
(Stirrups #3@6”)
Column – C2 9” x 16” 6#6 bars
(Strirrups # 3@6”
Slab Thickness = 6 “
Rectangular Section 12”x18” Top 5 # 6, Bot 5-#6 (Stirrup #3@6”)
2. METHODS OF ANALYSIS
In evaluation of seismic performance of a building, a structural analysis of the considered mathematical model is required to determine the demands for force and displacements in various elements/components of the building. Several analysis procedures including both elastic and inelastic, are used to determine the seismic performance of the building. The finite element model is shown in Fig. 1. The actual building for which Pushover Analysis was carried out is shown in Fig. 2.
2.1. Selection of Detailed Procedures
Analysis of the Structure should be carried out using one of the methods discussed above. Linear procedures are considered to be adequate when the expected nonlinearity level is low. This is measured by finding the ratio of component demand to capacity (DCRs) (< 2.0).
The procedures which recognize the nonlinear behavior of the structural components in earthquake are considered to give the most accurate results. Nonlinear analysis procedures should be selected for complex and/or irregular buildings and for case where performance level is high. For the Buildings with any of the following characteristics should not be evaluated by linear analysis methods. The fundamental Time period of the structure, T ≥ 3.5 x SD1/ SDS
Ratio of the building horizontal dimension at any story height exceeds 1.4 times of the horizontal dimension with an adjacent story.
The building having irregularity in its torsional stiffness The structure has a vertical mass or stiffness irregularity
The lateral force resisting system is non orthogonal. 2.2. Description of Pushover Analysis
In Pushover analysis method the building is subjected to monotonically increasing lateral forces with an invariant distribution of target displacements height wise is reached. Following are the available static nonlinear procedures a) Capacity Spectrum Method, b) Displacement Coefficient Method, c) Secant Method
3. PUSHOVER ANALYSIS WITH SAP2000
Nonlinear behavior of components of a structure is denoted by following hinges are formed as shown in below Fig. 3.
Figure 3. Generalized Force Displacement Characteristic of Frame element
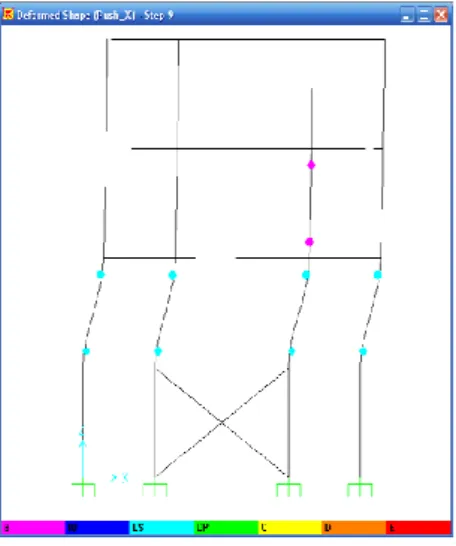
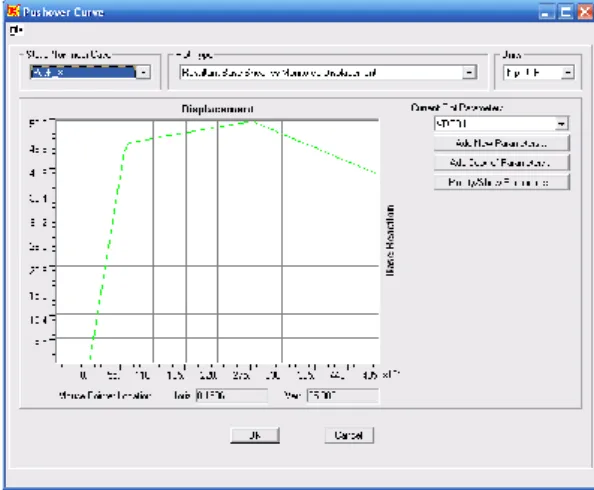
In SAP2000 a frame is drawn as a line element having elastic properties and nonlinear force displacement properties of individual frame elements are assigned (Computers and Structures Inc, 2000). The braced and unbraced frames are shown in Fig. 4 and Fig. 5. The pushover curves for the braced and unbraced frame are shown in Fig. 6 and Fig. 8 respectively.
Figure 4. Formation of Hinges for Unbraced Figure 5. Formation of Hinges for braced Structure
In the above figure, Point A shows to unloaded states and point B shows yielding of the element. The ordinate at C corresponds to optimum strength & on x-axis at C it shows the deformation at which significant decrease in strength starts. The line from C to D shows the starting failure of the component/element. The resistance from D to E shows that the frame elements sustain only gravity loads. After point E the maximum deformation occurs. Gravity loads are no more sustained.
Figure 6. Pushover curve of Unbraced Structure Figure 7. ATC 40 Response Spectrum capacity
For Unbraced Structure
Figure 8. Pushover curve of braced Structure Figure 9. ATC 40 Response Spectrum Capacity
For Braced Structure
There are 3 types of hinges in SAP2000 (Edward L Wilson, 2000). They are default hinges, generated hinges & user defined hinges as shown in Fig. 4 and Fig. 5. Only user defined hinges & default hinges should be assigned to the frame elements or components. When the said hinge properties (user defined or default) are assigned to a frame element/components, the program creates automatically generated hinge properties. Default hinge properties of the frame elements could not be changed & it depends on the section. The default hinge properties which are assigned to the frame elements for steel and
concrete members are on the basis of ATC-40 for braced and unbraced frame as shown in Fig. 7 and Fig. 9 & FEMA-273 criteria.
4. LIMITATIONS OF PUSHOVER ANALYSIS
In pushover analysis approach the target displacement for a MDOFS is usually estimated in terms of displacement demands in correspondence with the equivalent SDOFS.
Lateral loads show the distribution of forces due to inertia imposed on the building during an earthquake. The distribution of forces due to inertia varies with the extremity of Earthquake & with the increasing time during earthquake. Commonly used lateral force patterns are uniform, elastic first mode, “code" distributions and a single concentrated horizontal force at the top of structure. Multi-modal load pattern derived from Square Root of Sum of Squares (SRSS) story shears is also used to consider at least elastic higher mode effects for long period structures. These loading patterns usually favor certain deformation modes that are triggered by the load pattern and miss others that are initiated and propagated by the ground motion and inelastic dynamic response characteristics of the structure.
The invariant load patterns cannot account for the redistribution of inertia forces due to progressive yielding and resulting changes in dynamic properties of the structure. Also, fixed load patterns have limited capability to predict higher mode effects in post-elastic range. The underlying approach of this technique is to redistribute the lateral load shape with the extent of inelastic deformations.
5. CONCLUSION
In this research paper seismic evaluation of already existing buildings is carried out based using ASCE 31-03 provisions in order to understand the procedure in insight. ASCE 31-03 is based in 3 tiers of increasing performance detail and reducing conservativism for safety. Prior to the evaluation of Tier 1 the performance level desired (Life Safety or Immediate Occupancy) the seismicity region (low, moderate and/or high) & the structure type is evaluated. Detailed nonlinear static (pushover) is performed. The time history analysis is considered to be the most accurate method to evaluate the force & deformation demand at various frame elements/components of the building. However time history analysis is limited for its use because dynamic behavior is very sensitive to modeling and characteristics of ground motion. Inelastic static analysis or pushover analysis is recommended method for evaluating seismic performance because of its simplicity.
REFERENCES
ASCE SEI/ASCE 7-05. (2005). Minimum Design Loads for Building and Other Structures, American Society of
Civil Engineers, Reston, VA.
BCP. (2007). Seismic Provision for Building Code of Pakistan. Ministry of Housing and Works Government of
Pakistan Islamabad.
Bhatti A.Q, Hassan SZ, Rafi Z, Khatoon Z, Ali Q. (2011a). Seismic Hazard Analysis of Islamabad Pakistan.
Journal of Asian Earth Sciences. 42:3,468-478
Bhatti A.Q, Kishi N. and Tan KH. (2011b). Impact resistant behaviour of an RC slab strengthened with FRP sheet. Material and Structures. 44:10:1855-1864
Computers and Structures Inc. (CSI). (1998). SAP2000 Three Dimensional Static and Dynamic Finite Element Analysis and Design of Structures V7.40N. Berkeley, California.
Computers and Structures Inc CSI. (1995). ETABS Extended Three Dimensional Analysis of Building Systems Non linear Version 9.5. Berkeley, California USA
Edward L Wilson. (2000). Three Dimensional Static and Dynamic analysis of Structures” 3rd Edition.
Computers and Structures, Inc. Berkeley, California, USA
NESPAK. (2006). Revision/Updation of Building Code of Pakistan, Stage 1, Recommendations for preliminary seismic design parameters and criteria for seismic resistant design of buildings in Islamabad – Rawalpindi area. Ministry of Housing and Works, Government of Pakistan National Engineering Services Pakistan