Mergers & Acquisitions
The case of LVMH and BVLGARI
Mergers & Acquisitions
The case of LVMH and BVLGARI
Tânia Rafaela da Silva Farinha
September 2012
Abstract
LVMH Moët Hennessy - Louis Vuitton, the biggest player on the luxury industry, has announced on March 2011 a further step on its consolidation strategy. LVMH announced the acquisition of Bulgari, a company owned majorly by the Bulgari family.
This thesis aims to analyse the value creation potential of this acquisition. The data of the valuation exercise is prior to the acquisition, aiming to understand the deal from an ex-ante point of view.
The valuation exercise is based on the valuation literature and on the analysis of the luxury industry players, structure, profitability and expected growth.
Bulgari, pre-deal, is considered to be overvalued. The company is failing to keep up with the high growth rate of the luxury industry.
The synergies are estimated at 96% of the company’s pre-deal estimated price and around 60% of its market capitalization.
Acknowledgments
I would like to express my gratitude to Professor Peter Tsvetkov for his support during this thesis process. I would also like to express my gratitude to all the professors teaching the MIF program. I’m particularly grateful to Professor Guilherme Almeida e Brito and to Professor José Tudela Martins, as my interest on the valuation topic was vastly motivated by their lectures.
I would also like to express my gratitude to my family and friends; particularly to my mother, for having provided me the opportunity to study and making that a priority on her life.
Table of contents
1. INTRODUCTION ... 6
2. LITERTURE REVIEW... 7
2.1. Company Valuation ... 7
2.1.1. Discounted Cash Flow valuation – Equity ... 7
2.1.2. Discounted Cash Flow valuation - All firm ... 9
2.1.3. Discount rates ... 13
2.1.4. Terminal value... 18
2.1.5. Cross border specifications on valuation ... 19
2.1.6. Relative Valuation ... 20
2.2. Mergers & Acquisition ... 22
2.2.1. Arguments for a merger ... 22
2.2.3. Value creation ... 24
2.2.4. Type of synergies and their ability to create value ... 25
2.2.5. Who benefits from value creation ... 26
2.2.6. Motivation and barriers for cross border deals ... 27
2.2.7. M&A market and trends ... 28
3. COMPANY AND INDUSTRY ANALYSIS ... 30
3.1. Company profiles ... 30 3.1.1. Bulgari ... 30 3.1.1. LVMH ... 33 3.2. Sector Overview ... 38 4. STANDALONE VALUATION ... 46 4.1. Bulgari ... 46 4.1.1. DCF ... 46 4.1.2. WACC ... 54 4.1.3. Multiples... 56 4.2. LVMH ... 57 4.2.1. DCF ... 57 4.2.2. WACC ... 62 4.2.3. Multiples... 63
4.2. Sensitive analysis ... 65
4.2.1. Bulgari ... 65
4.3.2. LVMH ... 66
5. VALUATION OF THE MERGED ENTITY ... 67
5.1. Valuation of the merged entity without synergies ... 67
5.2. Valuation of the merged entity with synergies ... 69
5.2.1. Operating Synergies ... 69
5.2.2. Financial Synergies ... 76
5.2.3. The Value of Synergies ... 77
6. THE DEAL ... 80
6.1. Target price ... 80
6.2. Financing Cash vs. stock ... 81
6.3. The offer ... 82
7. CONCLUSION ... 83
8. APPENDICES ... 84
Appendix 1: Bulgari WACC calculation ... 84
Appendix 2: Pan-European WACC calculation ... 84
Appendix 3: LVMH beta per segment ... 84
Appendix 4: LVMH WACC calculation ... 85
Appendix 5: WACC calculation for the merged entity without synergies ... 85
Appendix 8: Bulgari Income statement (Standalone valuation) ... 87
Appendix 9: Bulgari Cash flow analysis (Standalone valuation) ... 87
Appendix 10: Merged entity Income statement (without synergies) ... 88
Appendix 11: Merged entity Cash flow analysis (without synergies) ... 88
Appendix 12: Merged entity Income statement (with synergies) ... 89
Appendix 13: Merged entity Cash flow analysis (with synergies) ... 89
1.
INTRODUCTION
In the Luxury Industry, a trend of consolidation is observed over the last years.
The purpose, here, is to evaluate one of the major M&A deals in the luxury industry – the acquisition of Bulgari by LVMH. The deal is considered, however, small for LMVH.
It starts by the literature review, describing valuation methods, while focusing on the methods that will be, latter, applied on the valuation exercise. The literature review provides the theoretical framework that supports the valuation process. It begins with the Valuation literature, followed by the Mergers and Acquisitions literature review.
A description of each company is made, subsequently the luxury industry is described and analysed. Both companies are then, individually, valued. Afterwards, the valuation of the consolidated entity is carried out, with particular emphasis on the synergies potential.
2.
LITERTURE REVIEW
2.1. Company Valuation
The objective of this thesis is to evaluate the acquisition of Bulgari by LVMH Moët Hennessy - Louis Vuitton. The valuation will be made from an ex ante perspective.
The focus of the exercise is, mainly, the value created by the merger deal and its distribution between acquire shareholders and target shareholders.
The acquisition deal will be assessed through the valuation of three entities: acquire, target and consolidated (with and without the potential synergies). The valuation exercise must be supported by a prior review of the academic literature on the valuation topic. Secondly, a review of the Mergers & Acquisitions literature provides the theoretical framework to the valuation of the merged entity and its specific topics (e.g. synergies).
2.1.1. Discounted Cash Flow valuation – Equity
The value of an asset is its future expected cash flows, discounted at an appropriate discount rate, reflecting the opportunity cost. Following the same rationale, the value of a firm is the value of its expected future cash flows discounted at an appropriate discount rate.
As such, the valuation exercise will be done via the discount of the future expected cash flows. The exercise will be, then, complemented with the Relative valuation.
The DFC valuation can be done via numerous methods. Fernandez (2009) presents ten methods to compute it based on nine theories, ranging from Modigliani & Miller and Harris & Pringle to Damodaran and practitioners’ models. In essence, it’s the cash flow and the discount rate that change. The Discounted Cash Flow methods can be synthesized in three major groups: equity valuation, company valuation (whole firm) and Adjusted Present Value (Damodaran 2002).
Equity valuation is made either through the estimation of the present value of future expected Free Cash Flows to the Equity, either through the estimation of the Present
value of the future expected dividend payments. Despite of the cash flow applied, whether FCFE or Dividend, the proper discounted rate is the cost of levered equity.
Free Cash Flows fro the Equity (FCFE)
The FCFE can be defined as the cash flow available, after conforming with all the obligations, to be distributed to shareholders.
(2.1) Free Cash Flow for the Equity = Net Income – (Capital Expenditures – Depreciation) – (Change in noncash working capital) + (New debt issued – Debt repayments)
(2.2) Value = FCFE1 / (Ke – g)
FCFE1 = Free Cash Flow to Equity next year
Ke = Cost of equity (levered)
g = Growth rate in dividends forever
It’s appropriate to use FCFE Model when the firm doesn’t pay dividends or these are considerably different from the FCFE.
Dividend Discount Model (DDM)
The Dividend Discount Model defines the equity price as the discounted value of the future expected stream of dividends to be received on the shares (perpetually).
(2.3) Value of Stock = DPS1 / (Ke – g)
DPS1 = Expected Dividend next year
Ke = Cost of equity (levered)
g = Growth rate in dividends forever
The model is “extremely sensitive” to the growth rate. A small change on the latter has an enormous impact on the value of the stock (Damodaran 2002). In addition, the author recommends the DDM valuation to be limited to:
- Firms having a growth rate less, or equal, to the nominal growth of the economy;
- Firms which have, and are expected to maintain, a stable dividend payout policy.
Berk and Demarzo (2007) also stress the sensitiveness of DDM model to the growth rate. Furthermore, attention is drawn to the “tremendous amount of uncertainty” on the estimation of future dividends, as this means forecasting the dividend payout rate, number of shares (in the future) and firm’s earnings. Earnings depend on interest expense, which will depend on the debt; dividend payout rate and the number of shares will depend if the firm uses its earnings to repurchase its shares.
2.1.2. Discounted Cash Flow valuation - All firm
To evaluate the entire firm (i.e. equity plus debt), the appropriate cash flow is the Free Cash Flow for the Firm. The FCFF represents all the cash flow available to all claimholders.
(2.4) Free cash flow for the firm = EBIT (1-Tax rate) + Depreciation - Capital Expenditures - Variations in Net working Capital
The tax rate above mentioned is the company’s marginal tax rate (DePamphilis 2011). The FCFF is then discounted at a rate reflecting the opportunity cost of the invested amount. The opportunity cost reflects both the time value of money and the risk of the investment.
There are two alternative ways of estimating the value of the company. The WACC takes the FCFF and discounts it at the weighted average cost of capital. The APV discounts FCFF at an unlevered cost of equity and then the value created by the financial decision is added.
2.1.2.1. WACC
WACC method discounts the expected free cash flows for the firm at a weighted average cost of capital. The weighted average of capital is both a weighted average of cost and a return (Fernandez 2010). WACC can be seen as the cost of capital or as the
required return on the firm’s total capital. In practice, WACC is the average of the cost of equity (weighted by the proportion of equity on the capital structure at market value) and the cost of debt (weighted by the proportion of debt on the capital structure at market value). It’s computed as follows:
(2.5) WACC = (E / V) * Re + (D / V) * Rd * (1 – Tc)
E/V = % of capital accounted by Equity, on the firm’s total capital, at market value D/V= % of capital accounted by Debt, on the firm’s total capital, at market value Re = Cost of equity
Rd = Cost of Debt Tc = Corporate tax rate
V = Market value of the company (sum of equity and debt)
WACC assumes that the structure of capital can add value to the firm. Modigliani and Miller proposition I states that under a perfect market (with no taxes), the value of the firm isn’t affected by its capital structure. However in a taxed world, the interest paid on the debt increases the tax deductible costs of the firm, thus allowing a lower taxation.
Hence, WACC considers that the financing and investment decisions are interrelated. The decision of how to finance, will impact the tax savings that can be achieved on the investment. This impact is materialized in WACC via a lower cost of debt, which generates a lower discount rate (WACC).
The WACC requires the capital structure of the company to remain stable (Brealey at al. 2008), otherwise the weights of debt and equity will change. Hence, the company is required to rebalance its structure, continuously, to maintain the debt and equity ratios constant (in market values). In practice, this isn’t workable.
For a company, which isn’t expected to shift its capital structure significantly, it’s enough to assume a capital structure, stable in the long run, achieved using gradual but constant adjustments. For a company expected to change its structure materially, APV is more appropriated.
Copeland et al (2002) proposed a three steps methodology for the WACC exercise (Figure 1):
Figure 1: WACC methodology
2.1.2.2. APV
APV results from the sum of two cash flows: the present value of the investment decision effect and the Present value of the financing decision (Miles and Ezzell 1980).
The APV formula is the following (Berk and Demarzo 2007):
(2.6) APV = VU + PV (Interest Tax Sh Issuance Costs)
APV = Value of the levered firm
VU = Value of unlevered firm (the value of the firm without debt, also referred as base case)
In practice, the firm is, firstly, valued as if financed exclusively
value added by the financing decision is estimated (e.g. interest tax shield, subsidized loan), allowing to understand the value added by each component to the firm. The APV method appears also as a solution for the WACC capital struc
above described.
Damodaran (2002) defines a three steps process in the APV method
Figure 2: APV methodology Figure 1: WACC methodology
from the sum of two cash flows: the present value of the investment decision effect and the Present value of the financing decision (Miles and Ezzell 1980).
The APV formula is the following (Berk and Demarzo 2007):
+ PV (Interest Tax Shield) – PV(Financial distress, Agency
APV = Value of the levered firm
= Value of unlevered firm (the value of the firm without debt, also referred as base
In practice, the firm is, firstly, valued as if financed exclusively by equity. Then, the value added by the financing decision is estimated (e.g. interest tax shield, subsidized loan), allowing to understand the value added by each component to the firm. The APV method appears also as a solution for the WACC capital structure change limitation
Damodaran (2002) defines a three steps process in the APV method (Figure 2)
Figure 2: APV methodology
from the sum of two cash flows: the present value of the investment decision effect and the Present value of the financing decision (Miles and Ezzell 1980).
PV(Financial distress, Agency and
= Value of unlevered firm (the value of the firm without debt, also referred as
base-by equity. Then, the value added by the financing decision is estimated (e.g. interest tax shield, subsidized loan), allowing to understand the value added by each component to the firm. The APV ture change limitation
The value of the firm base case is computed, by discounting the Cash flows at the opportunity cost of capital (unlevered cost of equity). The unlevered cost of equity can be defined as the opportunity cost for an investor to invest on a similar, but entirely equity financed, company.
The inputs of the tax savings valuation are the debt interest rate and the corporate tax rate (marginal tax rate). The tax savings are usually discounted at the debt discount rate, implying that the debt interest has the same risk as the tax savings.
The inputs of expected Bankruptcy cost present value are: probability of bankruptcy and bankruptcy costs. The probability of bankruptcy can be extrapolated from the default probability associated to a determined bond. The PV of bankruptcy cost includes both direct costs (e.g. lawyer fees, trustees’ fees) and indirect costs (e.g. profit not incurred).
2.1.2.3. APV vs. WACC
Luerman (1997) considers WACC, the rule method for valuation in the past, as being currently “obsolete” and surpassed by APV. The author’s arguments are that:
- APV works always when WACC does and also when it doesn’t;
- WACC is more propitious to incur on major errors than APV;
- The information provided by APV to the valuation allows understanding the contribution of each component to the overall value (being this major advantage of the method).
Froot (1997) denotes specific cases where WACC isn’t reliable, namely: capital structures that are expected to change, subsidized or local financing available, particular benefits or costs associated with financing exist, concluding that in these cases, APV should be used.
Meyers (1974) when presenting the APV also highlighted the information provided by the model as “perhaps the greatest advantage of APV”, allowing to guide manager towards the different decisions comprised on the project (e.g. subsidized loan, borrow versus lease and lease versus buy decisions).
Ciccola and Pecatti (2003) seem to be in accordance as they consider APV a method of higher performance when valuing a leveraged investment, but admit that, in practice; it
is WACC the most commonly used method. The survey carried out by Harvey and Graham (2001) shows that only 10.78% of CEO uses always or almost always APV technique when deciding which project or acquisition to take whereas 75.7% states that use always or almost always NPV when taking that decision. The survey includes other techniques such as: APV, Internal Rate of Return, Net present Value, Real options, among others. Summing up, the literature seems to consider APV as superior. Nonetheless, evidence is found that in practice; APV is still not that widespread, being the use of WACC more conventional
For a firm having an optimal or target debt ratio, the APV adds little if anything to WACC valuation (Booth, 2007).
Sabal (2010) argues that for practical purposes, whenever the debt ratio is stable on the long term, WACC might be a good approximation. Moreover, the author stresses an important advantage of WACC vis-à-vis APV. If the firm aims to have a stable ratio of debt, then the amount of debt will change depending of the value of the firm (to make the ratio constant), WACC by taking in consideration only the ratio, will automatically resolve this issue.
Copeland et al. (2002) stresses that if both are done correctly and with the same underlying assumptions, they would yield the same valuation values.
Because WACC is the most conventional method and because this valuation doesn’t fall on any of the cases where APV is found to have a superior insight, WACC will be used on this valuation exercise.
2.1.3. Discount rates
The above described valuation methods are made via the discount of the described cash flows at the proper discount rate. For the three methods, the necessary discount rates are: cost of levered equity (DDM, FCFE and WACC), cost of unlevered equity (APV), and cost of debt (WACC and APV).
2.1.3.1. Cost of equity
There are two methods to estimate the cost of equity: CAPM and APT. The three factor model, a variation of APT, will also be presented.
Capital pricing Asset Model (CAPM)
CAPM grounds on the basis that the security expected risk premium is proportional to the beta of the stock. The beta is the measure of the relation between the stock return and the market’s return.
(2.7) Ke = rf + β (rm - rf)
Ke = Cost of equity Rf = Risk-free rate
β = Beta
Rm = Market risk
The two main ideas of the model are that investors require extra return for risk exposure and they are, particularly concerned, with the risk that can’t be cancelled by the risk of the portfolio, the specific risk. The model, also, assumes that the investors borrowing and lending activity is done at the same interest rate and that US treasury bills are risk free. These aren’t exactly true as treasury bills do not provide protection against inflation risk and borrowing interest rate is, usually, above lending interest rate (Brealey et al. 2008).
CAPM Parameters
The risk free rate can be defined as the expected return of a riskless asset. Hence, this asset provides a secure known return. According to Damodaran (2008), the risk free asset is distinguished by an expected return that has no variance, being its real return equal to its expected return.
The author point outs that, to be considered risk free, an asset must meet two conditions: there can be no default risk and no reinvestment risk.
This excludes, in this order, other than government bonds and coupon-paying bonds. The government bonds interest rates although protected against default risk, do not have, generally, protection against inflation, and are, hence, nominal rates. In order to have the real rate, inflation must be deducted from the Government interest rate. The exception, Inflation-Linked Bonds aren’t usually issued in high inflation countries (i.e. Emerging markets) were the use of nominal risk free rates is more problematic. Still, under the principle of free flow of capital, the USD risk free rate can be used in any market. If the latest isn’t applied, then the real return is the real growth of economy.
As per the maturity of the government bond, Damodaran recommen
coupon bond. Copeland et al. (2000) agree on this maturity based on the following arguments:
- A 10-year rate, typically, matches the duratio
- A 10-year rate, approximates the duration of the market portfol hence it will be consistent with the other market portfolio parameters
- A 10-year rate is less prone than to have inflation problems and its liquidity premium may also be inferior (as compared to a longer maturity rate); these two
negligible, also play in favour
Both LMVH and Bulgari have EUR cash flows (or translated to EUR if they are in other currency), hence an EURO
the French 10- year coupon bond interest rate will be used as the proxy for the risk free rate. Bulgari is an Italian company. If we use Italy
the risk free rate will be overvalued because Italy is facing sovereign debt issues and the company, from a sales perspective can be viewed as a pan
Hence, to overcome this issue and average of the EUR rate will be used.
The beta can be defined as
sensitiveness of the stock to the market portfolio (or other benchmark). Kaplan and Ruback (1996) have tested the accuracy of three different betas (company, industry and market) in estimating the transaction value: company equity betas, unlevered industry equity betas and market betas (market
technique (i.e. consists of discounting capital cash flows at the unlevered cost of equity). Their findings indicate that the median and m
market beta are closer to zero than the results of both firm and industry beta. This, in practice means, that by using market beta the estimated transaction value will be more accurate.
(2.8)
= Beta of asset i = Covariance of asset
= Variance of the market portfolio
As per the maturity of the government bond, Damodaran recommen
coupon bond. Copeland et al. (2000) agree on this maturity based on the following
year rate, typically, matches the duration of the cash flows in question;
year rate, approximates the duration of the market portfolio (e.g. S&P 500) and hence it will be consistent with the other market portfolio parameters;
year rate is less prone than to have inflation problems and its liquidity premium may also be inferior (as compared to a longer maturity rate); these two
favour of a 10-year rate.
Both LMVH and Bulgari have EUR cash flows (or translated to EUR if they are in other currency), hence an EURO-bond will be used. As France has a low
coupon bond interest rate will be used as the proxy for the risk free Bulgari is an Italian company. If we use Italy 10- year coupon bond interest rate, the risk free rate will be overvalued because Italy is facing sovereign debt issues and any, from a sales perspective can be viewed as a pan-European company. Hence, to overcome this issue and average of the EUR 10- year coupon bond interest
can be defined as a measure of the systematic risk. It measures the tiveness of the stock to the market portfolio (or other benchmark). Kaplan and Ruback (1996) have tested the accuracy of three different betas (company, industry and market) in estimating the transaction value: company equity betas, unlevered industry ity betas and market betas (market-based measure) through their compressed APV technique (i.e. consists of discounting capital cash flows at the unlevered cost of equity). Their findings indicate that the median and mean of the valuation errors of eta are closer to zero than the results of both firm and industry beta. This, in practice means, that by using market beta the estimated transaction value will be more
nce of asset i with market portfolio = Variance of the market portfolio
As per the maturity of the government bond, Damodaran recommends a 10- year coupon bond. Copeland et al. (2000) agree on this maturity based on the following
n of the cash flows in question;
io (e.g. S&P 500) and
year rate is less prone than to have inflation problems and its liquidity premium may also be inferior (as compared to a longer maturity rate); these two issues, even if
Both LMVH and Bulgari have EUR cash flows (or translated to EUR if they are in a low interest rate, coupon bond interest rate will be used as the proxy for the risk free year coupon bond interest rate, the risk free rate will be overvalued because Italy is facing sovereign debt issues and European company. year coupon bond interest
a measure of the systematic risk. It measures the tiveness of the stock to the market portfolio (or other benchmark). Kaplan and Ruback (1996) have tested the accuracy of three different betas (company, industry and market) in estimating the transaction value: company equity betas, unlevered industry based measure) through their compressed APV technique (i.e. consists of discounting capital cash flows at the unlevered cost of ean of the valuation errors of eta are closer to zero than the results of both firm and industry beta. This, in practice means, that by using market beta the estimated transaction value will be more
The risk premium is the return above the risk free rate expected by investors to compensate them for the incurred risk (Berk and Demarzo 2007). There are two alternative approaches to estimate it: based on historical risk premium, under the assumption that the future will be similar to the past or forward looking. Both have supporters and opponents (Copeland et al. 2000).
Arbitrage Pricing Theory (APT)
The arbitrage pricing theory was proposed by Ross, formally in 1976. It was presented as an alternative method to the mean average CAPM model developed by Treynor, Sharpe and Litner (Ross 1976). It lies on the idea that the expected stock return depends on the stock sensibility to several factors. The idea of the model is that there are two types of risk: specific to the security that can be diversified and hence doesn’t restrict the investors’ choice and the market risk that can’t be diversified.
In APT the factors are macroeconomic. However, the models don’t pre-define any factors, these must be chosen in particularly for each security, their risk premiums must be estimated and finally it’s necessary to measure the sensitivity of the sock to the macroeconomic factors.
(2.9) Expected risk premium = stock sensitivity to the factor 1 * risk premium of factor 1 + stock sensitivity to the factor 2 * risk premium of factor 2 + …
The vital argument of the theory is that the same market risk must be rewarded with the same expected return otherwise there would be room for arbitrage.
Fama and French (1992) tested the relation between stocks average returns and several variables, concluding that the book-to-market equity variable is superior in explaining the average returns behaviour. The variable showed reliable in both the sub-periods studied (from 1963 to 1976 and from 1977 to 1990) with a positive premium (the regression average slope for the period 1963-1990 was 0.35).
Additionally, evidence was found that the variables size also explains the stock’s average returns with a negative premium (the regression average slope for the period 1963-1990 was -0.11) even if less expressively than the variable book-to-market equity. In a subsequent study (1993), the authors, structured the two above risk factors with a market factor, creating the Three factor Model.
CAPM vs. APT
The CAPM can be seen as a particular case of APT where there is unique risk factor, the market. The CAPM is advantageous as it has a unique, pre-defined, risk factor. However, Paavola (2006) arguments that despite being simpler to compute than APT, CAPM will logically underperform APT in a statistical sense. The rationale behind this is that:
- APT has more variables to explain the returns, hence the R2 has to improve (goodness
of fit of the regression);
- APT factor is estimated to best fit data; naturally it yields a higher explanatory power.
In addition, the author argues that the lack of identification of the factors as the most disappointing aspect of APT model.
APT factors depend of the economic condition, being particular, to each country, making the model less used, even if more efficient that CAPM (Homsud et al. 2009). Here, the CAPM will be used.
2.1.3.2. Cost of unlevered equity
The cost of unlevered equity is the cost of equity for a firm all-equity financed.
(2.10) Ku = rf + βu (rm-rf)
Ku = Cost of unlevered equity Rf = Risk-free rate
Bu = Unlevered Beta Rm = Market risk
The unlevered beta can be estimated through the following equation:
(2.11) βA = βD * (D/V) + βE (E/V)
βA = Asset beta (i.e. the same as equity beta for the unlevered firm)
Luehrman (1997) proposes the use of the cost of equity of a similar company without debt.
2.1.3.3. Cost of debt
The cost of debt represents the cost incurred by the firm to borrow funds (to finance investments). If it’s an investment graded company, the risk of default is low and the cost of debt can be inferred via the Yield-to-Maturity (Copeland et al 2000).
In the case were the company has bonds outstanding but not regularly traded, the debt cost can be inferred through the rating and the associated default spread (Damodaran 2002).
2.1.4. Terminal value
In practice, one can’t forecast the earnings forever; the earnings are estimated for three or five years. For the rest of the timeline, two methods are used. The first method is to compute the liquidation value of the assets at the end of the forecasted period.
Alternatively, the company is assumed to grow at a constant growth rate is (usually it will be near the economy growth rate) and value is estimated (assuming a going concern). In this case, the terminal value is computed as follows (Bruner 2004):
(2.12) Terminal value = [CF * (1 + g)]/(K - g∞)
CF = Cash flow of the final year of the financial forecast K = cost of capital
g∞ = compounded average growth rate of the cash flows to infinite.
The author presents two alternatives for g estimation (2.13 and 2.14).
(2.13) g = ROE * (1 – DPO)
ROE = Return on Equity DPO = Dividend payout ratio
The underlying idea is that the company’s growth is limited to its equity return less the dividends distributed.
(2.14) g∞Nominal = [(1 + g∞Units)*(1 + g∞Inflation)] – 1
g Nominal = Nominal growth rate g Inflation = Rate of inflation g Units = “real” rate of growth.
The above is rooted on the economics vision of growth, as per which the real growth rate adjusted to inflation will yield the nominal growth rate of the business.
Long term growth rates exceeding the expected real growth rate of GDP are to be faced apprehensively (Berk and Demarzo 2007).
Young et al. (1999) highlighted the impact of the terminal value on the overall valuation (terminal value in addition to specific forecast). Through a theoretical sensitive analyses, the authors determined that the terminal value contributes 75% to the market value of the company, in the case of forecasts made for ten years (usually, they are made for three or five years) and a cost of capital of 8%.
2.1.5. Cross border specifications on valuation
Froot (1997) brings attention to particular aspects of the cross border deals. The author distinguishes them in aspects pertinent to WACC and aspects pertinent to APV method. As this valuation will be done via WACC and since both the acquiring and the target express their results in EUR, currency issues as well as APV specifications won’t be handled here.
Taxes
There are two forms of accounting taxes in cross-border deals. In case of a worldwide “tax credit” system (on which the headquarters country is due to receive taxes on all the foreign income), it’s recommended the use of the higher of the corporate tax, even if conservative.
In case of a territorial “tax exemption system”, the headquarters country exempts the foreign source of paying taxes if these were already paid in the income source country (to not have a double taxation). Here, the foreign country’s corporate tax rate should be used.
Earned versus remitted cash flows
The cash flows returned on a foreign company investment may, or may not be forward to the foreign company (i.e. reinvestment). Still, the cash flows should be accounted. First, there’s still an ownership claim by the shareholders. Secondly, for the valuation in question, the income source country, Italy, is an industrialized nation, therefore there’s no risk of local blocking of funds transference.
Discount rate
The discount rate is the opportunity cost vis-à-vis other projects with similar risk and duration. Hence, the discount rate will depend of the investments opportunities of its investors (considered home-based for s simplicity purpose).
Beta
The Beta is expected to be lower if a global market portfolio is used as the country specific risks will be diversified. Here, Italy’s country risk is higher than France, however the company has its sales well geographically diversified, hence it isn’t extensively exposed to its country risk.
2.1.6. Relative Valuation
The widespread utilization of the multiples is explained by their easiness to be computed, to be understood and to be explained (as opposed to the other valuation methods). Moreover, they incorporate the market atmosphere, reflecting higher prices if the shares are bull and lower if the shares are bear. Kaplan and Ruback (1996) support that both methods, comparables and discounted cash flows, should be applied in a complementary form. Multiples can be used for valuing equity (Price multiples) or they can be used to value the total value of the company (enterprise value multiples).
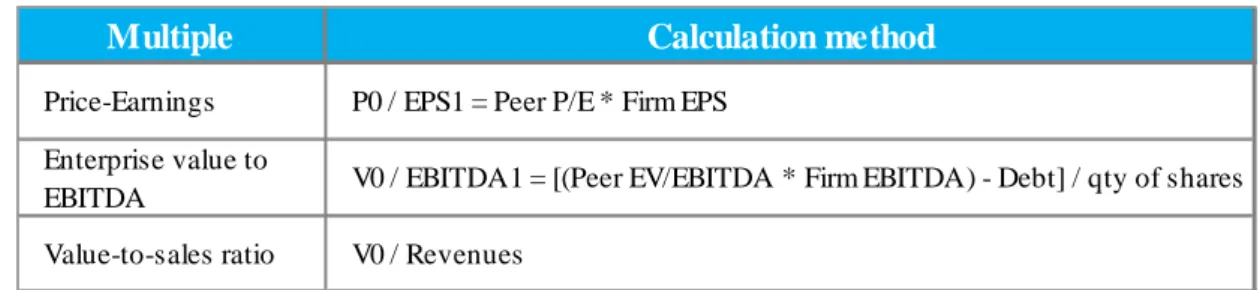
The below multiples will be calculated with goal of incorporating the atmosphere of the luxury industry on the valuation process (Figure 3).
Figure 3: Multiples calculation
The price-earnings multiple (ratio between price per share and earnings per share) is the most generally used and misused equity multiple (Damodaran 2002). Suozo et al. (2001) argue that it should be calculated with the adjusted earnings (before exceptional items and goodwill amortization). Several types of earnings per share can be used on the ratio which will, unsurprisingly, create an issue on the comparison exercise (Damodaran 2002).
Goedhart, Koller and Wessels (2005) confirm that the multiples improve the forecast of DCF Valuation parameters, increasing the accuracy of the DCF valuation itself. In addition, attention is drawn to particular matters that will improve the multiples application:
- Company peers must have similar scenarios of growth and Return on investment Capital, hence finding the industry competitors it’s just the starting point;
- The multiples ought to be forward looking, as research shows that these are more accurate than historical multiples in value estimation;
- The multiples should be enterprise-value, with the aim of becoming insensitive to the capital structure;
- The enterprise-value-to-EBITDA multiple should be amended for non-operating items (e.g. excess cash should be removed, non-operating assets are to be evaluated independently).
Liu (2000) confirm that forward earnings are superior in explaining stock price as opposed to historical earnings.
Multiple Calculation method
Price-Earnings P0 / EPS1 = Peer P/E * Firm EPS Enterprise value to
EBITDA V0 / EBITDA1 = [(Peer EV/EBITDA * Firm EBITDA) - Debt] / qty of shares
2.2. Mergers & Acquisition
A merger is a deal through which two or more firms combine into a single, independent firm (Colb and Rodriguez). It can take several forms. On a Merger, the target is incorporated on the acquiring firm, ceasing its existence.
A Consolidation is when the target and the acquirer will, both, cease and create a new combined entity. In a tender offer, the acquirer purchases a minor position; the target will continue to exist. At last, the acquiring company can purchase the assets of the target, which will remain in existence, however in due course the target will be ceased.
According to Bringhan and Gapenski (1996), mergers can be categorized in four economic types. Mergers are classified as horizontal when the target firm operates in the same business line as the acquiring firm.
They are defined as vertical if the target firm operates in the value chain as the acquiring firm (e.g. supplier, distributor). They are characterized as congeneric if the target and the acquiring firm are related, except that they do not share the business line and they do not have a value chain connection. At last, they are typified as conglomerate when the target firm and the acquiring firm do not relate.
2.2.1. Arguments for a merger
Mergers can create value, if their driver is something that will benefit the new consolidated entity. Kolb and Rodríguez (1996) presented three motivations that justify a merger.
Brealey, Myers and Allen (2008) present a more detailed list of reliable merger arguments; however, in essence, these fall in agreement with the previous ones (Figure 4).
Figure 4: Arguments for a merger
Valid Invalid
Economies of scale - access to cheaper row materials (or increase cost efficiency), makes sense on a horizontal merger
Diversification - void in terms of shareholder value as the investor can diversify if he wishes to do so
Access to new resources - the new entity will integrate a part of the production chain (e.g. distribution, sales force)
EPS increase - consolidated number of shares lower than the sum of the acquiring old shares with the target old shares - no value creation
Tax considerations - new entity can benefit from a tax-loss carried forward by the target entity, in order to decrease the tax to be paid on future income
Lower financing costs - Economies of scale in issuing new securities and the probability of financial distress decrease for a company that seeks tax shield benefit (ceteris paribus). Still the lower financing cost due to lower interest rate is made at the expense of higher guarantee from the stock holders (as both companies guarantee the debt of each other).
Source: Brealey, Myers and Allen (2008) and Kolb and Rodríguez (1996)
Goedhart, Koller and Wessels (2010) present five main strategies that underlie a successful acquisition by creating real value for the entity:
- Enhancement of performance of the acquired firm can be achieved via reduction of cost or revenue growth;
- Fusion aiming to remove surplus capacity from the market is more recurrent on mature companies;
- Hastened market access to acquired or acquirer products is the case when mature companies acquire small companies with innovative products and also when the two companies have different geographic presence;
- Underlying acquisition of skills faster or at lower prices than if developed in-house;
- Selection of winners to support the business development requires early investments on the business, to invest in several businesses, and to have the ability to develop them.
2.2.2. Payment: Cash vs. Securities
When the acquiring company is paying the deal via equity, it can do it either through cash balance; issuing new stock to get cash (capital increase) or it can offer stock to the target as the payment of the deal (Damodaran 2002). The determination of the means of payment is made based on three factors: cash availability, perceived value of the stock and tax considerations.
The cash consideration is quite straightforward; a company can use cash only if it has it. Concerning the perceived value of the stock, if the company perceives its stock as undervalued, it ill end by paying more for the deal that it wishes.
De La Bruslerie (2010) agrees, by referring that companies with high stock value are more likely to finance the deal via equity. The potential tax deferring on the capital gain of the shares received by the target shareholders can also play an important role of the payment means.
According to De La Bruslerie (2010) the means of payment can’t be evaluated separately from the premium paid to target. In his study, having as object a sample of European M&A from the 2000-2010 decade, the author concludes that cross border deals, competitive transaction and absolute size of target will support a cash deal.
2.2.3. Value creation
The price paid relative to the intrinsic value of the target (standalone value) and the degree of accomplished synergies are the value drivers - creation, maintenance or destruction (Stahl et al. 2005).
Bruner (2004) starts by defining the possible outcomes of the deal as value destruction (returns lower than required by investors), creation (returns above the required by investors) and preservation (returns required by investors).
The author then argues that M&A deals being, generally, labelled as a failure (as it creates not value but rather destroys it) happens because the studies incorporate not only the M&A contribution but also the other remaining factors that affect the firms performance. There is no accurate definition of what is M&A failure (i.e. a penny of share decline can be considered a failure) and the studies cover major big deals (i.e. more regulatory issues).
Subsequently, it concludes that target companies shareholders’ receive positive returns on M&A deals. The shareholders’ of the acquiring company have their value preserved (if not created) on 67% of the deals. The combined net value creation for acquiring and target shareholders is positive. The article also highlights some deal features that are likely to create market value for the acquiring firm shareholders, namely: acquiring interrelated businesses, merger of equals, target being private business, credible synergies or pay with cash, among others.
Sirower and Sahni (2006) denote that the market has, generally, a negative reaction to M&A deals. According to the authors, such a reaction is explained by the upfront full payment (as compared with other investments), by the expected performance improvements already reflected on the share price, by the investments necessary to make the synergy and, at last, because it’s expensive to handle an M&A deal that goes wrong. The authors developed a graphic model that shows the necessary combination of cost and synergies level that justify, for instance, a premium of 35% and an EBIT margin of 18%.
2.2.4. Type of synergies and their ability to create value
Synergy is the value creation of the entity that exceed the sum of value of the two entities individually and that can’t be achieved if the two entities don’t combine. It can be represented by the following condition:
V (combined entity) > V (Acquirer) + V (Target).
Damodaran (2005) classifies the different synergies as Operational or Financial and provides a comprehensive framework with regards to the valuation of these synergies. Operational synergies can assume the forms of economies of scale, pricing power, combination of functional strength and high growth in new / existing market.
These synergies are expected to be reflected in the performance of the company through the increase of operating income from the firms’ resources, growth or both. The Financial synergies, on the other hand, can take the forms of diversification (for private firms only), increase of debt capacity forms, tax benefit and combination of cash-slack with high-return project firms.
The valuation exercise is due to begin with an individual valuation of each firm. They should then, be valued as a combined entity without synergy effect and, finally, as a combined entity with synergy effect. The synergy effect will depend on the nature of the
synergy and will affect, at least, an input of the valuation process: cash flows, cost of capital, growth rate or growth period.
Fee and Thomas (2004) found, on their study on horizontal mergers, that the merging firms have positive abnormal returns at the merger announcement. On the same study, they also found that several subsamples of merging firms significantly increase their post-merger cash flows and decrease the cost of goods sold.
In the case of financial synergies, diversification synergy takes the form of increased debt capacity. Diversification, if it contributes to the decrease of variability of the cash flows, will increase the firm’s debt capacity, hence, creating value. The value created by the cash slack firm that acquires a firm with high value project is the value of the undertaken projects (which otherwise the target wouldn’t be able to implement). The tax benefit value is computed through the Present value of the tax reduction. At last, the debt capacity can add value through an increase of the debt capacity (admitting that the new entity will have decreased variability cash flows as compared with the former company) and / or diminished default risk.
Sirower and Sahni (2006) developed a matrix that aims to classify the target relatedness with acquiring in terms of business skills and market access with the final goal of assessing the potential. The scale of assessment ranges between same capabilities or market assess, better capabilities or market access and new capabilities or market assess. The goal is to provide insight for potential sources of value creation.
2.2.5. Who benefits from value creation
Value creation can be measured via two approaches. Forward looking method is based on the reaction of the market to the deal. The other method relies on post merger studies, aiming to assess the synergies gains.
The beneficiary of the value created by the merger depends of the contribution each provides to that synergy and it will also be determinate by the nature of the synergy (Damodaran 2005).
A cost synergy, based on target exclusive savings will benefit mostly the target itself. More general savings are expected to deliver value to the target. A growth synergy driven by acquiring specific skills will deliver a larger slice of value to the acquiring firm.
The value creation of an increased debt capacity is shared equally by both acquiring and target as there is no unique skill underlying it. The value created by a Cash Slack synergy will be captured mainly by the acquiring in an emerging economy; the target is more likely to receive its share in the context of a developed economy.
At last, the value created by the tax benefit can result from higher deductions or a lower tax rate, the strength brought into the synergy will determine who will get the biggest slice of value.
Damodaran (2005) points out that the acquiring paying more that the value of the synergies results in little or no value creation for itself. The author suggests that this overpayment of synergies is explained by a biased evaluation of the deal, managerial pride and also due to lack of synergy planning.
Christofferson et al. (2004) argues that when two companies merge, most of the shareholder value created is likely to go to the seller. In average, the buyer receives all the value created via premium payment of 10-35% of the target’s deal pre-announcement value.
2.2.6. Motivation and barriers for cross border deals
Cross Border deals represented 4% of the M&A deals in 2007. Zanner et al (2008) presented manifold reasons that drive the cross border deals (long and short term). Globalization is one of the Long term drivers. Firms have realized, in the search for scale, growth, and lower production costs that cross border expansion is more economical than countrywide expansion.
In the same scope, geographic diversification is key on the emerging markets firm growth strategy, as it allows to reduce expropriation risk and to diversify raw materials supply. In addition, there is a growing deregulation trend, in the direction of the free flow of capital and goods.
One of the short term drivers the authors presented was the high relative valuations. The authors argue that there is propensity for firms to be further acquisitive when their stock price is high, because high stock prices point toward growth and profit, facilitate the liquidity access and make P/E higher. However, with the last sub-prime and sovereign-debt crisis, the market capitalization of firms has been significantly damaged; hence there are doubts that this argument remains valid.
The Currency shifts / Cheap USD (as opposed to emerging markets currency appreciation) are also pointed as a short term driver. Sovereign wealth funds are also expected to acquire illiquid foreign assets, as this is consistent with the sovereign wealth funds long-term, geographic diversified strategy. The political implications of this strategy provoke that these sovereign wealth funds are likely to acquire minority or non-controlling stakes. The reduced competition from financial sponsors and from strategic domestic buyers, resulting from a difficult access to leverage, leaves more room for strategic buyers’ deals.
There are also encumbering reasons to cross border M&A activity. The above described short term catalyst, are likely, to dissipate. In addition, the protectionist sentiments of some countries in relation to foreign acquisitions of “national champions” or strategic industries are likely to block cross-border deals.
2.2.7. M&A market and trends
In 2010, around 7000 M&A deals were announced with a global value of $2.7 trillion (Cogman and Sivertsen 2011). The authors confirm that acquiring companies are more committed in capturing the value created then before.
The geographical trends on M&A activity are also highlighted. An increasing activity was noted on the Asia-pacific region. Latin America experienced its highest M&A activity. A general increase of cross-border activity took place as a result of major deals and small numerous deals. Other than these, an increase of activity was also perceive on the Private equity industry
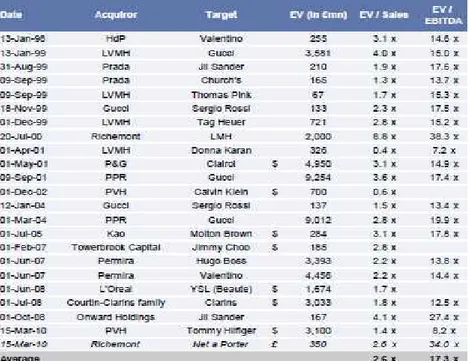
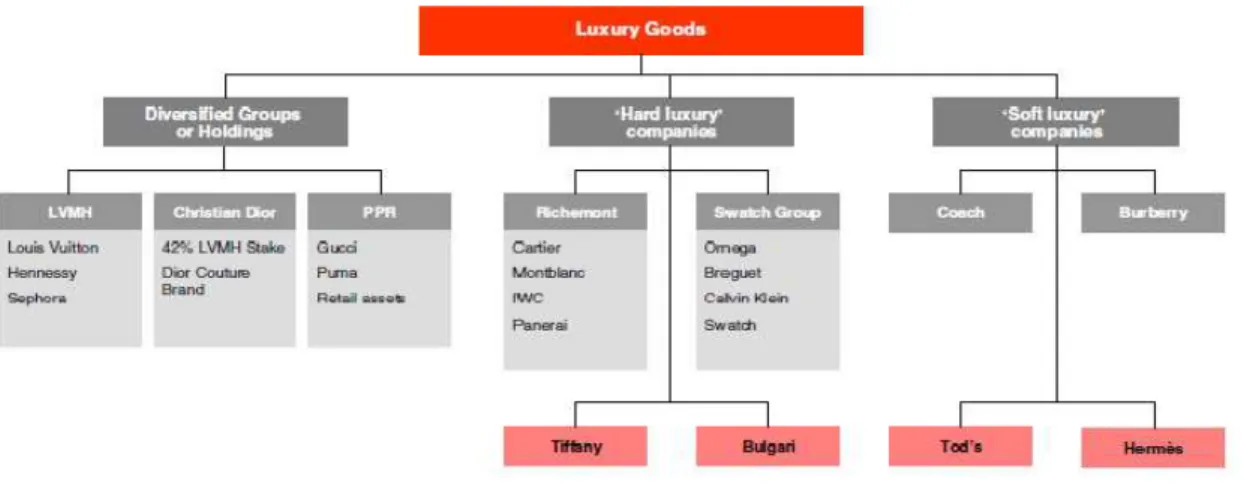
Concerning the M&A on the Luxury Goods Sector, the industry didn’t see many M&A activity. However, small acquisitions aiming the vertical integration are frequent. Bellow, a summary of the M&A deals on the luxury industry is presented (figure 5).
Figure 5: Acquisition on the Luxury goods sector
3.
COMPANY AND INDUSTRY ANALYSIS
3.1. Company profiles
3.1.1. Bulgari
Bulgari has annual revenue of EUR 1,069 million (2010 figures). The company is present on six business lines: Jewels, Watches, Perfumes, Skincare, Accessories and Hotels. The company, before the merger with LVMH, was 51% owned by the Bulgari family, being the rest of the stock floating.
Bulgari S.p.A. is the parent company; it manages the brand and coordinates the several areas (e.g. finance, human resources). The group has 41 companies (all under Bulgari brand name) in 21 countries and 3815 employees (2010). The distribution network consists of 295 stores, of which, 174 are owned by Bulgari (2010).
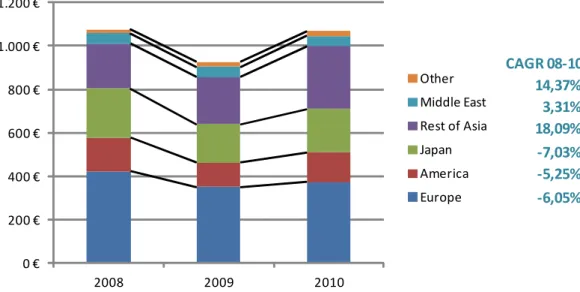
Figure 6: Bulgari Sales geographical breakdown (2008-2010)
Bulgari history started in the 19th century with the opening of the first store, focusing on precious silver objects. In the early 20th century, the brand developed an interest in precious stones, jewellery and watches under a renaissance style that conquered the jet set figures. In the 70’s the company had a significant international expansion. The first watch was launched in 1977.
CAGR 08-10 14,37% 3,31% 18,09% -7,03% -5,25% -6,05% 0 € 200 € 400 € 600 € 800 € 1.000 € 1.200 € 2008 2009 2010 Other Middle East Rest of Asia Japan America Europe
Latter, Bulgari founded a company to manage the conception and manufacturing of watches. In 1993, the company begins expanding its product portfolio, through luxury perfumes. The company went public in 1995. The textiles, eyewear and accessories were introduced and developed in the 90’s. The expansion into Hotels sector took place in 2004 with the opening of its first hotel in a partnership with Marriott. This last decade was marked by a vertical integration strategy, particularly in watches but also on leather goods.
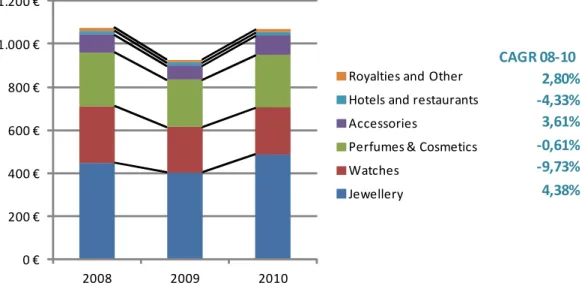
Figure 7: Bulgari Sales segment breakdown (2008-2010)
Costs
The company has a high cost of production due, partially, to its core segment. Hard luxury (i.e. watches and jewellery) is more costly than soft luxury (i.e. leather, fashion, accessories, and perfumes). For instance, hard luxury is subject to gold and silver price risks. The general and administrative costs are about 27% of sales and as per the press info the company is engaged in decreasing them. The company has made huge investments on vertical integration, which is expected to have a positive effect on the cost of production and on the general and administrative costs. Variable selling expenses are, per definition, dependent of the sales level. Personnel expenses has decreased and apparently the company profit from the current crisis to reorganize, it had 3847 employees in 2008 and it 3677 in 2010. Advertising & promotion expenses are around 10.2% of sales, but have been slightly cut in 2010. Like to LVMH, Bulgari is expected to bear high selling and marketing costs due to its high end positioning.
CAGR 08-10 2,80% -4,33% 3,61% -0,61% -9,73% 4,38% 0 € 200 € 400 € 600 € 800 € 1.000 € 1.200 € 2008 2009 2010
Royalties and Other Hotels and restaurants Accessories
Perfumes & Cosmetics Watches
Figure 8: Bulgari costs breakdown as % of sales Revenues (20
Jewels and Watches
Jewellery and watches represent
EUR 491.7 million. Bulgari is the third largest player on the company integrated Crova, one of its main suppliers in late 2003. production facilities in Italy
Since 2000, Bulgari has pursued a “verticalization” strategy on the watches division. The company has integrated several Suisse companies specialized in watch component manufacturing. As a result, the company is now able to manufacture its watch, which highly improved Bulgari exposure to the sector.
Perfumes and Skincare
Through Bulgari Parfums, Bulgari manages directly all the live of its perfumes: creation, production and distribution. In addition, the range of products includes bath and female skincare products.
Accessories
Bulgari produces a broad range of accessories: ties, scarves and stoles, bags in leather and prestigious fabrics, Sunglasses and eyeglasses (partnership with Luxottica), travel bags and suitcases for work and leisure. The product offering
writing instruments, key-rings and silver and leather goods, particularly focused on gifts.
Bulgari costs breakdown as % of sales Revenues (2010)
and watches represent the core segment of Bulgari, presenting net revenue of 491.7 million. Bulgari is the third largest player on the jewellery
company integrated Crova, one of its main suppliers in late 2003. Bulgari in Italy and Switzerland.
Bulgari has pursued a “verticalization” strategy on the watches division. The company has integrated several Suisse companies specialized in watch component manufacturing. As a result, the company is now able to manufacture its watch, which
d Bulgari exposure to the sector.
Through Bulgari Parfums, Bulgari manages directly all the live of its perfumes: creation, production and distribution. In addition, the range of products includes bath and female skincare products.
Bulgari produces a broad range of accessories: ties, scarves and stoles, bags in leather and prestigious fabrics, Sunglasses and eyeglasses (partnership with Luxottica), travel bags and suitcases for work and leisure. The product offering includes a range of rings and silver and leather goods, particularly focused on ri, presenting net revenue of jewellery sector. The Bulgari owns its
Bulgari has pursued a “verticalization” strategy on the watches division. The company has integrated several Suisse companies specialized in watch component manufacturing. As a result, the company is now able to manufacture its watch, which
Through Bulgari Parfums, Bulgari manages directly all the live of its perfumes: creation, production and distribution. In addition, the range of products includes bath
Bulgari produces a broad range of accessories: ties, scarves and stoles, bags in leather and prestigious fabrics, Sunglasses and eyeglasses (partnership with Luxottica), travel includes a range of rings and silver and leather goods, particularly focused on
The distribution of accessories is carried through a network of well stores, recently enhanced.
Hotels and Catering activ
The Bulgari Hotels & Resorts project was motivated by the brand visibility it provi A joint venture with the luxury d
entrance into this new sector. The first hotel unit was opened in 2004. Presentl
luxury unit in Milan, another in Bali. In Tokyo, Bulgari has a café and a restaurant. The London unit is expected to open in 2012 spring.
The company doesn’t disclose intra
3.1.1. LVMH
LVMH is the world largest luxury goods manufacturer, having presented revenues of $20 billion (2010). The company manages a portfolio of around sixty brands distributed over five product types. LVMH has more than 88,000 employees, 77% of which are based outside France (2010 figures). The group is majorly owned by Arnaud group
Figure 9: LVMH Capital Structure
LVMH has around 2500 stores, spread world
US and Asia (particularly in Japan), thus confirming the global character company.
The distribution of accessories is carried through a network of well-located exclusive
Hotels and Catering activities
The Bulgari Hotels & Resorts project was motivated by the brand visibility it provi A joint venture with the luxury division of Marriott International made easy the entrance into this new sector. The first hotel unit was opened in 2004. Presentl
luxury unit in Milan, another in Bali. In Tokyo, Bulgari has a café and a restaurant. The London unit is expected to open in 2012 spring.
The company doesn’t disclose intra-segment revenues or profits information.
world largest luxury goods manufacturer, having presented revenues of $20 billion (2010). The company manages a portfolio of around sixty brands distributed over five product types. LVMH has more than 88,000 employees, 77% of which are
(2010 figures). The group is majorly owned by Arnaud group
Capital Structure
round 2500 stores, spread worldwide, around 55% of which are located in US and Asia (particularly in Japan), thus confirming the global character
located exclusive
The Bulgari Hotels & Resorts project was motivated by the brand visibility it provides. ivision of Marriott International made easy the entrance into this new sector. The first hotel unit was opened in 2004. Presently, it has a luxury unit in Milan, another in Bali. In Tokyo, Bulgari has a café and a restaurant. The
segment revenues or profits information.
world largest luxury goods manufacturer, having presented revenues of $20 billion (2010). The company manages a portfolio of around sixty brands distributed over five product types. LVMH has more than 88,000 employees, 77% of which are
(2010 figures). The group is majorly owned by Arnaud group
wide, around 55% of which are located in US and Asia (particularly in Japan), thus confirming the global character of the
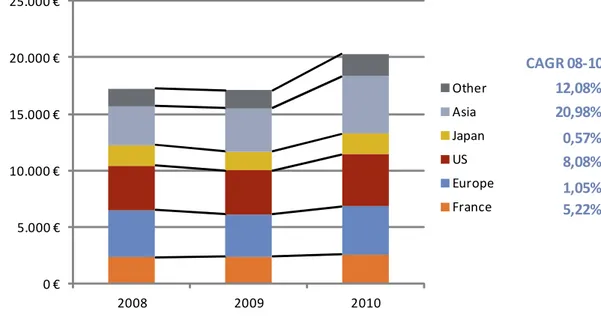
Figure 10: LVMH Sales geographical breakdown (2008-2010)
Louis Vuitton started with the store opening of high quality luggage artisan in 19th Century. Following a period of high growth (end of the 19th and beginning of 20th centuries), the company went public on the New York and Paris Stock Exchange in 1984.
Moet history begins in the middle of the 18th century with a producer and seller of wine. In 1971, Moet merged with James Hennessy, creating Hennessy. In 1987, Moët-Hennessy, (three times bigger than Louis Vuitton) merged with LV in a $4 billion deal.
The company made several acquisitions in the 90’s. Recently, in 2010, the company acquired a 20.2% share in Hermès International.
Strategy
LMHV business model is characterized by the full control of retail (LVMH owned stores) and by a no-discount price policy. LVMH geographic strategy focuses on capturing the developing countries, while continue to investing in richer countries. A LVMH executive assumes that the company puts its effort on product, distribution and communication, so that people forget about price. The firm’s growth strategy lies in the organic growth and acquisitions.
CAGR 08-10 12,08% 20,98% 0,57% 8,08% 1,05% 5,22% 0 € 5.000 € 10.000 € 15.000 € 20.000 € 25.000 € 2008 2009 2010 Other Asia Japan US Europe France
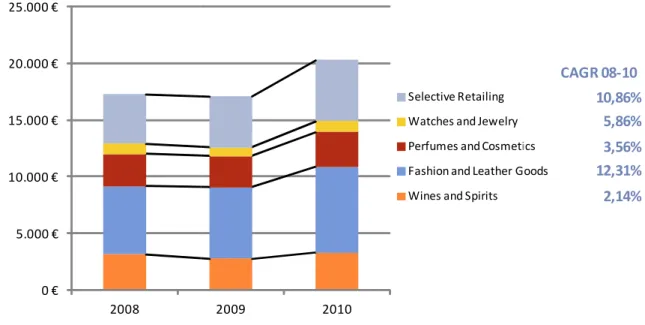
Figure 11: LVMH Sales segment
Costs
The company doesn’t disc
mentions, generally, that controls tightly the costs. LVMH factories use other industries techniques (e.g. car making) aiming to lower costs. This also allows to more easily assigning workers to products, to face demand flows. LVMH also has a tight quality control policy. The costs breakdown allows easy understanding that the Marketing and sale costs have the same weight as the cost of sales. Due to its high
LVMH bears high costs of
Advertising and promotion expenses represent 11% of sales. Figure 12: Bulgari costs breakdown as % of sales Revenues (20
0 € 5.000 € 10.000 € 15.000 € 20.000 € 25.000 € 2008 segment breakdown (2008-2010)
The company doesn’t disclose information about cost efficiency improvement, only mentions, generally, that controls tightly the costs. LVMH factories use other industries techniques (e.g. car making) aiming to lower costs. This also allows to more easily ucts, to face demand flows. LVMH also has a tight quality control policy. The costs breakdown allows easy understanding that the Marketing and sale costs have the same weight as the cost of sales. Due to its
high-LVMH bears high costs of marketing. Included on Marketing and selling costs, Advertising and promotion expenses represent 11% of sales.
Bulgari costs breakdown as % of sales Revenues (2010)
2009 2010
Selective Retailing Watches and Jewelry Perfumes and Cosmetics Fashion and Leather Goods Wines and Spirits
lose information about cost efficiency improvement, only mentions, generally, that controls tightly the costs. LVMH factories use other industries techniques (e.g. car making) aiming to lower costs. This also allows to more easily ucts, to face demand flows. LVMH also has a tight quality control policy. The costs breakdown allows easy understanding that the Marketing and -end positioning, marketing. Included on Marketing and selling costs,
CAGR 08-10 10,86% 5,86% 3,56% 12,31% 2,14%
Perfumes and Cosmetics Fashion and Leather Goods
Wine and Spirits
Champagne and wines division contributed 51% to the segment revenues of EUR 3 billion (2010 figures); through brands like Moet & Chandon, Veuve Clicquot and Krug. LVMH is the world leader in champagne. The vineyards owned by LVMH cover 15% of the necessary grapes and wines, beyond that, the supply is made by other wine growers and cooperatives. Most of its cellars were acquired In 19th and 20th centuries.
The Cognac & Spirits division, which owns brands such as Henessy and Belvedere, contributed 49%. Henessy liquor makes LVMH the cognac world leader. The LVMH Wines and Spirits distribution on global markets is assured mainly by a network of international subsidiaries. The spirits group Diageo, is included in this network, through a join-venture deal; 28% of the sales of champagne and cognac were made through this channel (2010 figures).
Fashion and Leather goods
Fashion and leather goods division which produces, mainly bags, shoes and cloths, presented revenues of EUR 7.5 billion (2010 figures). The segment manages some of the industry most known brands such as Louis Vuitton, Fendi, Marc Jacobs and Givenchy.
LVMH controls the distribution of Fashion and leather goods in order to preserve good margins, manage the brand’s image and to keep itself close from clients in order to assure a high quality service. The production capacity and outsourcing varies along the several brands, representing 43% of the cost of goods sold (2010 figures). The row materials (e.g. leather) are supplied outside of LVMH. The group portfolio performance is highly dependent of Louis Vuitton brand.
Perfumes and Cosmetics
The division achieved revenue of EUR 3 billion (2010 figures), for which perfumes division contributed 48%, Cosmetics 34% and Skincare products 18%. The segment portfolio includes well known brands such as Parfums Christian Dior, Guerlain, Parfums Givenchy and Parfums Kenzo.
The research and development is made via LMVH Recherche allowing benefiting from synergies in the research ad development of new formulas. The production is outsourced for the American firms (i.e. Benefit Cosmetics and Fresh); Lowe parfums and Acqua di Parma also sub-contract most of their production. The out-sourcing represents 6% of the cost of sales, plus around EUR 10 million on logistical outsourcing.