*e-mail: [email protected]
Assessing Nanocellulose Developments Using Science and Technology Indicators
Douglas Henrique Milanez*, Roniberto Morato do Amaral,
Leandro Innocentini Lopes de Faria, José Angelo Rodrigues Gregolin
Materials Engineering Department, Information Center for Materials Technology, Federal University of São Carlos – UFSCar, Km 235, Rod. Washington Luís, CEP 13565-905, São Carlos, SP, Brazil
Received: November 3, 2012; Revised: December 29, 2012
This research aims to examine scientific and technological trends of developments in nanocellulose based on scientometric and patent indicators obtained from the Science Citation Index and Derwent Innovations Index in 2001-2010. The overall nanocellulose activity indicators were compared to nanotechnology and other selected nanomaterials. Scientific and technological future developments in nanocellulose were forecasted using extrapolation growth curves and the main countries were also mapped. The results showed that nanocellulose publications and patent documents have increased rapidly over the last five years with an average growth rate higher than that of nanotechnology and fullerene. The USA, Japan, France, Sweden and Finland all played a significant role in nanocellulose development and the extrapolation growth curves suggested that nanocellulose scientific and technological activities are still emerging. Finally, the evidence from this study recommends monitoring nanocellulose S&T advances in the coming years.
Keywords: nanomaterials, bibliometry, scientific publication, patent document
1. Introduction
Nanotechnology is a complex, emerging and interdisciplinary area with great potential to promote significant innovation in materials, products and processes to benefit society1. In 2006, many countries, including the United States, Japan, China, India and most of the European Union countries, had a specific program for developing nanotechnologies linked to their national strategies for economic development and industrial competitiveness2. Global funding reached a round figure of US$ 10 billion in 20113, more than twice the value from 2005 (US$ 4.5 billion)4. Moreover, there is a growing interest in environment-friendly materials and cellulose-based nanomaterial can offer important competitive advantages because it is a renewable, sustainable and carbon-neutral resource5-8. Therefore, researchers from paper and wood communities have explored nanotechnologies seeking new products from forest sources5.
Nanocellulose has been studied recently due to its mechanical, functional, biocompatible and biodegradable properties, which enable a range of potential applications in composite materials, papers, packing materials, electronics, coatings, cosmetics and medical devices6-8. For instance, cellulose nanofibrils (CNF) may act as a dry reinforcing agent in papers and as a low-calorie thickener and suspension stabilizer4. Cellulose nanocrystals (CNC) may achieve a greater elastic modulus than Kevlar (Kevlar is a registered trademark for an aramid fiber developed at DuPontTM in 1965 and it is best known for its use in ballistic and stab-resistant body armour)9. and might have a liquid crystalline behavior due to its asymmetric rod-like shape8. CNF and CNC configure the nanocellulose family
and improve the adhesion between the nanomaterial and the polymeric matrix in order to enhance the reinforcement effect5-8. Although these initiatives are extremely relevant to the development of nanocellulose, less attention has been paid to systematically assessing its scientific and technological (S&T) advances, including the development and involvement stage from the major pulp producers.
In the competitive environment, emerging areas related to new materials, such as nanocellulose, are extremely uncertain about event-changes, especially when they greatly depend on science and technology (S&T) advances. In order to minimize these uncertainties, technological forecasting may support planning and decision making for public policies and strategies of companies by monitoring early signs of changes13,14. Bibliometric approaches have been applied to monitoring due to their advantage for analyzing large amounts of data and documents and in providing useful indicators to gain insights into a subject from the outputs of scientific and technological research, such as scientific publications and patent documents1,15. Bibliometry aims to measure registered scientific and technological communication using mathematical and statistical counting of documents, citation, words and terms in order to find hidden trends and patterns of different levels of stratification15.
Bibliometric methods have been applied in nanotechnology so as to monitor the scientific and technological developments from this emerging area. Dang et al.16 mapped the patent applications in nanotechnologies analyzing the strategic participation of foreign countries and the main topics for 15 national patent offices from 1991 to 2008. They found a domestic advantage of patent appliance and observed that the worldwide growth rate of patent applications was 34.5% from 2000 to 2008, higher than the growth rate of scientific publications in the same period. They also observed that semiconductor devices were in the top five technology fields in 11 patent offices16. Scientific publications in nanotechnology between 1990 and 2006 showed that the United States and the European Union countries had the highest number and the most cited scientific publications, although China and other Asian countries have increased their shares recently17. Meanwhile, it should be noted that the Chinese and Koreans have been publishing their outcomes in low impact journals18.
Besides bibliometry, another useful forecasting technique is extrapolation growth curves that characterize the scientific and technological development stage, which can be emerging, growing, maturation or saturation period, in a specific topic. According to Martino13, the use of growth curves means it is assumed that the past of a time series contains all the information needed to forecast the future of that time series. The Pearl or logistic curve is an extrapolation method that has often been used to forecast nanotechnologies and analyze the level of development. For example, Braun, Schubert and Kostoff19 assessed trends for fullerene scientific developments from 1985 to 1996 and found that publication occurred in the maturation period of development. Nevertheless, the authors speculated that new directions in research, cutting edge discoveries, and new opportunities could provide another cycle of publication
growth19. Cheng and Chen20 applied the Pearl growth curve and bibliometric methods to investigate increasing trends of nanosized ceramic powder technologies towards partial substitution of traditional ceramic powders. Their outcomes showed all the nanosized ceramic powder technologies as emerging or in the initial growth maturity periods of their technological life cycles. Moreover, while traditional ceramic powders would attain the estimated maturity period in 2011 years, the nanosized ceramic powder would be in the fast growth period of development20.
Considering the enormous potential of nanocellulose in coming years, in this paper its S&T development is investigated by using scientometrics and patent indicators, as well as growth curve extrapolation. The evolution of nanocellulose scientific publishing and patent documents registering were compared with the evolution of nanotechnology and technology as a whole, as well as for other selected nanomaterials. Nanocellulose scientific publishing and patenting were forecasted and its development stage characterized. Furthermore, the main countries involved in these activities were also mapped, as well as their scientific and technological degree of research.
2. Experimental Procedures
2.1.
Procedures for collecting publications and
patent data
Bibliometric indicators were prepared according to guidelines for compiling and analyzing scientific and patent documents recommended by OCDE Manuals15,21,22. To comparatively assess the nanocellulose S&T development in nanotechnology and selected nanomaterials (carbon nanotubes, fullerenes, graphene, nanosilver and nanotitania), a dataset of bibliographic records indexed in the Science Citation Index (Publication) and Derwent Innovations Index (Patents) was generated. These databases are excellent data sources for developing S&T indicators due to their worldwide coverage and collection quality. All nanomaterial data were individually recovered using the Boolean search expressions presented in Table 1. In the case of nanotechnology, a modular search strategy suggested by Porter et al.23 was used because it includes nano-related terms revised by experts, specialized journals and the International Patent Classification of nanotechnology.
All searches were conducted retrieving terms from titles, abstracts and keywords of publications or patent documents, except in the case of nanotechnology strategy, which required the addition of the source title (publications) and IPC fields (patents). In the case of scientific publications, the searches were limited to Articles, Letters, Notes and Reviews in order to follow international scientometrics practices24,25.
2.2.
Bibliometric procedures for publication and
patent data analysis
made using the Microsoft Office Excel (2007 version). In addition, although the patent manual recommends the inventor’s country to compile patent statistics, the priority country was used due to the lack of inventor information on the bibliographic records obtained from the Derwent Innovations Index.
The number of publications or patent documents from 2001 to 2010 and the average growth rate in this period for nanotechnology and selected nanomaterials were obtained: carbon nanotubes, fullerenes, graphene, nanosilver, nanocellulose and nanotitania. In the case of nanocellulose, scientific and technological maturity were predicted by using extrapolation Pearl growth calculations and curves13 and the ten most productive countries considering their total number of publications and patent documents from 2001 to 2010 were analyzed. In addition, the countries’ scientific and technological degree of research, counting the number of patents per ten publications, was also evaluated.
The annual growth rate (Gi) was calculated using Equation 1, where Ni is the number of publications in the year “i” and Ni-1 is the number of publications in the year “i-1”. The average growth rate (AGR) from 2001 to 2010 was obtained from the simple mean of the annual rates.
(
1)
1
100
i i i
i
N N
G
N
− −
− ×
= (1)
2.3.
Extrapolating procedures for analyzing S&T
nanocellulose maturity
The maturity stage of nanocellulose S&T development was forecasted using the Pearl growth curve which is calculated according to Equation 2. L is the upper limit to the growth of variable Y, t is time, a and b are coefficients obtained by fitting the growth curve to the known data, and
e is the base of natural logarithms13.
1 bt
L y
ae−
=
+ (2)
Three upper limits (L) were tested properly to state the future development of scientific publications and patent documents. These upper limits were chosen considering their best fit to the real annual cumulative data from 2001 to 2010. Furthermore, inflection points of all curves were obtained in order to delimit the growth and maturity stages13,20.
3. Results and Discussion
3.1.
Nanotechnology and nanomaterials
development comparison
According to Table 2, carbon nanotubes shared 7.6% and 10.2% of the total number of nanotechnology publications and patent documents from 2001 to 2010 and these facts suggest carbon nanotubes are the most explored nanomaterial in research activities compared to the other nanomaterials, even though fullerene was discovered earlier. A possible explanation for this might be that carbon nanotubes have been investigated to understand the nanoscale phenomena over time and they also have high potential applications in electronics and in the field of materials26.
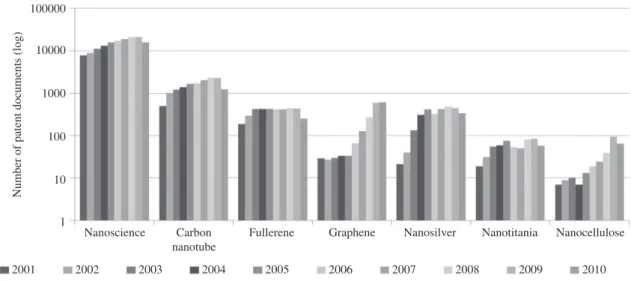
Except for fullerene, all average growth rates (AGR) calculated for nanomaterials were higher than the value obtained from nanotechnology and this indicates that these nanomaterials are at an earlier stage of their lifecycle and that they will promote nanotechnology advances in coming years. In the case of fullerene, the average growth rates were the lowest among the topics studied and the annual number of publications and patents seems to be leveling out with a slight increase in the number of publications from 2005 to 2010, as can be seen from Figure 1. This behavior suggests a trend towards maturity of the fullerene research field which corroborates the findings reported by Braun, Schubert and Kostoff19, who analyzed in 2000 the evolution of fullerene publications from 1985 to 1996. On the other hand, our results also indicate that no further discoveries concerning fullerene caused another increase in the publications, as suggested by the authors19.
Similar values of AGR from nanotechnology publications and patent documents can be observed and these indicate that the scientific and technological developments are possible at the same level in their lifecycle. As shown in Figures 1 and 2, the annual number of publications and patent documents grew significantly in the period considered and this is a positive result from worldwide nanotechnology programs which started mainly in 20012.
The number of publications increased markedly in the period analyzed for carbon nanotubes, nanosilver and nanotitania, as can be seen in Figure 1. The significant rise in publications can also be seen for nanocellulose after 2003 and for graphene after 2005. Regarding the annual number
Table 1. Search expressions for different nanomaterials and for nanotechnology.
Topic Search expression
Carbon nanotube “carbon nanotub*” Fullerene fulleren* Graphene graphene*
Nanosilver nanosilver OR “nano-silver” OR “silver nanopartic*” OR nanoAg
Nanotitania “titanium dioxid* nanopartic*” OR “titanium dioxid* nanomat*” OR “nanoTiO2” OR “nano-TiO2” OR “titanium oxid* nanopart*” OR “titanium oxid* nanomat*” OR nanotitania* OR “titania nanopart*” OR “titania nanomat*”
Nanocellulose
“cellulose microfibril*” OR “microfibril* cellulose” OR “cellulose nanofibril*” OR “nanofibril* cellulose” OR “cellulose nanowhisker*” OR “cellulose whisker*” OR “cellulose nanocrystal*” OR “nanocrystal* cellulose” OR nanocellulose OR “cellulose nanoparticle*” OR “cellulose nanofiber*”
of patent documents, different behavior can be observed in Figure 2. Concerning carbon nanotubes and nanocellulose, it grew constantly between 2002 and 2009 and after 2004, respectively. In the case of graphene, the number of patent documents presented a sharp growth after 2005. Regarding nanosilver and nanotitania, it increased considerably from 2001 to 2005, remaining almost constant since then. These outcomes reinforce the dependence linkage between science and technology in the nanoscale research field.
In addition, the decrease in patent documents in 2010 for all topics was caused by the lack of data from this year, due to the fact that a number of patent documents had not been published or indexed when the research was conducted. This happened because a patent application usually stays confidential for 18 months before it is published, depending on the country’s intellectual property rules27, and one has to take into account the period for indexing the patent by the database. Thus, by the time the searches were performed, most of the patents from 2010 had not yet been indexed or published.
3.2.
Nanocellulose development forecast
Nanocellulose scientific publications seem to have already achieved the growing stage, and so the annual
growth rate trend should be high in coming years, as shown in Figure 3. According to the graph, the cumulative number of publications will increase rapidly until 2021-2025, when it will achieve the inflection point and then start the maturity stage, and saturation will be attained after 2050.
The cumulative number of nanocellulose patent documents suggests an earlier stage of technological development compared to scientific behavior due to the low amount of documents up to 2010, as can be seen in Figure 4. Maturity in technological development can be reached after 2026-2030 and saturation may also occur after 2050. These extrapolation curves suggest there will be a substantial period until science and technology developments in nanocellulose start to achieve their maturation period, which means that this is the moment to invest in nanocellulose research. However, these curves cannot forecast if a significant discovery could change development behavior and, consequently, the cumulative number of publication or patent documents in the future.
3.3.
Country comparison
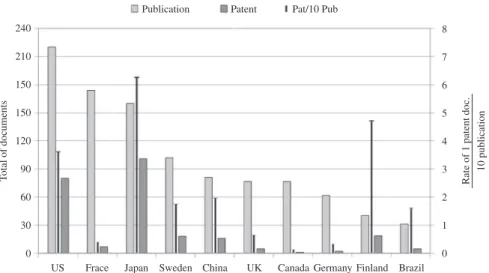
The top publication countries and their total number of patent documents from 2001 to 2010, shown in Figure 5, were also the major cellulose and pulp producers of 201028,
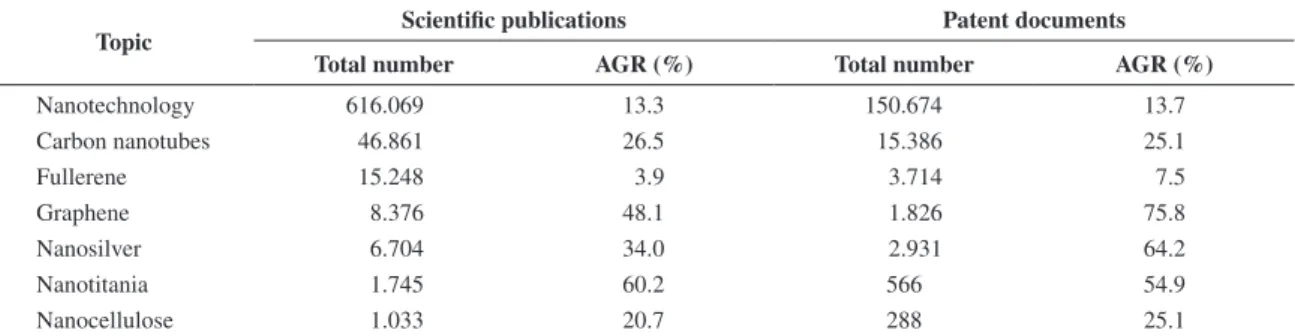
Table 2. Number of scientific publications and patent documents and the average growth rates (AGR) for nanotechnology and selected nanomaterials from 2001 to 2010.
Topic Scientific publications Patent documents
Total number AGR (%) Total number AGR (%)
Nanotechnology 616.069 13.3 150.674 13.7
Carbon nanotubes 46.861 26.5 15.386 25.1
Fullerene 15.248 3.9 3.714 7.5
Graphene 8.376 48.1 1.826 75.8
Nanosilver 6.704 34.0 2.931 64.2
Nanotitania 1.745 60.2 566 54.9
Nanocellulose 1.033 20.7 288 25.1
Sources: Science Citation Index and Derwent Innovations Index.
Figure 2. Annual number of patent documents for nanotechnology and selected nanomaterials from 2001 to 2010. Source: Derwent Innovations Index.
Figure 3. Extrapolation growth curve from nanocellulose scientific publications. Source: Science Citation Index.
Figure 4. Extrapolation growth curve from nanocellulose patent documents. Source: Derwent Innovations Index.
except for France and the United Kingdom. From the total number of 1,033 publications, 83.2% were developed by the ranked countries, and the most representative countries were the United States, France, Japan and Sweden due to the fact that together they accounted for 59.1% of all the publications. Furthermore, Japan, the United States and Finland stood out in the relationship indicator in patents and publication, suggesting that these countries are highly capable of converting scientific knowledge into technology. In addition, there is a Finnish organization which started a pilot plant for producing nanocellulose in 201111 and the U.S. Forest Service Forest Products Laboratory has also recently opened the first production facility for renewable forest-based nanomaterials in the United States11.
Regarding patenting, Japan and the United States applied for 35.1% and 27.8% of patents respectively from 2001 to 2010. Finland, Sweden and China applied 6.6%, 6.3% and 5.6%, respectively, over the whole patent documents recovered in the same period. Except for Japan and the United States, all countries presented a recent trend to increase their number of patent documents, and this can be related to the emergence of nanocellulose-related technologies. Moreover, some applicants usually file for patents first in a foreign patent
office and then extend the patent protection to their original country at later stages. For instance, Canadian firms usually file patents with the U.S Patent and Trademark Office22 first and this may assist in understanding the low amount of patent documents from Canada, which already has a nanocrystalline cellulose pilot plant10.
Interestingly, half of the ranked countries in Figure 5 were from the European Union and this might be related to significant involvement from these countries with wood- and forest-based projects, as can be seen from projects under the EU’s Seventh Framework Programme for Research. In this programme, development efforts in scaling-up nanocellulose production, surface modification and sustainable composite materials could be found, and organizations from Finland and Sweden were the main leaders29.
4. Conclusion
it may provide in composite and others applications. The outcomes highlight the United States, France and Japan in the leading position of publications followed by some of the major producers of pulp and cellulose and by the United Kingdom. In terms of patenting, Japan and United States can be highlighted due to their high number of documents. Furthermore, France, Sweden, Finland and China can be placed as important countries that have assisted highly in nanomaterial S&T advances in the period analyzed. The results also showed scientific publications and patent documents of nanocellulose had begun to increase markedly after 2003 and 2004, respectively, which were late compared to other nanomaterials and nanotechnology, except in the case of graphene which boomed in 2005-2006 and fullerene which seems to have achieved its maturity. Additionally, a strong link between science and technology could be verified due to the fact that when there was an increase in the number of scientific publications, the number of patent documents grew a year later in the case of carbon nanotubes, graphene and nanocellulose.
The nanocellulose extrapolation curves suggested there is a long period until the publications and patent documents initiate the maturation stage. This finding means that there are several nanocellulose-related discoveries and technologies to be developed and it is the moment to invest in nanocellulose research. However, a limitation is that changes in the forecasting curves or indicators developed cannot be predicted and monitoring scientific and technological activities should be constantly reviewed. Further recommendations are to map the main institutions and companies involved in nanocellulose issues and to investigate what their activity focuses are.
Acknowledgements
The authors are grateful to the Brazilian National Council for Technological and Scientific Development (process number 160087/2011-2), to the Graduate Program in Materials Science and Engineering and to the Graduate Program in Science, Technology and Society, both at the Federal University of São Carlos, for supporting this work.
Figure 5. Country comparison in terms of publication, patent documents and rate of patent per ten publications from 2001 to 2010. Sources: Science Citation Index and Derwent Innovations Index.
References
1. Salerno M, Landoni P and Verganti R. Designing foresight studies for Nanoscience and Nanotechnology (NST) future developments. Technological Forecasting and Social Change. 2008; 75(8):1202-1223. http://dx.doi.org/10.1016/j. techfore.2007.11.011
2. Brasil. Secretaria de Assuntos Estratégicos. Estudos estratégicos: nanotecnologia. Brasília: Núcleo de Assuntos Estratégicos da Presidência; 2006. Available from: <http://www. sae.gov.br/site/wp-content/uploads/12estudo_nanotecnologia. pdf>. Access in: 27/10/2012.
3. European Commission. Observatorynano. Public funding of nanotechnology. Available from: <http://www.observatorynano. eu/project/filesystem/files/PublicFundingofNanotechnologies_ March2012.pdf>. Access in: 27/10/2012.
4. Roco MC. International Perspective on Government Nanotechnology Funding in 2005. Journal of Nanoparticle Research. 2005; 7(6):707-712. http://dx.doi.org/10.1007/ s11051-005-3141-5
5. Beecher J. Wood, trees and nanotechnology. Nature Nanotechnology. 2007; 2(August):466-467. PMid:18654341. http://dx.doi.org/10.1038/nnano.2007.239
6. S i q u e i r a G , B r a s J a n d D u f r e s n e A . C e l l u l o s i c Bionanocomposites: A Review of Preparation, Properties and Applications. Polymers. 2010; 2(4):728-765. http://dx.doi. org/10.3390/polym2040728
8. M o o n R J , M a r t i n i A , N a i r n J , S i m o n s e n J a n d Youngblood J. Cellulose nanomaterials review: structure, properties and nanocomposites. Chemical Society Review. 2011; 40(7):3941-3994. PMid:21566801. http:// dx.doi.org/10.1039/c0cs00108b
9. DuPont. Kevlar Brand. Available from: <http://www2.dupont.
com/personal-protection/en-us/dpt/kevlar.html>. Access in 19/12/2012.
10. FPInnovations. CelluForce celebrates the inauguration of the world’s first nanocrystalline cellulose demonstration plant. Available from: <http://www.fpinnovations.ca/MediaCentre/ PressReleases/20120126-celluforce_inauguration.pdf>. Access in: 29/10/2012.
11. Innventia. Plant pilot for nanocellulose. Available from: <http://www.innventia.com/en/Our-Ways-of-Working/ Demonstration-and-pilot/Pilot-plant-for-nanocellulose/>. Access in: 29/10/2012.
12. United States. United States Department of Agriculture. USDA under secretary Sherman unveils nanocellulose production facility. Available from: <http://blogs.usda.gov/2012/08/03/ usda-under-secretary-sherman-unveils-nanocellulose-production-facility/>. Access in: 29/10/2012.
13. Martino JP. Technological forecasting for decision making. 3rd ed. New York: McGraw-Hill; 1993.
14. Gilad B. Early warning: using competitive intelligence to anticipate market shifts, control risk, and create powerful strategies. New York: Amacom; 2003.
15. Okubo Y. Bibliometric indicators and analysis of research systems: methods and examples. OECD Science, Technology and Industry Working Papers; 1997. Available from: <http:// dx.doi.org/10.1787/208277770603>. Access in: 27/10/2012. 16. Dang Y, Zhang Y, Fan L, Chen H and Roco MC. Trends in
worldwide nanotechnology patent applications: 1991 to 2008.
Journal of Nanoparticle Research. 2010; 12(3):687-706. PMid:21170123 PMCid:2988206. http://dx.doi.org/10.1007/ s11051-009-9831-7
17. Youtie J, Shapira P and Porter AL. Nanotechnology publications and citations by leading countries and blocs.
Journal of Nanoparticle Research. 2008; 10(6):981-986. http:// dx.doi.org/10.1007/s11051-008-9360-9
18. Kostoff RN, Koytcheff RG and Lau CGY. Global nanotechnology research literature overview. Technological Forecasting and Social Change. 2007; 74(9):1733-1747. http:// dx.doi.org/10.1016/j.techfore.2007.04.004
19. Braun T, Schubert AP and Kostoff RN. Growth and Trends of Fullerene Research as Reflected in Its Journal Literature.
Chemical reviews. 2000; 100(1):23-38. http://dx.doi. org/10.1021/cr990096j
20. Cheng A and Chen C. The technology forecasting of new materials: the example of nanosized ceramic powders.
Romanian Journal of Economic Forecasting. 2008; 4:88-110. 21. O r g a n i s a t i o n f o r E c o n o m i c C o - o p e r a t i o n a n d
Development - OECD. The measurement of scientific and technological activities using patent data as science and technology indicators. OECD; 1994. Patent Manual. Available from: <http://dx.doi.org/10.1787/9789264065574-en>. Access in: 27/10/2012.
22. O r g a n i s a t i o n f o r E c o n o m i c C o - o p e r a t i o n a n d Development - OECD. OECD Patent Statistics Manual. OECD; 2009. Patent Manual. Available from: <http://dx.doi. org/10.1787/9789264056442-en>. Access in: 27/10/2012.
23. Porter AL, Youtie J, Shapira P and Schoeneck DJ. Refining search terms for nanotechnology. Journal of Nanoparticle Research. 2007; 10(5):715-728. http://dx.doi.org/10.1007/ s11051-007-9266-y
24. European Commission. Directorate-general for research. Third European report on science & technology indicators. 2003. Available from: <http://www.umic.pt/images/stories/ publicacoes200709/3rd_report.pdf>. Access in: 27/10/2012. 25. United States. National Science Board. Science and engineering
indicators 2004. National Science Foundation; 2008. Available from: <http://www.nsf.gov/statistics/seind04/>. Access in: 27/10/2012.
26. Igami M and Okazaki T. Capturing nanotechnology’s current state of development via analysis of patents. OECD Publishing; 2007. Available from: <http://www.oecd.org/ science/innovationinsciencetechnologyandindustry/38780655. pdf >. Access in: 27/10/2012.
27. Mogee ME. Patents and technology intelligence. In: Ashton W B, Klavans RA, editors. Keeping abreast of science and technology: technical intelligence for business. Columbus: Battelle Press; 1997. p. 295-336.
28. Associação Brasileira de Celulose e Papel. Dados do setor. Available from: <http://www.bracelpa.org.br/bra2/sites/default/ files/estatisticas/booklet.pdf >. Access in: 20/10/2012. 29. European Commission. CORDIS. Seventh Framework