Leonardo Pedro Donas-Boto de Vilhena Martins
[Nome completo do autor]
[Nome completo do autor]
[Nome completo do autor]
[Nome completo do autor]
[Nome completo do autor]
[Nome completo do autor]
Orientador: José Manuel Matos Ribeiro da Fonseca, Professor
Associado com Agregação, FCT-UNL
Co-orientador: André Sanches Ribeiro, Professor, Faculty of Medicine and
Health Technology Tampere University
Júri:
Presidente: Prof. Doutor Luís Manuel Camarinha de Matos
Arguentes: Prof. Doutor Pedro Miguel Dinis de Almeida Prof. Doutor Fernando Jorge Coutinho Monteiro
Vgais: Prof. Doutor Luís Manuel Camarinha de Matos Prof. Doutor José Manuel Matos Ribeiro da Fonseca Prof. Doutor Arnaldo Joaquim Castro Abrantes Prof. Doutor André Teixeira Bento Damas Mora
Image Processing and Simulation Toolboxes
of Microscopy Images of Bacterial Cells
[Título da Tese]
Dissertação para obtenção do Grau de Doutor em
Engenharia Electrotécnica e de Computadores
Dissertação para obtenção do Grau de Mestre em [Engenharia Informática]
Mestre em Engenharia Biomédica
[Habilitações Académicas] [Habilitações Académicas] [Habilitações Académicas] [Habilitações Académicas] [Habilitações Académicas] [Habilitações Académicas] [Habilitações Académicas]ii
iii
Image Processing and Simulation Toolboxes of Microscopy Images of Bacterial Cells
Copyright © Leonardo Martins, Faculdade de Ciências e Tecnologia, Universidade Nova de Lisboa.
A Faculdade de Ciências e Tecnologia e a Universidade Nova de Lisboa têm o direito, perpétuo e sem limites geográficos, de arquivar e publicar esta dissertação através de exemplares impressos reproduzidos em papel ou de forma digital, ou por qualquer outro meio conhecido ou que venha a ser inventado, e de a divulgar através de repositórios científicos e de admitir a sua cópia e distribuição com objectivos educacionais ou de investigação, não comerciais, desde que seja dado crédito ao autor e editor.
iv
v
Acknowledgements
First, I would like to thank my supervisor Prof. Dr. José Manuel Fonseca, who offered me this great opportunity of doing my PhD Thesis project and gave me great support over all this years and is an inspiration to my future academic endeavours.
To Prof. Dr. André Sanches Ribeiro, who welcomed me in his group and provided a great assistance during my stay in Finland, both at supporting and providing me with all the tools necessary for this work.
To all my friends and especially that started our studies in Biomedical Engineering, more than 12 years ago, my own Biofofos: Joaquim Horta, Nuno Fernandes, Hugo Pereira, Pedro Martins, Luís Mendes, Fernando Mota, Bernardo Azevedo, João Martins, Pedro Cascalho, Sérgio Mendes, João Santinha, Filipe Rodrigues, Sara Gil, Mafalda Fernandes, Rita Carvalho, Ana Marques, Ana Valente and Milene Bação, and I also want to thank also want to thank Rita Narciso, Gabriela Pereira, Mafalda Oliveira and Sara Coutinho, who have also been a pillar of support for me. It has been a great journey, and hopefully we will continue to enjoy the ride.
I want to show my greatest gratitude to everyone that I met during my time spent in FCT for all the good times spent with you guys and hopefully we shall continue this great friendship after completing this journey together, and my friends from the PTCG community. A picture is worth a thousand words, but sometimes we just need 4 to express our feelings: I love you guys!!!
I also want to thank to all the friends that I have met in Finland and especially everyone from the Laboratory of Biosystem Dynamics (LBD) who welcomed me into their group.
Finally, I want to thank my family, especially my parents and my brother who always gave me strength to overcome any problem and who gave me the support to make this important move for my education.
This work was supported by the Portuguese Foundation for Science and Technology (FCT/MCTES) through a funded PhD Scholarship (ref. SFRH/BD/88987/2012).
This work was developed in the CA3 group (CA3 - Computational Intelligence Research Group) of CTS, UNINOVA in cooperation with Laboratory of Biosystem Dynamics (LBD) from Tampere University of Technology. This work is integrated in project SADAC – Study of the kinetics of asymmetric disposal of aggregates in cell division and its correlation to functional aging from in vivo measurements, one event at a time – with the reference PTDC/BBB-MET/1084/2012, funded by FCT - Fundação para a Ciência e a Tecnologia.
vii
Abstract
Recent advances in microscopy imaging technology have allowed the characterization of the dynamics of cellular processes at the single-cell and single-molecule level. Particularly in bacterial cell studies, and using the E. coli as a case study, these techniques have been used to detect and track internal cell structures such as the Nucleoid and the Cell Wall and fluorescently tagged molecular aggregates such as FtsZ proteins, Min system proteins, inclusion bodies and all the different types of RNA molecules. These studies have been performed with using multi-modal, multi-process, time-lapse microscopy, producing both morphological and functional images.
To facilitate the finding of relationships between cellular processes, from small-scale, such as gene expression, to large-scale, such as cell division, an image processing toolbox was implemented with several automatic and/or manual features such as, cell segmentation and tracking, intra-modal and intra-modal image registration, as well as the detection, counting and characterization of several cellular components.
Two segmentation algorithms of cellular component were implemented, the first one based on the Gaussian Distribution and the second based on Thresholding and morphological structuring functions. These algorithms were used to perform the segmentation of Nucleoids and to identify the different stages of FtsZ Ring formation (allied with the use of machine learning algorithms), which allowed to understand how the temperature influences the physical properties of the Nucleoid and correlated those properties with the exclusion of protein aggregates from the center of the cell. Another study used the segmentation algorithms to study how the temperature affects the formation of the FtsZ Ring.
The validation of the developed image processing methods and techniques has been based on benchmark databases manually produced and curated by experts. When dealing with thousands of cells and hundreds of images, these manually generated datasets can become the biggest cost in a research project. To expedite these studies in terms of time and lower the cost of the manual labour, an image simulation was implemented to generate realistic artificial images.
The proposed image simulation toolbox can generate biologically inspired objects that mimic the spatial and temporal organization of bacterial cells and their processes, such as cell growth and division and cell motility, and cell morphology (shape, size and cluster organization). The image simulation toolbox was shown to be useful in the validation of three cell tracking algorithms: Simple Nearest-Neighbour, Nearest-Neighbour with Morphology and DBSCAN cluster identification algorithm. It was shown that the Simple Nearest-Neighbour still performed with great reliability when simulating objects with small velocities, while the other algorithms performed better for higher velocities and when there were larger clusters present.
ix
Resumo
Os recentes avanços nas tecnologias imagiológicas utilizadas em microscopia proporcionaram a caracterização das dinâmicas de processos celulares ao nível celular e molecular. Particularmente em estudos com bactérias, e tendo a E. coli como caso de estudo, essas técnicas têm sido utilizadas para detetar e monitorizar estruturas celulares como o Nucleoide, a Parede Celular, e também agregados moleculares marcados com fluorescência, como as proteínas FtsZ e do sistema Min, corpos de inclusão e moléculas de RNA. Estes estudos têm sido realizados utilizando microscopia multi-modal, processual e com séries temporais, produzindo tanto imagens morfológicas como funcionais.
De modo a facilitar as descobertas de ligações entre processos celulares, com diferentes escalas, como a expressão genética a divisão celular, foi implementada uma plataforma de processamento de imagem com diversas funções (automáticas e/ou manuais), como a segmentação e monitorização celular, registo de imagens intra-modal e inter-modal, e também a deteção, contagem e caracterização de vários componentes celulares.
Dois algoritmos de segmentação de componentes celulares foram implementados, tendo o primeiro sido baseado na Distribuição Gaussiana e o segundo baseado em funções de limitação e estruturação morfológica. Ambos os algoritmos foram utilizados para segmentar Nucleoides e para identificar os diferentes estágios de formação do Anel de FtsZ (aliado com a utilização de algoritmos de aprendizagem automática). Estes passos permitiram perceber como é que a temperatura influencia as propriedades físicas do Nucleoide e permitiram correlacionar essas propriedades com a expulsão do centro da célula de agregados proteicos. Um outro estudo utilizou os mesmos algoritmos de segmentação para estudar como é que a temperatura influencia a formação do Anel de FtsZ.
A validação dos métodos de processamento de imagem tem sido baseada em bases de dados de referência, produzidas e curadas manualmente por especialistas. Quando se lida com milhares de células e centenas de imagens, essas bases de dados podem tornar-se o maior custo num projeto de investigação. Um simulador de imagens foi implementado para gerar imagens artificiais e realistas, de modo a diminuir o custo do trabalho manual, a acelerar esses estudos em termos de tempo.
O simulador de imagens proposto, pode gerar objetos biologicamente inspirados, sendo estes capazes de imitar a organização espacial e temporal de células bacterianas, tal como imitar os seus processos, como o crescimento celular, divisão, motilidade, e também a sua morfologia (forma, tamanho e organização em aglomerados). O simulador de imagens mostrou ser útil na validação de três algoritmos de monitorização celulares: Simples Vizinho-Mais-Próximo, Vizinho-Mais-Próximo com Morfologia e o algoritmo de identificador de aglomerados, DBSCAN. Foi demonstrado que o Simples Vizinho-Mais-Próximo ainda teve um desempenho de grande fiabilidade quando foram simulados objetos com velocidades baixas, e que os outros algoritmos tiveram melhores desempenhos para velocidades maiores e para aglomerados maiores.
Palavras-chave: Processamento de Imagem; Simulação de Imagem; Segmentação Celular; Monitorização Celular
xi
Table of Contents
Acknowledgements ... v Abstract ... vii Resumo ... ix Table of Contents ... xiList of Figures ... xiii
List of Tables ... xvii
Glossary – Acronyms, Abbreviatures and Definitions ... xix
Introduction ... 1
1.1. Motivation ... 1
1.2. Open Questions in the Area ... 3
1.3. Main Research Question ... 3
1.4. Hypothesis ... 4
1.5. Research Methodologies ... 4
1.6. Structure of the Dissertation ... 5
Background Information ... 7
2.1. Cell Modelling – Spatial and Temporal Organization of Bacteria ... 7
2.2. Cell Morphology - Shape, Size and Spatial Organization ... 8
2.3. Cellular Structures and Molecules ... 16
2.4. Microscopy Imaging ... 30
2.5. Cellular Aging ... 35
Literature Review ... 37
3.1. Microscopy Image Processing ... 38
3.2. Simulation Methods ... 64
3.3. Machine Learning ... 75
Conceptual Contribution ... 83
4.1. Contribution for the Image Processing Framework ... 83
4.2. Contribution for the Simulation Framework ... 109
4.3. Contribution to the development of new Machine Learning Techniques ... 116
Experimental Developments ... 121
5.1. Experimental setup ... 121
xii
6.1. Image Processing Validation ... 125
6.2. Image Generator Validation ... 149
6.3. Dissemination of Results ... 155
Conclusion and Future Work ... 159
7.1. Main Conclusions ... 159
7.2. Future Work ... 161
References ... 163
xiii
List of Figures
Figure 1.1 – Schematic representation of the ongoing process of the SADAC project research work. .. 2
Figure 2.1 – Bacterial Cell Morphologies... 9
Figure 2.2 – Representation of the cell walls and cellular growth in E. coli. ... 10
Figure 2.3 – Apparatus and Mechanisms of Cell growth and Cell Division. ... 11
Figure 2.4 – Mathematical and computational models of cell shape and growth. ... 12
Figure 2.5 – Motility behaviour in E. coli cells. ... 13
Figure 2.6 – Information flow in biological systems. ... 13
Figure 2.7 – Molecular spatial distribution inside E. coli cells. ... 17
Figure 2.8 – Visualization of E. coli cells expressing GFP proteins at 30 °C. ... 18
Figure 2.9 - Visualization of Nucleoids in E. coli cells at 30 °C (A) with DAPI staining and (B) with mCherry fused proteins tagging. ... 20
Figure 2.10 – Graphical representation of the RNAp interaction with the promoter. ... 21
Figure 2.11 - Visualization of E. coli cells expressing RNAp-GFP fused aggregates. ... 22
Figure 2.12 - Single-RNA detection system schematic. ... 23
Figure 2.13 - Visualization of E. coli cells expressing MS2-GFP-RNA aggregates at 30 °C. ... 24
Figure 2.14 - Visualization of FtsZ proteins in E. coli cells at 30 °C (A) with GFP and (B) with FtsZ-mCherry tagging. ... 26
Figure 2.15 – Schematic representation of the MinCDE system in E. coli cells. ... 28
Figure 2.16 – Visualization of MinD system proteins fused with superfolder GFP protein (sfGFP), oscillating from pole to pole. ... 29
Figure 2.17 - Visualization of E. coli cells containing inclusion bodies in three different stress conditions.. ... 30
Figure 2.18 - Examples of multimodal image fusion. ... 33
Figure 2.19 – Three-dimensional visualization of FtsZ Rings and Nucleoids. ... 34
Figure 3.1 - Typical workflow in live-cell imaging, focusing on computer vision techniques related to the planned research work. ... 37
Figure 3.2 – Temporal analysis of publications in the PubMed database (National Library of Medicine, National Institutes of Health, Bethesda, MD, USA) for the indicated combinations of words in the title and/or abstract in the area of Image Registration. ... 39
Figure 3.3 – Visual representation of different transformations types. ... 41
Figure 3.4 - Example of the application of non-parametric diffeomorphic transformations [236]. ... 42
Figure 3.5 – Temporal analysis of cell segmentation techniques. ... 44
Figure 3.6 – Different 2D Representations of ‘flat morphological structuring elemenst’. ... 47
Figure 3.7 – Segmentation of bacterial colonies with the watershed Algorithm. ... 48
Figure 3.8 – Correction of the GPL over-segmentation. ... 49
Figure 3.9 – Segmentation of cocci bacterial cells using the Active Contour algorithm. ... 50
Figure 3.10 – Temporal analysis of publications in the PubMed database (National Library of Medicine, National Institutes of Health, Bethesda, MD, USA) for the indicated combinations of words in the title and/or abstract in the area of Image Tracking. ... 51
xiv
Figure 3.12 – Graphic User Interface of ‘CellProfiler’ 2.0. ... 54
Figure 3.13 – Graphic User Interface of the ‘Cell-ID’ 1.4 toolbox. ... 55
Figure 3.14 - Graphic User Interface of the second ‘CellTracker’ toolbox. ... 56
Figure 3.15 - Graphic User Interface (GUI) of the ‘CellC’ software. ... 57
Figure 3.16 - Graphic User Interface (GUI) of the ‘CellTracer’ software. ... 58
Figure 3.17 - Graphic User Interface (GUI) of the ‘MicrobeTracker’ toolbox, version 0.925. ... 60
Figure 3.18 - Graphic User Interface (GUI) of the ‘Schnitzcells’ software. ... 61
Figure 3.19 - GUI of the ‘MAMLE’ software. ... 62
Figure 3.20 - Graphic User Interface (GUI) of the ‘CellAging’ software. ... 63
Figure 3.21 - Interactive GUI of the ‘AutoCellSeg’ software. ... 64
Figure 3.22 – Generation of 2D and 3D non-moving phantoms. ... 68
Figure 3.23 – Predecessor of the ‘SIMCEP’ simulator. ... 69
Figure 3.24 – Parameterization of bacterial shape models based on the ‘SIMCEP’ image generation toolbox.. ... 70
Figure 3.25 – ‘CytoPacq’ workflow and its artificial object generation. ... 71
Figure 3.26 – ‘SimuCell’ artificial object generation toolbox. ... 72
Figure 3.27 - ‘CellOrganizer’ artificial object generation toolbox. ... 73
Figure 3.28 - Graphic User Interface of ‘CompuCell3D’ and snapshot of temporal simulations. ... 74
Figure 3.29 – Example of a Decision Tree and its training set. ... 77
Figure 3.30 – Example a support vector machine application. ... 79
Figure 3.31 – Examples of possible misidentifications using a simple NN Algorithms.. ... 81
Figure 3.32 - Application of clustering algorithms to the tracking of cells inside clusters. ... 81
Figure 4.1 - Graphic User Interface of the Single Cell Image Processor toolbox... 84
Figure 4.2 – Workflow of the Single Cell Image Processor toolbox ... 84
Figure 4.3– Allocation of Morphological Images. ... 85
Figure 4.4 – Example of Intra-Modal Registration. ... 86
Figure 4.5 – Automatic Alignment Errors. ... 87
Figure 4.6 – Manual Alignment Strategy with Control Point (blue dots) Mapping. ... 89
Figure 4.7 – Example of (A) erroneous and (C) correct alignment between the morphological segmentation and the functional images (with Nucleoids). (B) shows how this affects the overlay of this image with the other functional image (with FtsZ Rings) (D) shows the correct overlay of both images. ... 90
Figure 4.8 - Segmentation workflow of the two cell segmentation algorithms, respectively Paths 1 and 2. ... 91
Figure 4.9 – Example of the ‘GPL + CART’ usage of a Phase-Contrast image... 92
Figure 4.10 - Example of an on-going process of manual segmentation correction. ... 93
Figure 4.11 – Manual corrections when the segmentation overlaps with existing objects.. ... 94
Figure 4.12 - Example of cell tracking and division detection results. ... 95
Figure 4.13 - Example of a cell lineage plot of a timeseries with a duration of 180 minutes. ... 96
Figure 4.14 - Example of lineage construction errors of the tracking algorithm. ... 96
Figure 4.15 – Gaussian Fitting parameters window. ... 98
Figure 4.16 – Visualization of the Gaussian Fitting of one (left) and two (right) nucleoids. ... 99
Figure 4.17 – Example of usage of the Gaussian Algorithm. ( ... 99
Figure 4.18 – Segmentation workflow of the ‘TreshMorph’ Segmentation Algorithm. ... 100
Figure 4.19 - Activation of the Morphological Fitting parameters window for a Nucleoid Detection Example. ... 101
xv
Figure 4.20 – Example of usage of the ‘TreshMorph’ Algorithm. ... 102
Figure 4.21 – Automatic seed correction and inclusion bodies segmentation. ... 103
Figure 4.22 - Manual Seed Correction. ... 104
Figure 4.23 - Examples of segmentation of mRNA spots using the median Algorithm. ... 105
Figure 4.24 - Examples of visualization of a single channel of (A) Nucleoids (segmented in blue colour), (B) FtsZ Rings (segmented in red colour) and (C) MS2-GFP spots (segmented in green colour). ... 107
Figure 4.25 - Examples of visualization simultaneous visualization of two channels with (top) and without (bottom) segmentation: (A) both Nucleoids (in blue) and FtsZ Rings (in red), (B) Both Nucleoid (blue) and MS2-GFP spots (in green). (C) both Nucleoids (in blue) and FtsZ Rings (in red), (C) both Nucleoids (segmented in blue) and FtsZ Rings (segmented in red), (E) Both Nucleoid (segmented in blue) and MS2-GFP spots (segmented in green colour) (F) FtsZ Rings (segmented in red colour) and MS2-GFP spots (segmented in green colour). ... 108
Figure 4.26 - Example of visualization simultaneous visualization of three channels: (A) Nucleoids (in blue), FtsZ Rings (in red) and MS2-GFP spots (in green) with no segmentation and (B) Nucleoids (segmented in blue colour), FtsZ Rings (segmented in red colour), and MS2-GFP spots (segmented in green colour). ... 108
Figure 4.27 – Graphical interface of the ‘miSimBa’ Toolbox and a simulation example. ... 109
Figure 4.28 - Graphical interface of the ‘Image Tracking Generator’ toolbox and a simulation example. ... 110
Figure 4.29 - Examples of models of bacterial cell shapes. ... 111
Figure 4.30 – Mathematical modelling of the rod shape of E. coli cells (red colour). ... 112
Figure 4.31 – Modelling of cell growth and cell division. ... 113
Figure 4.32 - Example of object division from frame (A) to frame (B), and the rapid growth towards the same size of the parent cell in frame (C). ... 113
Figure 4.33 – Modelling of cell motility. ... 114
Figure 4.34 - Collision between objects with "Physical Move". Objects in: (A) Frame 10; (B) Frame 16; (C) Frame 19; (D) Frame 23. ... 115
Figure 4.35 - Interface options for cluster properties. ... 115
Figure 4.36 - Exemplificative frames of cell movement. ... 116
Figure 4.37 – Example of the discard dataset.. ... 117
Figure 4.38 – Example of the merge dataset. ... 117
Figure 4.39 – Classification of the three FtsZ formation stages. ... 119
Figure 5.1 – A photo of the microscopy setting. ... 123
Figure 6.1 – Example of Intra-Modal Registration of drift in time-series of Phase-Contrast images (3 images acquired every 5 minutes). ... 127
Figure 6.2 – Example of the application of different image registration transformations. ... 128
Figure 6.3 - Example of the unsuccessful application of intensity-based and feature-based registration methods.. ... 129
Figure 6.4 - Example of the application of our second proposed registration method. ... 131
Figure 6.5 - Example of the application of a manually-based control-point image registration method. ... 131
Figure 6.6 - Example of the application of different manual image registration transformations after the manually-based control-point image registration processing. ... 132
Figure 6.7 –Representation of the discard classifier. ... 134
Figure 6.8 –Representation of the merge classifier. ... 135
xvi
Figure 6.10 - Examples of simultaneous visualization of Nucleoids (in red colour) and FtsZ Rings (in green colour). ... 141 Figure 6.11 - Example of single-cell co-localization of bacteria Nucleoid and RNAp (cell with ID 93).144 Figure 6.12 - RNAP fluorescence intensity versus nucleoid fluorescence intensity values of Bacteria with ID 93. ... 144 Figure 6.13 - RNAP and nucleoid fluorescence along the major cell axis. ... 145 Figure 6.14 – Temporal analysis of the best segmentation algorithm scores. ... 146 Figure 6.15 – Box Plot with the accuracy percentage of 100 runs, calculated for each Machine Learning Algorithm ... 148
Figure A.1 - Save and Load User Interface: (A) options before loading and (B) options after loading. ... 193 Figure A.2 – Activation of the Cell Segmentation Interface options: (A) ‘GPL+CART’ (B) ‘Otsu + Median’. ... 193 Figure A.3 – Manual Adjustment Window. Blue outlines result from the automatic segmentation, while red outlines are manual adjustments. ... 193 Figure A.4 – ‘Help Menu’ of the Manual Segmentation ... 194 Figure A.5 – Manual Corrections Popups. ... 195 Figure A.6 – Activation of the Microscopy Image Loading Interface with the Load Images for Segmentation Pipeline ... 195 Figure A.7 – Image alignment interface. ... 195 Figure A.8 – Activation of the Gaussian Segmentation method. ... 195 Figure A.9 – Spot detection parameters window: (A) Median Algorithm, (B) Kernel Algorithm and (C) Gaussian Algorithm. ... 196
xvii
List of Tables
Table 3.1 – Availability of microscopy image processing toolboxes. ... 64 Table 3.2 - Possible values of 𝒉𝝁𝔁 for each reaction type. ... 66 Table 3.3 - Availability of microscopy image processing toolboxes. ... 75 Table 6.1 - Quantitative evaluation (Pearson Correlation value) of several image Intra-Modal registration algorithms ... 127 Table 6.2 - Quantitative evaluation of several automatic image registration algorithms, based on the Pearson Correlation method. ... 130 Table 6.3 - Quantitative evaluation of several manual correction image registration algorithms, based on the Pearson Correlation method. ... 133 Table 6.4 - Quantitative evaluation of the implemented segmentation algorithms at the cell detection level: ‘Otsu + Median’, ‘GPL + CART’ and the same algorithms with the addition of new steps based on splitting methods... 136 Table 6.5 - Quantitative evaluation of the implemented segmentation algorithms at the pixel level: ‘Otsu + Median’, ‘GPL + CART’ and the same algorithms with the addition of new steps based on splitting methods... 137 Table 6.6 - Quantification of the error percentages in cell tracking and division detections with and without intramodal registration at 37 ºC. ... 138 Table 6.7 - Quantification of the error percentages in cell tracking and division detections in each temperature condition using intramodal image registration. ... 138 Table 6.8 - Statistical metrics of the nucleoid segmentation algorithms. Results are shown for the Gaussian Algorithm with different ‘d’ parameter values and the ‘TreshMorph’ Algorithm (TM) with different threshold (T) values. ... 139 Table 6.9 - Statistical metrics of the algorithm of FtsZ Rings detection (Accuracy, Sensitivity, Specificity, Precision, F1 Score for one example time-series. ... 140 Table 6.10 - Statistical metrics of the algorithm of MinD proteins detection (Accuracy, Sensitivity, Specificity, Precision, F1 Score. ... 141 Table 6.11 - Quantitative evaluation of the spot detection filters (Median, Kernel, Gaussian) at 37 °C. ... 142 Table 6.12 - Quantitative evaluation of the spot detection method using the Median Filter at 22 °C, 37 °C and 43 °C. ... 142 Table 6.13 – Statistical metrics of the algorithm of inclusion body detection (Accuracy, Sensitivity, Specificity, Precision, F1 Score for 3 examples of low, medium and high stress and also the results from joining all examples. ... 143 Table 6.14 – Pearson Correlation Coefficient (PCC) between RNAp fluorescence and Nucleoid fluorescense in each cell, along the Major and Minor Axis of the specific cells. The Manders Coefficients were also calculated (M1 and M2 correspond to the Nucleoid and the RNAp, respectively as the reference channel). ... 145 Table 6.15 - Benchmark results of automatic detection algorithms for the different structures present in E. coli cells. ... 147 Table 6.16 - Tracking errors of the Simple Nearest-Neighbor Algorithm. ... 150
xviii
Table 6.17 - Tracking errors of the Nearest-Neighbor with Morphology Algorithm. ... 150 Table 6.18 - Tracking errors, within clusters with different properties, using the Simple Algorithms with different number of clusters (1 to 10), different number of objects per cluster (2 to 15), and different maximum velocities (2, 5, 10) and different morphology factors (0 and 0.005). ... 152 Table 6.19 - Tracking errors, within clusters with different properties, using the Nearest Neighbour Algorithm with Morphology (𝜶 = 40% and 𝜷=60%) with clusters (1 to 10), different number of objects per cluster (2 to 15), and different maximum velocities (2, 5, 10) and different morphology factors (0 and 0.005)... 153 Table 6.20 - DBSCAN1 (DB1) and DBSCAN1 (DB2) tracking errors comparison for different number of clusters, objects per cluster, and maximum velocities, with m factor =0. ... 154 Table 6.21 - DBSCAN1 (DB1) and DBSCAN1 (DB2) tracking errors comparison for different number of clusters, objects per cluster, and maximum velocities, with m factor =0.05. ... 155 Table 6.22 – Dissemination results of this research work in Journals and my roles in the publications ... 156 Table 6.23 – Dissemination results of this research work in Book Chapters ... 156 Table 6.24 – Dissemination results of this research work in Conferences and Practical Courses ... 157 Table A.1 - Confusion Matrix for nucleoid segmentation. Values are shown for the Gaussian Algorithm with different ‘d’ parameter values and the ‘TreshMorph’ Algorithm (TM) with different threshold (T) values. ... 196 Table A.2 - Confusion Matrix for the detection of FtsZ rings with the Gaussian Segmentation Algorithm (with different ‘d’ parameter values and the ‘TreshMorph’ Algorithm based on different threshold values. ... 197 Table A.3 - Confusion Matrix for the detection of minD proteins with the Gaussian Segmentation Algorithm (with different ‘d’ parameter values and the ‘TreshMorph’ Algorithm based on different threshold values. ... 199 Table A.4 – Confusion Matrix for the detection of Inclusion bodies based on the GPL seed placement and their respective deletion for 3 examples of low, medium and high stress and also the results from joining all examples. ... 200
xix
Glossary – Acronyms, Abbreviatures
and Definitions
This section gives an alphabetical list of Acronyms and Abbreviatures, but also comprehensive definitions of some biological terms, due to the multi-disciplinary nature of this work.
3D-PALM Three Dimensional Photoactivation Localization Microscopy
3D-SIM Three-Dimensional Structured Illumination Microscopy
3D-STORM Three-Dimensional Stochastic Optical Reconstruction Microscopy
API Application Programming Interface
ATP Adenosine Triphosphate
Bacteriophage Virus that infects bacterial cells
BFP Blue Fluorescent Protein
CA3 Computational Intelligence Research
CART Classification and Regression Tree
CCD Charge-Coupled Device
CLSM Confocal Laser Scanning Microscopy
CME Chemical Master Equation
DAPI 4’, 6-diamidino-2-phenylindole
DBSCAN Density-Based Spatial Clustering of Applications with Noise
DNA Deoxyribonucleic acid
DT Decision Tree
E. coli Escherichia coli
FCT Fundação para a Ciência e a Tecnologia
FCT-UNL Faculdade de Ciências e Tecnologia da Universidade Nova de Lisboa
FISH Fluorescence in situ hybridization
Fts proteins Filamenting temperature sensitive proteins
Functional Images Images with Cellular Functional Information (Spatial and Temporal)
GFP Green Fluorescent Protein
GPL Gradient Path Labelling
GUI Graphic User Interface
HILO Highly Inclined and Laminated Optical Sheet
IbpA Small heat shock protein - IbpA
in vitro Latin for “within glass” in vivo Latin for “within the living”
iPALM Interferometric Photoactivation Localization Microscopy
JPDAF Joint Probabilistic Data Association Filter
xx
LB Lysogeny broth
LB Lysogeny Broth
LBD Laboratory of Biosystem Dynamics
LSFM Light Sheet Fluorescence Microscopy
M1 and M2 Manders Coefficients
mCherry member of the mFruits family of red fluorescent proteins
MHT Multiple Hypothesis Tracking
Min Proteins Proteins from the MinCDE system
Morphological images Images with Cellular Morphological Information
MreB Cell shape-determining protein - MreB
mRNA Messenger Ribonucleic acid
NaCl Sodium chloride
NAP Nucleoid Associated Proteins
NN Nearest-Neighbour
OAA One-Against-All
OAO One-Against-One
ODE Ordinary Differential Equation
OpgH Cell Envelope Biogenesis Glucosyltransferase Enzyme - OpgH
PCA Principal Component Analysis
PCC Pearson Correlation Coefficient
PDAF Probabilistic Data Association Filter
Project SADAC
Project Study of the kinetics of asymmetric disposal of aggregates in cell division and its correlation to functional aging from in vivo measurements, one event at a time
RGB System Color Space of Red, Green and Blue
RMLR Regularized Multinomial Logistic Regression
RNA Ribonucleic acid
RNAp Ribonucleic acid polymerase
rRNA Ribosomal Ribonucleic acid
SDCM Spinning Disk Confocal Microscopy
sfGFP superfolder Green Fluorescent Protein
SlmA Nucleoid occlusion factor SlmA
SSA Stochastic Simulation Algorithm
SVM Support Vector Machines
TIFF Tagged Image File Format
TIRF Total Internal Reflection Fluorescence Microscope
TPM Two-Photon Microscopy
tRNA Transfer Ribonucleic acid
YFP Yellow Flurescent Protein
1
Introduction
This section introduces to the field in which this research work aims to be developed, specifically the main motivation behind this research work and open questions related to the field of work. In this section, the Main Research Question and the main Hypothesis are presented, together with supplementary research questions and the Research Methodologies that were implemented and tested to validate the main research Hypothesis. Finally, a succinct description of each chapter that composes the structure of the Dissertation is also provided.
1.1.
Motivation
Recent advances in microscopy imaging technology has allowed the detection of single molecules at the live-cell level, due to biochemical techniques that are able to highlight the targets responsible for gene expression, such as the Deoxyribonucleic acid (DNA), Ribonucleic acid (RNA) and proteins (mainly with the use of fluorescent fusion proteins) [1] but also due to the capability of acquiring multidimensional images with better quality and higher resolution, which have advanced imaging capabilities of single-molecule microscopy [2].
The above-mentioned revolutionary techniques have been especially useful in the detection and tracking of single RNA molecules in Escherichia coli (E. coli), one of the most studied organisms, by fusing Green Fluorescent Proteins (GFP) with the RNA bacteriophage MS2 coat protein [3]–[5], a technique which have also been used recently by the Laboratory of Biosystem Dynamics (LBD) from Tampere University of Technology to produce time-lapsed microscopy images of E. coli cells.
The main objective of the LBD group is to study the processes of segregation and polar retention of cellular aggregates [6] and how the morphological symmetry of those processes can be broken due to different environmental conditions [7], as these asymmetries between sister cells can be indicative of cell aging, as unwanted protein aggregates tend to concentrate at the older pole of the mother cell and accumulation can cause a slower division rate of the daughter cells [8].
These state-of-the-art experimental studies prompted the LBD to start a collaboration with the Computational Intelligence Research (CA3) Group of UNINOVA / FCT-UNL (Faculdade de Ciências e Tecnologia da Universidade Nova de Lisboa) resulting in project SADAC (Study of the kinetics of asymmetric disposal of aggregates in cell division and its correlation to functional aging from in vivo measurements, one event at a time), which has been funded by Fundação para a Ciência e a Tecnologia (FCT), with the reference PTDC/BBB-MET/1084/2012, and was one of the driving forces to start this Doctoral Work, also funded by FCT (reference SFRH/BD/88987/2012).
The major components of the SADAC project were the development of image processing techniques (i.e. image registration, cell segmentation, segmentation of cellular components, cell tracking) and the establishment of automated statistical methods to extract information from time series of confocal microscope images. The last objective of this project was to use these developed tools and methods to detect cell divisions and characterize partitioning of aggregates by daughter cells. One of the most important steps in the development of these computational tools and methods is their validation. Nowadays, most of these tools are still validated by benchmark data of manually annotated images. In high-throughput experiments (with enormous amounts of data),
2
manual validation is a very time-consuming task, which prompted the development of artificial image generators to create new “gold-standard” images. Such artificial images need to be as close as possible of images acquired in the laboratory, so they should be based on mathematical models of the cell biophysical behaviour and empirical information acquired from experiments.
Most of the developed solutions have isolated applicability, particularly automatic and semi-automated methods, which biases the comparison of segmentation methodologies based on images acquired in different conditions [9]. These comparisons should be done on Contests and open challenges, based on benchmark data (acquired by an independent laboratory or created by artificial image simulators), which prevents abuses of method comparison in the literature [9]. The use of computational modelling to create artificial deformable benchmark images to simulate biological models is an alternative to create a “ground truth” for quantitative evaluation of the image processing algorithms and has been one of the growing trends in microscopy imaging in the last years [10].
Taking into consideration the biophysical modelling of prokaryotic cells (and specifically to bacteria such as Escherichia coli), it is necessary to reproduce the cellular spatial and temporal organization by modelling the cell morphology (shape, size and spatial arrangement), cell growth, division, motility and internal functions and structure organization.
Due to the above-mentioned factors, the motivation for this work is divided into three distinct parts: The first is to contribute to the advances of several image processing techniques, especially related to the characterization of the dynamics of cellular processes at the single-cell level. The second part is related to the use of new statistical methods to extract and describe new biophysical models of cellular processes (based for example on Machine Learning). The last part is to be responsible for the creation of new biophysical models, which can be able to reproduce morphological and functional (spatially and temporally) features of the cell (by implementing models coming from the new analysed data in the second step or using the existing mathematical or empirical models from the literature). The ongoing process of the research work, starting with the designing new experiments, which leads to the development of new image processing techniques, new statistical methods and new models and simulators is shown in Figure 1.1.
3
1.2.
Open Questions in the Area
The development of Artificial Image Generators (that can create reliable gold-standard benchmarks that can be used to validate image processing tools) is one of the emerging fields in Biomedical Engineering. Taking into consideration Generators of microscopy images, these tools have focused on the simulation of morphological features of the cellular biophysical models.
The morphological information can be enough to create multidimensional images but it is not enough to simulate time-lapsed functional images, where important time-dependent processes are present such as cell growth, cell division and cell movement. The main questions in this specific topic are: ‘which processes are enough to create a realistic simulation of the cellular spatial and temporal organization?’ and ‘how to derive new biophysical models?’ (if existing models are not able to provide all the necessary data).
One of the open topics in the area is the development of a Generator of functional and morphological time-lapsed simulated images. Mathematical and empirical realistic biophysical models need to be implemented to create simulated images as close as possible of real images acquired in the laboratory. Such a Generator should be made first on simple organisms such as bacteria and then could be fittingly adapted to more complex organisms. When a fully operational Generator of Time-Lapsed Microscopy Images is developed, new questions related to the creation of null models will arise and how they will be able to shed light about some biological processes.
As seen in Figure 1.1, the creation of new biophysical models (e.g. due to simulation of new cellular processes or in simulation of different environmental conditions), can lead to the necessity of developing novel statistical methods and novel image processing techniques which can be used to characterize the dynamics of cellular processes of the new biophysical models and create new simulators of such models.
1.3.
Main Research Question
The problematic behind this research work was introduced alongside the emerging challenges in the area that are still open research questions. The main challenge emerges from the necessity of creating a benchmark (“gold-standard”) of microscopy images for validation of newly developed image processing tools, as nowadays most benchmark data are produced manually, which is an unfeasible task for high-throughput experiments. A proper system for creating such a benchmark is to use simulated data, using realistic mathematical and empirical cell models, which need to be thoroughly studied and implemented into the simulator.
These models should be able to reproduce lapsed experiments by simulating time-dependent processes such as cell growth, cell division, and cell movement. In the initial simulation framework, the main focus will be directed towards bacterial cells, more specifically using E. coli cells models. Simulation of temporal and spatial modelling of external factors/stress conditions can also be done to produce even more realistic results. Simulation of different acquisition systems should also be done to generate the unique features of morphological and functional microscopy images.
After validation of the image generation tool, it is possible to begin the validation of image processing tools and expand the image generation to other bacterial models or to simple cell
4
organisms such as yeast. Other studies could be made by developing null-models that can assist in research about biological processes, such as cellular aging.
From the above information, the main research question is subsequently written:
How to design a toolbox capable of simulating models and reproducing realistic morphological and functional experiments of bacterial time-lapsed microscopy images?
In addition, a second research questions is proposed with the aim of better solidifying the main research question, related to the design of an image processing toolbox capable of extracting information about cellular processes in different environmental conditions, which can be used to create the new models that are deployed in the simulation toolbox:
Which models of biological processes need to be extracted using an Image processing toolbox, in order to create a realistic simulation of the cell spatial and temporal organization?
1.4.
Hypothesis
Following the Main Research Question, a main Hypothesis was devised:
An Artificial Image Generator capable of replicating realistic bacterial time-lapsed experiments can be developed if the produced images consider the characteristics of the different image acquisitions systems and environmental conditions in the laboratory and by reproduce the spatial and temporal cell morphological and functional features.
The main Hypothesis can be solidified by devising the secondary Hypothesis, which responds to the secondary research questions.
In conjunction with the Artificial Image Generator, a novel Image Processing Toolbox can be developed in order to characterize the dynamics of cellular processes (division, growth, motility and gene expression), which can then be used to create novel biophysical models that can be introduced in the Simulator, namely they can establish a correlation between these processes and cellular aging.
1.5.
Research Methodologies
To answer the research questions, the biological processes and environmental conditions that need to be included in the image generator must be outlined. The first step is to search the literature for the state-of-the-art mathematical and empirical models of bacterial cell modelling. These studies should include the temporal and spatial features of bacterial growth and division (which is linked to its morphological features of cell size and shape).
It is also important to study how these processes and cell motility are connected to the spatial arrangement into clusters. If some of these functions and connections cannot be described mathematically, it should be possible to use machine learning techniques to reproduce the empirical data. The external environmental conditions should also be considered, such as the bacterial response to external factors such as temperature (heat-shock, cold-shock), pH stress, oxidative stress, nutritional stress or even exposure to antibiotics.
5
The extraction of data from internal cellular structures should be done initially by applying existing methods and finally by complementing it by the development of new image processing techniques if the existing methods don’t provide satisfactory results.
To test and validate the research hypothesis, several groups of microscopy and biotechnology experts have been approached to provide manually segmented benchmarks which will be used as a gold-standard to validate the image processing techniques. Secondly, these groups will be asked to provide a qualitative analysis of the generated simulated images, compared to the ones acquired in the laboratory. Quantitative analysis will be done by direct comparison with real E. coli images acquired in various image acquisitions systems and various environmental conditions. Then it is possible to compare the simulated distributions of the model parameters indicatorssuch as cell sizes and shapes (distributions of bacterial spatial organization), motility velocity, division and growth rates (distributions of bacterial temporal organization), and the production and localization of subcellular structures (fluorescent proteins, nucleoid, etc).
The main objective of developing this image generator is to create time-lapsed microscopy image benchmarks that can be used to validate the newly developed image processing tools. There can be other applications to the image generator such as creating null-model that can be used to investigate how the removal or the insertion of features can affect the bacterial behaviour (e.g. to study the effects of the nucleoid by removing it from the cells or changing the bacterial size distribution) or sampling some parameters (e.g. evaluate the effects of adjusting the growth rates to unrealistic values).
1.6.
Structure of the Dissertation
This Dissertation is structured into 7 chapters. This first chapter served as an Introduction to the present work and its main motivation, while giving emphasis to the open research questions in the area. Two main research questions were presented, alongside with the two main Hypothesises. An introduction to the main Research Methodologies was also given and finally this chapter ends with the description of the Dissertation structure.
The second chapter introduces the main biological and bioinformatics topics that will be the foundation of the research work, which can benefit from the implementation of novel Electrical and Computer Engineering techniques. The third chapter contributes for a comprehensive summary of the state of the art, namely focusing on the available image processing techniques and the simulation of biophysical cell models. In the fourth chapter, implementation and development of the Image Processing Framework is detailed along with the development of the Image Generator Framework and all the necessary modelling features.
The fifth chapter provides a high-level description of the laboratory experiments that were used to validate the computational frameworks. In the sixth chapter, a compilation of all the results is provided, which can be used to validate the implementation of the toolboxes and thus validate the hypothesis. The closing chapter presents the main conclusions of the work, while also providing future development perspectives and directions.
7
Background Information
This section gives a brief overview of the multi-disciplinary nature of this work, which combines the knowledge from biological and bioinformatics studies and the application of techniques related to Electrical and Computer Engineering into those studies. Useful information about the spatial and temporal organization of bacteria is provided, namely regarding the models of cellular processes such as cell growth, division and motility. Information on bacterial cell morphology is also presented, such as its shape, size and spatial arrangement and on the internal cell functions and some of the important structures that are found inside bacterial cells.
2.1.
Cell Modelling – Spatial and Temporal
Organization of Bacteria
In order to create realistic models of bacterial cell behaviour, it is necessary to understand the available information on bacterial spatial and temporal organization, namely the cell shape and size, kinetic models of cell motility, division and growth and models of location and functionality of cellular structures [11].
As aforementioned, E. coli is potentially the most studied organism, making it the basis for an impressive number of scientific breakthroughs, even in the medical field. E. coli is an organism that lives symbiotically in the intestines of other organism, although some strains may cause gut diseases and sepsis [12].
E. coli also has significant information in orthologous genes, which are present in various organisms such as humans, animals, plants and other bacteria. This suggests that this is an important model organism to be studied and will be kept being adopted in various experimental laboratories [12], making the E. coli K-12 strain and B strain the perfect candidates to study cellular structures and cellular processes, such as cell growth and division through computational and mathematical modelling of spatial and temporal bacterial organization [11], [13] along with the advances in microscopy and sequencing techniques.
Previous efforts to tackle the E. coli cell modelling problem have been extensively reviewed [13] and include the creation of a common language to represent biological models, namely the Systems Biology Markup Language [14], the development of numerous mathematical and empirical models found in the literature will have to be researched along with accessing specialized information stored in databases, such as the International E.coli Alliance Database Portal [15] or the advances in the computational cell modelling. The next sub-chapters focus on these topics, with the E. coli species as the pivotal example, but also making analogies with other bacterial species.
8
2.2.
Cell Morphology - Shape, Size and
Spatial Organization
Bacterial cells can be classified by their shape and by spatial organization. As can be observed in Figure 2.1, E. coli has a rod-shape (bacillus), while other bacteria have shown a vast diversity of shapes, such as spherical (coccus), intermediate shapes (coccobacillus) or curved/corkscrew shapes (spirochete, spirillum and vibrio), each of them with its specific purpose [16]–[18].
Bacteria can also have a wide range of cell sizes (volumes that range from 0.02 to 400 µm3), where even a vast variability can be observed within the same species [19], [20]. These variations can be explained due to cell adaptation to external factors, such as lack of nutrients leading to starvation, situations of extreme temperatures (low and high) or of extreme dryness [20].
It has been shown that the lower bound for cell size is maintained by the cellular mechanisms that cope and adapt to the environment, while the higher bound is normally limited by diffusion of nutrients along the cell. For example, studies using E. coli as a model organism have shown how temperatures between 22 °C and 42 °C affect two E. coli strains in different growth media [21].
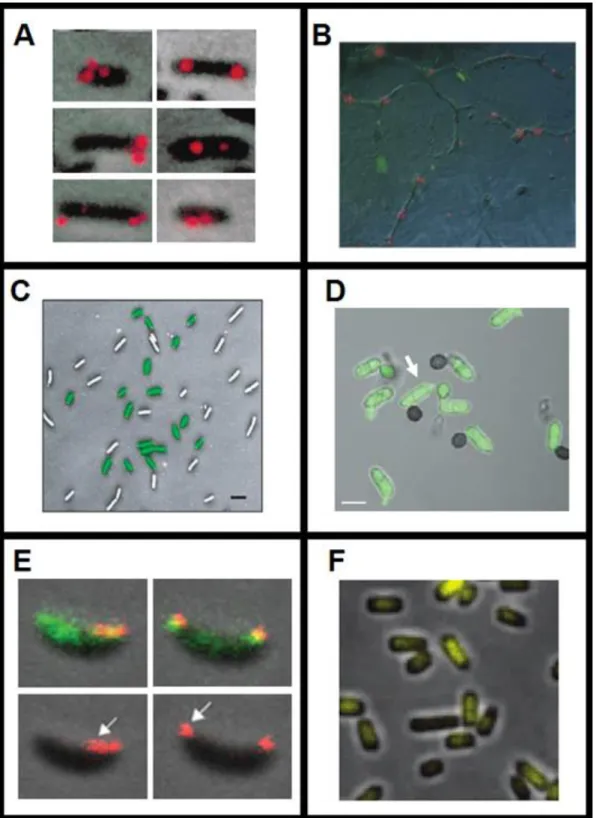
In terms of spatial arrangement, bacteria can be organized in single forms or be grouped in pairs (diplo prefix), in chains (strepto prefix), as can be seen in Figure 2.1. Cocci bacteria can also organize in groups of 4 (tetrad), 8, 16 or 32 (sarcinae) or in grape-like clusters (staphylo prefix). Bacilli bacteria can organize in palisade structures (side by side) or can be in unstructured spatial clusters [18]. An example of different E. coli spatial arrangements is shown in Figure 2.1 (namely in (2-A) single bacillus; (2-B) diplobacilli; (2-C) streptobacilli and (2-D) palisade).
A typical bacterial cell envelop is mainly composed by a cytoplasmic membrane and peptidoglycan (also known as murein) cell wall. As can be seen in Figure 2.2-A, bacteria can also be divided in two groups regarding a fundamental difference in the cell envelope: Gram-negative and Gram-positive bacteria. In the first group (which is the case of E. coli) a bacterial outer membrane is also present (with intercalating pore-forming proteins, called porins), with lipopolysaccharides connected to the exterior of that outer wall.
The interior of the outer wall is then connected to a very thin murein wall by a lipoprotein [22]. On the other hand, in the second group (which is the case of human pathogenic bacterium Streptococcus pneumonia), the cell envelope consists of a very thick murein wall (sometimes more than 10 times thicker than the first group) with teichoic acids spread across the murein. The Gram-positive bacteria also have a cytoplasmic membrane as the Gram-negative [22].
The shape in bacterial cells (see Figure 2.1 and Figure 2.2-B) is maintained and determined by the way murein is incorporated during cellular elongation, especially in rod-shape organisms, such as E. coli [23] and B. subtilis [24], as the murein is the main cell wall structure that supports the stress from the outside [25], as computational physical models have been developed to study how defects in the murein can affect E. coli shape (and the shape robustness to murein damage) and how different murein defect patterns can build bacterial shape patterns such as curved rods and spirochetes [26].
9
Figure 2.1 – Bacterial Cell Morphologies. Bacterial Shapes (a, b, c, d, e and f) and Bacterial Spatial Arrangements (1, 2, 3, 4, 5
and 6). E. coli examples: (2-A) Single bacillus; (2-B) diplobacilli; (2-C) streptobacilli; (2-D) palisade. The visualized cells are from the E. coli BW25993 strain (lacIq hsdR514 ΔaraBADAH33 ΔrhaBADLD78) [27] and were acquired with a Nikon Eclipse (Ti-E, Nikon) inverted microscope with a 100x Apochromat TIRF (Total internal reflection fluorescence - 1.49 NA, oil) objective, and an external Phase-Contrast system and DS-Fi2 CCD (Charge-coupled device) camera (Nikon) at the Laboratory of Biosystem Dynamics at 37 °C.
Along with the cell wall, other cytoskeleton proteins are associated with bacterial shape, such as FtsZ (Filamenting temperature sensitive), MreB and crescentin (with similar activities as tubulin and actin in eukaryotic cells) [16], [24]. These proteins influence how the cell wall is created and hydrolysed during cell growth and division, respectively, influencing their sizes, shapes and spatial and temporal organization[24]. The role of cell size in bacterial growth has been discussed alongside a model for cell growth control in different nutrients, as observed in Figure 2.2-C [28].
10
Figure 2.2 – Representation of the cell walls and cellular growth in E. coli. (A) Structure of the cell envelope of Gram-negative
(left) and Gram-positive (right) bacteria and their differences. Adapted from [22]. (B) Bacteria cell shapes and cytoskeletal elements. Adapted from [16]. (C) Cell size control by growth and division processes and how they can cope with a poor nutrient medium. Adapted from [28]
Bacterial morphology is closely related to important mechanisms to the bacterial cell activity, such as cell growth/elongation and cell division, so it is also important to understand how these mechanisms are regulated in the time and space [16], [24], [29].
Cell Growth and Division
Bacterial cell cycle is normally divided in three stages, specifically the period between its “birth” and the initiation of DNA replication (the biological process of assembling two identical replicas of DNA from one original DNA molecule), the replication period where the cell increases its mass and size (Cell Growth) and finally the binary fission process into two new daughter cells (Cell Division), which will be repeated over the next generations [30], as shown in Figure 2.3-1.
Cell growth in spherical cells is done through the creation of new murein polymer at the division septum, in the middle of the cell which then leads to a division event, as cell elongation does not occur in this type of cells (as observed in Figure 2.3-2-A), where two daughter cells are created [16]. In other bacterial cells, elongation trough the creation of new murein polymer leads to cell growth, as murein can inserted in the sidewalls at the middle of the cell (see Figure 2.3-2-B) or at the poles (see Figure 2.3-2-C).
Each of those processes (Division and Elongation) have their own protein and enzymatic apparatus, which work in specific places of the cell wall [16], [24], as can be observed in Figure 2.3-3. The FtsZ cytoskeleton protein (see Figure 2.3-3-A) along with various other proteins create the division septum at the middle of the cell (as two proteins MinC and SlmA that are present in the rest of the cell, inhibit the assembly of the FtsZ ring required for division [31]. The MreB cytoskeleton system proteins (see Figure 2.3-3-B) are mainly associated with the elongation apparatus, as aforementioned [31].
11
Figure 2.3 – Apparatus and Mechanisms of Cell growth and Cell Division. (1) Bacterial Cell Cycle. Adapted from [30]. (2)
Division and Elongation processes in different bacterial organism. Adapted from [16]. (3) Protein apparatus for the (A) Division and (B) Elongation processes. Adapted from [31].
Mathematical models of the temporal and spatial organization of the bacterial cell cycle [32]– [34] are required to model cell elongation and cell division. These mathematical models arise from numerous experimental studies at the single cell level, especially using E. coli as a model organism [11]. A mathematical model showed how the FtsZ ring can act as force generator to predict the contraction speed and force and how the cell shape arises, as shown in Figure 2.4-1 [32]. Another model showed how the chromosome can be segregated during cell elongation and cell division, implying an influence of the MreB cytoskeleton protein that is involved in the bacterial elongation apparatus. This process modifies the membrane pressure and influences the DNA segregation, as shown in Figure 2.4-2-A [33]. It is important to note that they use cell shape assumptions where the width of the cell doesn’t change over time, and that cells do not deform, as shown in Figure 2.4-2-A and Figure 2.4-2-B. Another model of cell growth, based on Bacillus subtilis, showed that the rate of cell division can be dependent not only on cell size but also on the its age [34].
Bacterial growth as a colony can also be dependent on the capability to move in the direction of more favourable conditions, which at its basic form is normally associated with Brownian random movement or active movement towards a specific gradient, e.g. chemicals (chemotaxis) and temperature (thermotaxis) [35], but can also be influenced by the availability of nutrients [36].
12
Figure 2.4 – Mathematical and computational models of cell shape and growth. (1) E. coli shapes due to FtsZ force
generation. Adapted from [32] (Copyright (2007) National Academy of Sciences, U.S.A.). (2-A) Models of DNA Replication and Segregation. (2-B) Computational model of the E. coli rod shape. Adapted from [33].
Cell Motility
Each individual bacteria cell performs a random walk in the absence of external factors, but when these factors are present, active bacterial cell movement is activated, e.g., towards nutrient sources or by moving away from certain toxins or stress conditions [35]. The random walk is characterized by a smooth swim/run in a determined direction for a few seconds followed by a tumble (a change in direction, which last tenths of a second [37]
Bacterial cells such as E. coli have developed external structures for motility purposes (the flagella) that provides the ability to propel themselves by acting as cellular motors [37], [38]. The active motility mechanism is controlled by a distinct biochemical network (see in Figure 2.5-A) that transmits information from the extracellular environment, gathered by the membrane receptors to the flagella [39].
While each cell tends to behave independently, bacterial populations also display collective behaviour, as bacteria are shown to be spatially arranged in various configurations (see Figure 2.1). Bacterial cells can even organize in large clusters, due to its high rate of division, having specific macroscopic motility properties, which have been studied using individual E. coli cells were tracked inside those clusters, using a fluorescence microscopy [40]. The boundaries of the cluster is maintained by supressing the direction change (tumble) of individual bacteria in the centre of the cluster, as observed in Figure 2.5-B, while it is restored for cells at the edge of the cluster [40]. These experimental findings were confirmed by using a computational simulation, which confirmed that the tumble rate and the cluster morphology are determined by the sensory memory of cells [40]. As previously stated, to develop computational models of these mechanisms, it is essential to have mathematical models or empirical models based on empirical observations that can describe these mechanisms.
In the case of cell motility, such mathematical models have been extensively studied and reviewed [38]. These models incorporate how an individual bacterial cell behaviour affect the population by interacting with other cell and they also incorporate how bacteria interact with the environment [38].
13
Figure 2.5 – Motility behaviour in E. coli cells. (A) Motility biochemical network and anatomy of the flagellar systems. Adapted
from [38]. (B) Run and Tumble. Adapted from [37].
Unlike bacteria motility, the mechanism by which eukaryotic cells can migrate is still a problem that isn’t totally solved, especially as the mathematical models of cell migration are still being envisioned [41], which are essential for the simulation tools of temporal cellular activity of eukaryotic cells.
All the previously described morphological processes are controlled by functional processes that occur inside the bacteria, which can be studied by observation of specific gene expression products such as Ribonucleic acids (RNAs) and proteins, which can be labelled with fluorescent probes.
Gene Expression
Gene expression is the process of synthesizing a functional gene product (e.g. proteins), by using the specific gene information. This process starts with Transcription, where a Messenger RNA (mRNA) transcript is synthesized by copying the genetic information contained in a determined region of the DNA, which is executed by the RNA polymerase (RNAp) and transcription factors, followed by the translation of the RNA transcript into a protein, which is executed by the ribosome. These two mechanisms are part of the general steps in the central dogma of molecular biology [42], which also includes the DNA replication, which is carried a by complex group of proteins called the replisome and occurs before the division event (see Figure 2.6), as described in Section 2.2.1. Other special mechanisms include RNA replication, Reverse Transcription from RNA to DNA and direct translation from DNA to proteins, as they occur specially in virus or in special conditions (see Figure 2.6).
Figure 2.6 – Information flow in biological systems. Blue arrows represent the general mechanisms stated by the central
14
The two DNA strands are composed of simpler monomer units called nucleotides [43]. Each nucleotide is composed by a sugar called deoxyribose, a phosphate group and finally one of four nitrogen-containing nucleobases (cytosine, guanine, adenine or thymine, respectively abbreviated as C, G, A, T) [43]. Each nucleotide is joined together by a chain of covalent bonds between the sugar of previous nucleotide and the phosphate group of the following nucleotide, which results in an alternating sugar-phosphate backbone [43]. Each of the opposite DNA strands are bound together according to specific pairing rules (A always binds with T and C with G) [43]. The RNA, unlike the DNA, is normally found in a single-strand conformation (RNA from virus can be found in double-strands), and its information is stored with the same nitrogenous bases as the DNA, but replacing the thymine with uracil (represented by letter U) [43].
If a cell needs to produce a certain protein, it activates the gene that expresses that protein, which is subsequently transcribed by the RNAp to produce a mRNA molecule, with the help of a specific transfer RNA which has a distinctive folded structure with three hairpin loops, with one of these hairpin loops containing a sequence called the anticodon and being able to recognize and decode a mRNA codon, which is a specific sequence of 3 nucleotides [43].
Since each tRNA (Transfer RNA) has a corresponding amino acid (out of the 22 genetically encoded amino acids), it will transfer that amino acid to the peptide chain that is being translated based on the specific codon of the mRNA [43]. This process is controlled by the ribosome (with the help of the so called rRNA or ribosomal RNA, which moves along the mRNA molecule and binds to tRNAs and various accessory molecules necessary for protein synthesis.), which continues to decode the mRNA molecule, until a STOP codon is translated, forming an amino acid sequence, which is the forming a polypeptide, which can be further arranged to form a functional Protein [43]. If, for example, the coding pattern on the coding strand of the DNA is TAC (Thymine, Adenine, Cytosine), based on the pairing rules the opposite strand is ATG (Adenine, Thymine, Guanine) and the messenger RNA codon is UAC (Uracil, Adenine, Cytosine) and the transfer RNA anti-codon is AUG (Adenine, Uracil, Guanine), which is then finally translated into a Tyrosine Amino Acid.
This research work focuses especially in the first steps of the transcription mechanism, as in prokaryotes this is the mechanism where gene regulation takes place [44]. The main structural components at the DNA level are the promoter, operator(s) site and the actual structural gene(s) [43].
Transcription starts with the promoter search process, where the RNAp localizes the promoter (a specific location in the DNA) by diffusing over the non-specific areas of the DNA. In bacterial cells, the promoters have specific hexameric motifs [45], which are special sequences of 6 nucleotides normally centred close to the -10 and -35 positions relative to the Transcription Starting Site (TSS), as analysed in E. coli cells [46]. When a polypeptide (called σ factor) binds to the RNAp core enzyme, it forms a holoenzyme, reducing the affinity of the RNAp for nonspecific DNA and increasing the affinity to the hexameric motifs [47]. A third component of the bacterial promoters localized upstream of the -35 hexamer was identified as the “UP element” [48] and is able to increase transcription due to the interaction with the α subunits present in the RNAp [49] (as detailed in Section 2.3.3).
Regarding the cellular modelling of gene expression, one of the first models considered transcription to be an instantaneous process [50]. This initial approximation was corrected in following models based on E. coli cells (implemented by the LBD group), modelling transcription at the single nucleotide level using time delays, based on a Gaussian distribution [51], [52]. These models already included events in elongation such as transcriptional pauses, error correction, arrests, premature