Customer heterogeneity
in operational e-service design
attributes
An empirical investigation of service quality
Rui Sousa
Faculty of Economics and Management, Catholic University of Portugal,
Porto, Portugal
Andy C.L. Yeung
The Hong Kong Polytechnic University, Kowloon, Hong Kong,
People’s Republic of China, and
T.C.E. Cheng
Department of Logistics, The Hong Kong Polytechnic University,
Kowloon, Hong Kong, People’s Republic of China
Abstract
Purpose – This study aims to empirically examine whether heterogeneity in personal customer profiles translates to heterogeneity in the valued operational e-service design attributes. It focuses on a key operational e-service design attribute – service quality – by investigating whether customers with different profiles (demographics, pattern of use of the service, and pattern of channel use) attach different levels of importance to different dimensions of web site quality.
Design/methodology/approach – The study is based on path analysis of data collected from multiple sources in a commercial e-service setting (e-banking): data from an online survey of the customers of the e-service; data stored in the transaction and log files generated by the operation of the e-service over time; and data from the e-service provider’s customer database and back office IT systems. Findings – The results suggest that: customer demographics, pattern of service use, and pattern of channel use have no influence on the importance attached by customers to web site quality dimensions; and customer demographics affect the pattern of use of an e-service.
Research limitations/implications – Future research should examine this question in other types of e-services and should examine other types of profile variables.
Practical implications – Service providers may not need to employ customization at the level of web site quality dimensions. The findings support the existence of the concept of an “optimal” web site design for quality.
Originality/value – The paper answers calls for an increased understanding of the design of high quality e-services and for multidisciplinary research in the field of services management, in particular, incorporating operations management perspectives.
Keywords Online operations, Service levels, Services, Quality, Internet Paper type Research paper
This study was partially funded by The Hong Kong Polytechnic University under grant number G-YF46 and by FCT (Foundation for Science and Technology, Portugal) and POCTI (“Programa Operacional Cieˆncia, Tecnologia, Inovac¸a˜o do Quadro Comunita´rio de Apoio III”) under grant number POCTI/GES/49074/2002.
Introduction
The need for alignment between the target markets and the supporting service delivery systems (SDSs) is widely recognized in service operations (Pullman and Moore, 1999; Smith and Reece, 1999). According to this notion, there should be a fit between the operational attributes valued by the target markets and the design choices of the SDS, some of which may be conflicting. If the target markets are fairly homogeneous, a single SDS design may be appropriate. However, if the target markets are very diverse, an operation-focused strategy may be desirable, which employs different SDS designs, each focusing on a fairly homogeneous target market (van Dierdonck and Brandt, 1988; Davidow and Uttal, 1989).
In e-services, i.e. services provided through the internet, this notion translates into the need for an alignment between the target markets and the associated web site SDS (Boyer et al., 2002). The design of the web site SDS involves two steps. The first is the identification of the target markets’ valued operational attributes, i.e. “order-winning” operations-related characteristics of the service, such as quality and flexibility (Boyer et al., 2002; Hill, 1985). The second is making web site SDS design choices which are aligned with those requirements. This includes operations-based choices in both the front and back-office of the SDS, such as structuring the web site-based processes, policies and procedures that customers come into contact with during their co-production of the e-service or making decisions about the flexibility, security and scalability of the information technologies that support the web site (Heim and Sinha, 2001; Heim and Field, 2007; Sousa and Voss, 2006).
Because of the wide customer reach of the internet channel (Evans and Wurster, 1999), a web site is typically exposed to a large number of customers with different personal profiles (Boyer et al., 2002; Olson and Boyer, 2005), including demographic and behavioral attributes. Therefore, there is a high likelihood of heterogeneity in customer requirements. In addition, a great deal of information about personal customer profiles can be generated and processed automatically at a low cost in e-services due to the internet data exchange between providers and customers. As a result, it is relatively easy to make use of this information for alignment decisions.
This context has spun a lot of research investigating the effects of customer heterogeneity on e-service (web site) design. Most of this research has taken place in the marketing field, in which it is generally accepted that customers with different personal profiles value different attributes in a product or service, a core notion of the market segmentation approach. This body of research has typically focused on the attributes of the front-office of web sites, especially those related to information content. It has generally concluded that heterogeneity in customer profiles translates into heterogeneity in terms of the information that customers value in the front-office of a web site. As a result, these studies have advocated “one-to-one” marketing strategies (Peppers et al., 1999), as well as the design of personalized web sites, typically in terms of the displayed information (Ansari and Mela, 2003).
Despite the work carried out in the marketing field, this issue has not been adequately explored from an operations management (OM) perspective, i.e. addressing the previously discussed first step in the design of the web site SDS. From this perspective, the relevant question is whether differences in personal customer profiles translate into differences in the valued operational e-service design attributes, such as quality or flexibility. The market segmentation approach does not take into account
the capabilities of the organization (Jenkins and McDonald, 1997), including its OM capabilities (Berry et al., 1991).
A full understanding of this question is critical to making effective operational alignment decisions. If the customer base is very heterogeneous in terms of operational e-service design attributes, offering a single type of web site design (in terms of the associated SDS) for all the customers, i.e. embodying a particular combination of priorities across several operational site attributes, may cause serious dissatisfaction in several customer segments. In this case, the service provider may need to design different types of web sites for different customer segments in order to achieve a high level of performance. However, if the customer base is fairly homogeneous, then the expense and effort of customization is unnecessary. In this case, the service provider may adopt a single type of web site design embodying the combination of operational attributes preferred by its customer base and should invest its effort in uncovering the optimal combination rather than in customization. Understanding the extent of customer heterogeneity is also useful to inform new service development. In fact, armed with this knowledge, the service provider can use web site design choices proactively in order to attract the desired type of customers (Reichheld and Schefter, 2000).
This paper sets out to address this research gap by examining the effects of customer heterogeneity on a key operational design attribute of e-services, namely service quality. Service quality is important because it enhances customer loyalty (Boyer and Hult, 2005), a key requirement for the success of e-services (Reichheld and Schefter, 2000). The quality of an e-service is mainly determined by the quality of the associated web site (Sousa and Voss, 2006). Several studies have identified relevant dimensions of web site quality at the level of perceptual attributes (Loiacono et al., 2001; Wolfinbarger and Gilly, 2002; Yang et al., 2004; Yoo and Donthu, 2001). Zeithaml et al. (2002) and Parasuraman et al. (2005) provide excellent reviews of most of these studies, and summarize the main dimensions of web site quality as:
. privacy/security (protection of personal information, risk of fraud and financial
loss);
. information quality (the suitability of the information to the user’s purposes); . ease of use (effort of the end-users in using the web site);
. graphic style (presentation of graphics and text on the web site); and
. fulfillment (the extent to which the site’s promises about order delivery are
fulfilled).
In this connection, this paper empirically examines whether customers with different profiles attach different levels of importance to different web site quality dimensions. The relative emphasis placed by an e-service provider on these dimensions will affect the detailed design choices of the SDS, both in terms of the front-office and the back-office. For example, concerning the front-office, emphasizing ease of use will imply careful attention to issues of human-technology interaction and interface design (Schneiderman, 1998). Concerning the back-office, emphasizing response time (an aspect of fulfillment) will affect design decisions at the level of capacity, software and hardware quality, security and IT scalability (Heim and Sinha, 2001). Also, some of these operational design attributes may be conflicting in terms of the
supporting SDS design choices. For example, improving ease of use by means of cookies may harm privacy; or improving graphic style by increasing the use of graphics may lengthen response time.
The structure of the paper is as follows. First, we review the relevant literature to develop an exploratory model relating customer profile to web site quality dimensions. Specifically, we consider three sets of customer profile variables, namely demographics, pattern of use of the service, and pattern of channel use. Second, we describe the study’s methodology, based on triangulation of data collected from multiple sources in a commercial e-service setting (e-banking): data from an online survey of the customers of the e-service; data stored in the transaction and log files generated by the operation of the e-service over time; and data from the e-service provider’s customer database and back office IT systems. We then test the developed model using path analysis and discuss the main findings. Finally, we put forward a number of implications of the results for e-service management, summarize the study’s contributions and identify its limitations.
Research model
It is generally recognized that customers with different profiles may have different requirements for a product or service. This notion is at the basis of the market segmentation approach, which typically employs two main sets of customer profile variables to segment a market, namely basic customer characteristics (e.g. demographics) and behavioral characteristics (e.g. usage rate of a product or service) (Dibb, 2000). It is also recognized that there is a relationship between basic customer characteristics and behavioral characteristics (Kotler, 1991; Loudon and Bitta, 1993). Figure 1 shows this logic.
We reviewed the literature to adapt the general research model in Figure 1 to an e-service context and to re-focus it around operational e-service design attributes. As such, we have replaced customer requirements by web site quality dimensions, as our operational design attributes of interest. This resulted in the building of a model
Figure 1. General model underpinning the market segmentation approach Basic Customer Characteristics Behavioral Characteristics Customer Requirements - Demographic (e.g., age, gender, education) - Geographic (e.g., region, climate) - Psychographic (e.g., lifestyle, personality)
- Use behavior (e.g., use rate and status, type of occasion) - Benefits from use - Loyalty status - Readiness stage - Attitude towards product/service
Sources: Kotler (1991); Dibb (2000)
- Typically, product/service attributes not necessarily linked to operational design attributes Customer Profile
relating customer profile variables to the importance attached by customers to different web site quality dimensions. We found that the existing studies only indirectly addressed such relationships and tended to fall in the areas of consumer behavior on the internet, acceptance and use of information technologies and, sparsely, e-service quality. Hence, our model is of an exploratory nature.
The model we have arrived at is shown in Figure 2. We consider three groups of interrelated customer profile variables in the model, namely one group of basic customer characteristics (i.e. demographic variables), and two groups related to service use behavior (i.e. pattern of service use – experience with the service and frequency of use, and pattern of channel use). These variables were considered for several reasons. First, as will be explained in the next section, the review of the literature suggests that these variables may be pertinent to influencing the importance attached to web site quality dimensions through the depicted model (Relationships 1-5 in Figure 2). Second, demographic characteristics and use behavior variables are extensively employed in segmentation exercises. Third, they are observable and measurable variables in an e-service setting, a key requirement for providing a scheme for customer segmentation (Kotler, 1991; Fogliatto and da Silveira, 2008) and for making operational alignment decisions. In fact, in many e-services today, firms may require customers to register, which solicits demographic information, and they can also monitor the pattern of use of the service and the pattern of channel use by analyzing their data warehouses (e.g. transaction and log files) (Moe and Fader, 2001; Schneider, 2008).
We next present the literature review and derive the propositions depicted in the proposed research model.
Figure 2. The research model
R5 R2 R1 R4 R3 Age Education Demographics Frequency of use Experience with the service Pattern of service use
Pattern of channel use Degree of use of the internet and alternative
channels Importance attached to different website quality dimensions Gender Customer Profile
Literature review and research propositions
Several studies have indirectly suggested a relationship between pattern of service use and the importance placed on different web site quality dimensions (Relationship 1). In particular, the level of experience with the service and the frequency of use have emerged as potentially important variables. Hammond et al. (1998) conducted a controlled experiment with web users exploring the extent to which experience with the use of the internet affected user attitudes towards the web. Among other results, the study found that experienced users placed a higher value on the information found on the web compared to those with less experience. This suggests that the information quality dimension may be more important to an experienced user than to an inexperienced one. Novak et al. (2000) found through structural equation modeling that consumers who have more recently started using the web are more likely to use it for experiential activities, while those who have been using the web for a long time are more likely to use it for task-oriented activities. In addition, Wolfinbarger and Gilly’s (2001) focus group study reported that task-oriented and experiential shoppers are attracted to online shopping for different reasons. The former value convenience, availability of information, selection capability, and the lack of physical sociality that using a web site may afford (i.e. avoiding interactions with service employees and fellow customers, increased anonymity, etc.). The latter value surprise/ excitement/uniqueness, availability of deals, product involvement and the different forms of sociality that using a web site may afford (i.e. interactions with other users facilitated by online communities, chat rooms or peer reviews of products and services). All these attributes are closely related to web site quality dimensions. Similarly, Cai and Jun (2003) found that while, for online buyers, the reliability and responsiveness of an e-service’s web site have a significant impact on the overall perception of service quality, this is not the case for information searchers (a less experienced group in using the internet). Prior research has also shown that as internet experience and usage increases, perceived online purchase risk decreases (Miyazaki and Fernandez, 2001). This suggests that more experienced users, and users using a service more often, may value the privacy/security quality dimension less strongly. Finally, Patricio et al.’s (2003) focus group study found that customers with different patterns of use of an e-banking service (e.g. frequency of use and type of operations performed) tend to value different web site attributes, several of which are related to web site quality. Hence, we formulate the following propositions regarding the impact of the pattern of service use:
P1a. Frequency of use is directly related to the importance attached to different web site quality dimensions.
P1b. Experience with the service is directly related to the importance attached to different web site quality dimensions.
Other studies have indicated the possibility that pattern of channel use may impact on the importance of web site quality dimensions (Relationship 2). Exploratory research has found that online customers use different channels for different purposes (Black et al., 2002; Burke, 2002; Patricio et al., 2003), and that they are in a different frame of mind and have different informational needs depending on the channel of service delivery (Burke, 2002). Iqbal et al.’s (2003) discrete choice experiment demonstrated that consumer preferences for features of transaction-based e-services differ between
offline and online consumers. This suggests the possibility that customers with different relative use of the internet versus other alternative channels value different web site quality dimensions differently. For example, a customer who uses an internet channel to carry out all purchase transactions, including order placement and payment, may value security more highly than a customer who uses the same web site to search for product/service information and then uses a physical outlet to actually make the purchase. Hence, we formulate the following proposition:
P2. Pattern of channel use is directly related to the importance attached to different web site quality dimensions.
The relationships between customer demographics and pattern of use of the service (Relationship 3) and pattern of channel use (Relationship 4) have been examined in several studies on the use of technological innovations. Relevant demographic variables typically include age, gender, and education. Numerous studies have examined the effect of differences between individuals, including demographic variables, on the acceptance and use of general, new information technologies (Agarwal and Prasad, 1999; Harrison and Rainer, 1992). For the specific case of technological innovations in retailing, Zeithaml and Gilly (1987) found that the frequency of use is affected by the age and education of the users. Several researchers (Darian, 1987; Eastlick, 1993; Fram and Grady, 1997; Hitt and Frei, 2002) have investigated the impact of demographic factors on the use of technology-based self-services and found that typically young, educated males are more likely to use such service options. This is also the typical profile of internet users (Fram and Grady, 1995; Sexton et al., 2002). Thus, these groups are expected to be more experienced in the use of internet services, use them more frequently and rely more heavily on the internet channel in comparison with alternative channels.
Hence, we formulate the following propositions:
P3a. Customer demographics (in terms of age, gender and education) are directly related to frequency of use.
P3b. Customer demographics (in terms of age, gender and education) are directly related to experience with the service.
P4. Customer demographics (in terms of age, gender and education) are directly related to pattern of channel use.
Finally, there is support for a direct relationship between customer demographics and the importance attached to different web site quality dimensions (Relationship 5). Spathis et al. (2004) found that male and female customers of traditional (i.e. non-internet based) bank services attribute different levels of importance to different service quality dimensions. More specifically related to technology-enabled services, Venkatesh and Morris’ (2000) empirical examination of the adoption of new data and information retrieval technologies found that men value more strongly perceived usefulness, while women value more strongly perceived ease of use. These two attributes are related to different web site quality dimensions in an e-service context (Loiacono et al., 2001). Gender differences have also been found in the perceptions of risk of buying online (Bartel-Sheehan, 1999; Garbarino and Strahilevitz, 2004). This suggests that there may be gender differences in the importance attached to the
security/privacy quality dimension. Finally, there is evidence that different age groups use the internet for different purposes (Gervey and Lin, 2000; Teo, 2001). Hence, we formulate the following final proposition:
P5. Customer demographics (in terms of age, gender and education) are directly related to the importance attached to different web site quality dimensions. Methodology
The study was based on the administration of an online questionnaire to a sample of the customers of a major retail e-banking service. Our single-industry focus is in keeping with similar industry-specific research in e-services (Boyer and Hult, 2005; Verma et al., 2004). In addition, it allows for the control of service type, thus maximizing the power of the tests applied to the model in Figure 2. E-banking was chosen for several reasons. First, it is a mature and one of the most widespread types of e-services, with high-adoption levels among both service providers (e.g. the majority of banks now offer such a service) and users (according to Forrester Research, it is predicted that 35 per cent of US households with internet connections will bank through the web by 2008). Second, in e-banking – an information service – the web site plays a major role in service provision. Finally, the range of services offered at e-banking sites tends to be similar across different service providers and countries, enhancing the generalizability of our findings.
The chosen service, located in Portugal, had about 600,000 customers at the time of the study and is considered a “best practice” service, being ISO 9001 certified and having won, among other awards, the “Best Consumer Internet Bank 2003” country award by the Global Finance magazine. The study was based on triangulation of data collected from multiple sources in this e-service setting. The next sections discuss the measurement of the main research variables – customer profile variables and the importance attached to different web site quality dimensions – as well as the method of data collection.
Importance of web site quality dimensions
The importance of web site quality dimensions was measured via an online questionnaire administered to customers of the selected e-service. We took special care to arrive at a parsimonious set of items to measure the importance attached to different dimensions of web site quality. The reason for this was twofold. First, respondents have been found to be especially sensitive to lengthy questionnaires when they are administered online (Fram and Grady, 1995). A large number of scale items can lead to participant fatigue, boredom and inattention, which, in turn, can lead to inappropriate response behavior (Drolet and Morrison, 2001). Second, we needed to maximize the sample size for increasing the statistical power of the proposed analyses. Hence, given the absence of a generally accepted and tested instrument for measuring web site quality, we made the explicit choice to use single items as point estimates for the different quality dimensions. Single-item measures can be as good as multi-item measures as long as the reliability and validity issues are addressed (Drolet and Morrison, 2001; the way these and other measurement issues were addressed in the study is discussed below). In particular, single-item measures have been used extensively in past research for measuring the importance attached to competitive
priorities, including quality (Miller and Roth, 1994; Verma and Young, 2000), as well as in general service and quality management research (Rust et al., 1995; Voss et al., 2004). The selection of the measurement items was as follows. We compiled a list of items from existing instruments that would capture the five broad dimensions of web site quality identified by Zeithaml et al. (2002), i.e. privacy/security, information quality, ease of use, graphic style and fulfillment. Where theory is less well developed, it is beneficial to use both academic and practical perspectives (Hensley, 1999, p. 348). Therefore, using this base list of items, we held several iterative focus group discussions with managers from the bank’s quality and marketing departments with the objective of choosing one item to adequately represent each of the main quality dimensions in the context of an e-banking service. During these discussions, it was considered important in the context of an e-banking service to break the fulfillment dimension into two separate dimensions: reliability and responsiveness. In an e-banking context these two dimensions correspond to what is typically defined as fulfillment and are both provided by the web site’s back office systems. The discussions highlighted that deficiencies in these two areas require corrective actions of a different nature, thus making it beneficial to treat them separately. For example, responsiveness problems may require an improvement in the processing capacity of back office systems, while reliability problems may indicate the need to revise back office processing procedures. Thus, we considered six main dimensions of web site quality in total, namely information quality, ease of use, privacy/security, graphic style, reliability and responsiveness. During this process, the wording of the items was also adapted to an e-banking context, a recommended method in empirical research (Boyer and Pagell, 2000).
This process resulted in the items described in Table I. This table shows the six dimensions of web site quality, their general descriptions, and the items that were chosen to measure them. A final verification of content validity was performed by asking a group of ten academics to associate each of the six randomly ordered measurement items to the general descriptions of the six web site quality dimensions
Dimension of web site
quality General descriptiona
Measurement item for an e-banking service
1. Privacy/security Protection of personal information, risk of fraud and financial loss
I1. Safety in performing transactions 2. Information quality The suitability of the information to
the user’s purposes
I2. Correct and up to date information about the bank’s products and services
3. Ease of use Effort of the end-users in using the web site
I3. Ease of performing banking operations and accessing information
4. Graphic style Presentation of graphics and text on the web site
I4. Visual attractiveness of web site 5. Reliability Ability to perform the promised
service dependably and accurately
I5. Requests/instructions correctly processed
6. Responsiveness Speed of response I6. Speed in delivering the services Sources:aZeithaml et al. (2002); Parasuraman et al. (2005)
Table I.
Dimensions of web site quality and associated measurement items for an e-banking service
given in Table I. All ten academics associated the items and dimensions according to the scheme in this table. These items were the base for the design of a questionnaire soliciting customers to rate on a 1-5 Likert scale the importance that they attribute to different dimensions of web site quality for a general e-banking service. The questionnaire was pilot-tested with a group of managers from the bank and general users of e-banking services.
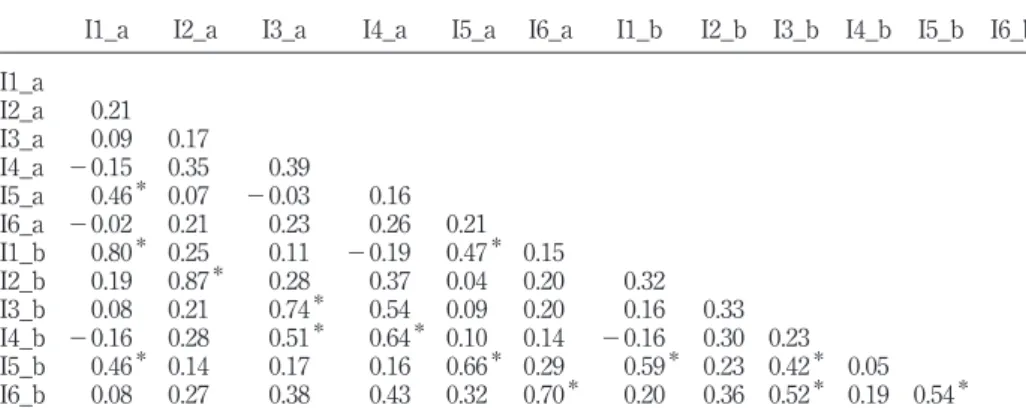
The reliability of the measures was ascertained by employing the test-retest method, a method recommended for measures comprised of single indicators (O’Leary-Kelly and Vokurka, 1998). With the assistance of the quality service manager of a different bank, we contacted about 150 customers of that bank who had e-banking accounts, inviting them to participate in an “e-banking quality study”. We did not inform them at this time that this was a test-retest study. Of the contacted customers, 50 agreed to participate. We sent the questionnaire to these customers by several channels (e-mail, fax and post) and since they had all agreed to participate, we were able to obtain 47 valid questionnaires. Approximately, three weeks after the customers returned the first questionnaire, we sent them the same questionnaire through the same channel, and obtained 38 valid responses. This time, we explained that the objective of the second questionnaire was to obtain more reliable data. The correlation matrix of the six indicators across the two sets of measurements is shown in Table II. This table shows that the correlations between the measures of the same items at different times are all high and significant, which demonstrates that the items are reliable.
In order to further assess the quality of the measures, we employed Campbell and Fiske’s (1959) multitrait-multimethod logic. Table II shows that the correlations between the measurements of the same items at different times are all significant and substantially greater than the other correlations in the matrix, which indicates the absence of common method bias and supports the discriminant validity of the items. We also compared the mean of the correlations between the same items measured at different times (the six correlations in the diagonal of the lower left quadrant of Table II) with three other means: the mean of the correlations between different items measured in the first time (the 15 correlations shown in the upper left quadrant of Table II);
I1_a I2_a I3_a I4_a I5_a I6_a I1_b I2_b I3_b I4_b I5_b I6_b I1_a I2_a 0.21 I3_a 0.09 0.17 I4_a 2 0.15 0.35 0.39 I5_a 0.46* 0.07 2 0.03 0.16 I6_a 2 0.02 0.21 0.23 0.26 0.21 I1_b 0.80* 0.25 0.11 2 0.19 0.47* 0.15 I2_b 0.19 0.87* 0.28 0.37 0.04 0.20 0.32 I3_b 0.08 0.21 0.74* 0.54 0.09 0.20 0.16 0.33 I4_b 2 0.16 0.28 0.51* 0.64* 0.10 0.14 2 0.16 0.30 0.23 I5_b 0.46* 0.14 0.17 0.16 0.66* 0.29 0.59* 0.23 0.42* 0.05 I6_b 0.08 0.27 0.38 0.43 0.32 0.70* 0.20 0.36 0.52* 0.19 0.54*
Notes:*Significant correlations (0.01 level). a – First questionnaire (test); b – second questionnaire (retest)
Table II. Correlation matrix of test and retest measurements
the mean of the correlations between different items measured in the second time (the 15 correlations shown in the lower right quadrant of Table II); and the mean of the correlations between different items measured at different times (the 30 correlations outside the diagonal of the lower left quadrant of Table II). We found that the mean of the correlations between the same items measured at different times was significantly greater ( p , 0.001) than the other three means, which reinforces our conclusions about discriminant validity and the absence of common method bias.
Customer profile variables
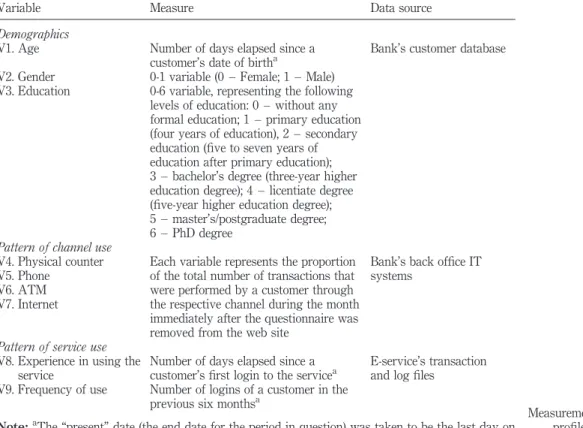
The demographic variables, i.e. age, gender, and education level, were obtained from the bank’s customer database. For pattern of channel use, we considered four variables representing the proportion of total transactions that a customer performed through each of the four available service delivery channels, namely physical counter, phone, ATM and the internet. These variables were obtained from the bank’s back office IT systems, which record all the transactions of a customer with the bank across the different available channels. The pattern of service use variables were obtained from the e-banking service’s transaction and log files. These files use codes to identify users because web site access is subject to user authentication, and automatically record information about exchange of data between servers and clients (Wiedmann et al., 2002). Table III describes how the variables were measured and the associated data sources.
Data collection
The data for customer profile variables were extracted directly from the bank’s customer database and the bank’s IT systems. The data extraction was performed by the bank’s staff according to the researchers’ instructions. The data concerning the importance attached to the different web site quality dimensions were collected via an online questionnaire administered to customers of the e-banking service. In this process, we drew on the overall customer database to exclusively target customers fulfilling the following criteria: active customers (customers having made at least two logins to the service in the previous three months), age over 18 years old, excluding bank employees and customers with any pending conflicts with the bank (e.g. having made out cheques without provision). This screening resulted in a pool of 51,125 eligible customers. The actual target sample for our study consisted of a subset of 30 per cent of this pool, generated through random extraction from the pool. This resulted in a final target sample of 15,338 customers.
The questionnaire was posted on the e-banking service web site, and placed immediately after the login stage. After the targeted customers logged in, they were asked whether they would like to fill in the questionnaire, in which case they were directed to the respective web page. The questionnaire software application kept track of the identification of all targeted customers, recorded respondents and non-respondents and, for the respondents, recorded their actual responses to the questionnaire. The software also ensured that customers who declined to fill in the questionnaire as well as those who did fill in the questionnaire were not asked again. The questionnaire was active on the site for one month, resulting in 2,394 valid responses, yielding a 15.6 per cent response rate. We conducted a non-respondent bias analysis employing independent sample t-tests to compare the profiles of respondents
and non-respondents. The analysis showed no significant differences, indicating the absence of non-respondent bias.
For the purpose of examining the proposed model, we chose to focus on “professionally active adults” in order to avoid the nonlinear effects of age. Thus, we curtailed the set of valid responses by excluding from the analysis customers at both ends of the age spectrum. On the one hand, we excluded respondents below 25 years old in order to eliminate potential full-time students and ensure that the registered level of education was an accurate reflection of a customer’s profile. For example, a 19-year old person who was taking an undergraduate degree at the university would have a registered education level which was only secondary education. It has been shown that for people over 25 years old the positive association between age and education is virtually eliminated (Smith, 1993). On the other hand, we excluded customers over 60 years old, as they would probably be retired and have a very different lifestyle (60 years old is the average effective retirement age in the European Union EU-15, www.bionetonline.org/English/Content/ll_leg1.htm, 2004). This resulted in 1,718 usable cases. The final sample is characterized in Table IV. The table shows that the predominant demographic profile in the sample was that of a male, young and
Variable Measure Data source Demographics
V1. Age Number of days elapsed since a customer’s date of birtha
Bank’s customer database V2. Gender 0-1 variable (0 – Female; 1 – Male)
V3. Education 0-6 variable, representing the following levels of education: 0 – without any formal education; 1 – primary education (four years of education), 2 – secondary education (five to seven years of education after primary education); 3 – bachelor’s degree (three-year higher education degree); 4 – licentiate degree (five-year higher education degree); 5 – master’s/postgraduate degree; 6 – PhD degree
Pattern of channel use V4. Physical counter V5. Phone
V6. ATM V7. Internet
Each variable represents the proportion of the total number of transactions that were performed by a customer through the respective channel during the month immediately after the questionnaire was removed from the web site
Bank’s back office IT systems
Pattern of service use V8. Experience in using the
service
Number of days elapsed since a
customer’s first login to the servicea E-service’s transactionand log files
V9. Frequency of use Number of logins of a customer in the previous six monthsa
Note:aThe “present” date (the end date for the period in question) was taken to be the last day on which the questionnaire was active on the web site
Table III. Measurement of customer profile variables and respective data sources
educated customer. This pattern is in line with the patterns observed for general internet users in the European Union and the USA, as well as for e-banking users (SIBIS, 2003a, b; Eurostat, 2003).
Data analysis
In order to examine the proposed model, we employed path analysis (Li, 1975), a classical statistical technique for exploring complex empirical relationships. Other similar methods, such as structural equation modeling, are essentially confirmatory techniques and are more appropriate for verifying a few well-defined and simple models. Using structural equation modeling to develop new and complex models will always lead to the rejection of these models, regardless of their validity (Baumgartner and Homburg, 1996; Bentler and Chou, 1987).
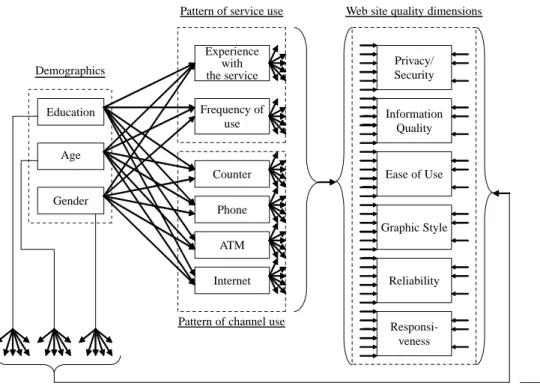
Path analysis works by building a diagram that summarizes and generalizes the relationships between the research variables, on what can be seen as a theory building and testing process (Bradley and Schaefer, 1998). Path coefficients (P) are represented by standardized partial correlation coefficients, which measure the strength of the relationship between a dependent and a predictor variable when the predictive effects of the other independent variables in the regression model have been removed (i.e. stepwise regression). In our study, we built the path diagram shown in Figure 3. This diagram embodies all the pair-wise paths corresponding to the research model in Figure 2. For example, Relationship R3 in Figure 2 corresponds to six pair-wise paths
Variable Percentage V1. Gender Male 73.7 Female 26.3 V2. Age (25-35) 57.3 (35-45) 24.0 (45-55) 14.2 (55-60) 4.5 V3. Education Lower education 48.0 0 0.0 1 2.6 2 45.4 Higher education 52.0 3 11.1 4 39.5 5 1.3 6 0.1 V4. Counter 4.2 V5. Phone 1.4 V6. ATM 28.5 V7. Internet 65.9 V8. Experience 628.4 days V9. Frequency of use 85.3 logins Note: n ¼ 1,718
Table IV.
Characterization of the final sample
in Figure 3 relating each of the three variables “education”, “age” and “gender” to each of the two variables “experience with the service” and “frequency of use”.
In the analysis, we adopted the standard criteria for retaining paths, i.e. a significance level of 0.05 (statistical significance) and path coefficients greater than 0.10 (size effects) (Asher, 1983; Hair et al., 1998). This corresponds to retaining only those paths that are found to have practical significance (Asher, 1983; Hair et al., 1998). Given the large sample size used in the analysis (n ¼ 1,718), practical significance is a particularly relevant criterion (Hair et al., 1998) because statistical tests may become overly sensitive, indicating that almost any relationship is statistically significant (Parasuraman and Zinkhan, 2002, p. 293). In the analysis, most of the paths that were rejected were because of the lack of practical significance (path coefficient , 0.10), rather than the lack of statistical significance. The path analysis results are shown in Figure 4, which depicts only the retained paths.
Figure 4 shows that there are no practically significant relationships between customer profile variables and the perceived importance of different web site quality dimensions (all path coefficients for Relationships 1, 2 and 5 were less than 0.10). The adopted research design tried to maximize the power of the tests that were performed. Indeed, the study has controlled for type of service and has relied on a large sample size. Therefore, the fact that the Relationship paths 1, 2 and 5 were not of practical significance strongly suggests that these indeed do not hold or are of negligible strength. Hence, there is no empirical support for P1a, P1b, P2 and P5.
On the other hand, Figure 4 shows some practically significant relationships between customer demographics and pattern of channel use, as well as between
Figure 3. Full path analysis diagram
Pattern of channel use Frequency of
use Experience
with the service Pattern of service use
Counter Phone ATM Internet Age Education Demographics
Web site quality dimensions
Gender Privacy/ Security Information Quality Ease of Use Graphic Style Reliability Responsi-veness
customer demographics and pattern of service use. Hence, there is empirical support for P3a, P3b and P4.
Discussion
Our study set out to empirically examine an exploratory model linking customer demographics, e-service use behavior (pattern of service use and channel use) and the importance attached to different web site quality dimensions (Figure 2). The data analysis revealed two main findings.
First, we found significant relationships between different customer profile variables, namely demographics, which have an influence on pattern of service use and on pattern of channel use. This validates the left-hand side of Figure 2 (Relationships R3 and R4) and is consistent with existing theory in marketing. Specifically, we found that education has an effect on how early a customer starts using the service (with higher educated customers starting earlier), but not on the actual frequency of service use, nor on pattern of channel use (Figure 4). This seems to suggest that education plays a role in the adoption decision, but not afterwards. Potential explanations for the role of education in the adoption decision include higher educated customers having better access to information about new services, having been using the internet for longer in their professional activities, and being financially better off, reducing the cost barrier to internet access.
We also found that older customers tend to be less frequent users and tend to use the physical channels more often. However, age does not influence how early a customer starts using the service (Figure 4). Hence, it seems that, although older customers are likely to adopt the e-service as early as younger customers, they tend to
Figure 4.
Path analysis results
Pattern of channel use Age Education Demographics Frequency of use Experience with the service
Pattern of service use Web site quality dimensions
Gender Counter Phone ATM Internet . Negative relationship Positive relationship P: Path Coefficient p: Significance Level Privacy/ Security Information Quality Ease of Use Graphic Style Reliability Responsiveness P = 0.143 p < 0.001 P = – 0.103 p < 0.001 P = 0.104 p < 0.001
use it less intensely, probably as a complement to traditional channels. On the contrary, younger customers, once they adopt the service, seem to be more intense users, at the expense of physical channels. A potential explanation for this may be that, after adoption, older customers still keep some of the habits of using traditional channels that existed prior to the emergence of e-services. Younger customers, free of these habits, embrace the internet channel more fully.
Our second main finding was the lack of impact of customer profile on the importance attached by customers to different web site quality dimensions (Figure 4). This seems to indicate that heterogeneity in personal customer profiles does not translate into heterogeneity in the valued operational e-service quality design attributes. This finding is at odds with the right hand side of the exploratory model in Figure 2 (Relationships R1, R2 and R5). We put forward two possible explanations for this. First, most of the literature underlying the non-confirmed relationships addresses them from a perspective other than OM. Second, several of these studies have been exposed to the drawbacks of common method variance and the single key informant approach. Common method variance is variance that is attributable to the measurement method rather than the constructs the measures represent, leading to systematic measurement error (Campbell and Fiske, 1959) and the reporting of significant relationships between research variables that may be artificial (Podsakoff et al., 2003). Our study avoids such effects by drawing on different data sources for measuring the several sets of research variables (Tables I and III). The single key informant approach relies on surveying one individual who provides data on his/her company or location and is a threat to validity (Phillips, 1981). Often, past studies have relied on convenience samples of students or general technology users. Our study, by having surveyed actual customers in a real business setting and by having employed objective behavioral data rather than self-reported data, has avoided the pitfalls of the key informant approach.
Implications for e-service management practice and research
Our two main findings have a number of implications for service management. The first, related to the observed inter-relationships between customer profile variables, contributes to a deeper understanding of e-service use behavior. In particular, this finding leads to two possible marketing-based strategies for e-service providers wishing to increase the degree to which existing customers use the internet channel to devise specific strategies to:
. motivate lower educated customers to join this channel; and . change the habits of older customers.
The second main finding, related to the absence of effects of customer profile on the importance attached to different web site quality dimensions, has two main implications for the operational design of e-services. First, it suggests that e-service providers may not need to employ customization at the level of web site quality dimensions. That is, the design priorities of web site SDSs in terms of individual quality dimensions (for example, whether to emphasize visual appeal or response time) may be the same across users. As a consequence, the service provider may adopt a single type of web site design (including the supporting SDS) embodying the combination of operational attributes preferred by its customer base.
Second, this finding supports the existence of the concept of an “optimal” web site design for quality, i.e. the existence of a combination of priorities in individual web site quality dimensions that is likely to satisfy all the customers equally well. This means that the investment made in designing a single type of web site can be spread across a large number of customers. For service providers, this suggests that substantial effort should be invested in uncovering this optimal combination rather than in the pursuit of customization.
From a research perspective, our findings provide an increased understanding of the competitive role of quality in e-services. Quality is often considered to be the basis of a pyramid of OM capabilities, on what has become known as the sand cone model (Ferdows and de Meyer, 1990). Recently, this notion has been proposed to apply to e-services (Voss, 2003), implying that e-service providers should begin by building quality-related capabilities, before moving on to higher level capabilities. Our results are particularly interesting in that they suggest that e-service providers may develop a single set of quality capabilities for this basis that can be deployed across all the customers. However, they also suggest that it may be difficult to achieve market differentiation by assigning different design priorities to web site quality dimensions. Although it may be very important to find the “optimal” design for quality, once the “optimal” design is found that matches the provider’s customer base, differentiation by design priorities may not be possible. In other words, our results suggest that the potential for market segmentation in this respect may not exist. For example, deviating from the optimal design by developing a particularly responsive web site (beyond the market standard), at the expense of graphic style (e.g. by reducing the amount of graphics), in the hope of pleasing a segment of customers who may especially value this attribute may not produce significant benefits.
Although having differentiated quality design priorities may not be a source of market differentiation, this does not mean that web site quality performance cannot be a source of advantage in itself. Service providers may gain advantage by consistently meeting those priorities, a responsibility that falls with the operations function. For example, although two e-service providers may chose to place similar priorities on the information quality dimension, one may be able to design and manage the supporting SDS (e.g. internal organizational structures to keep the information updated) in such a way as to consistently meet that goal, while the other may not.
Conclusions
This study found that customer profile had no effect on the importance that customers attach to different web site quality dimensions seen as operational e-service design attributes. Thus, the mass customization approach generally advocated for marketing decisions does not seem to translate to the web site quality dimensions considered from the OM perspective, or at least, not universally. The study also found significant interrelationships between customer profile variables in an e-service setting (namely, customer demographics affect e-service use behavior) enhancing our understanding of e-service use behavior.
The study contributes to research in e-services in several ways. First, it answers calls for an increased understanding of the design of high quality e-services (Hill et al., 2002; Sousa and Voss, 2006). Second, it contributes to integrating two research streams that have largely evolved independently, namely e-service
operations/quality research and research examining the use of information technologies and the associated customer behavior. This, in turn, meets calls for multidisciplinary research in the field of services management (Lemmink, 2005), as well as for a wider range of service research, in particular, incorporating the OM perspective (Rust, 2004).
Third, by examining the effect of customer heterogeneity in operational e-service design attributes it places on the research agenda the need to forge much needed links between marketing and operations perspectives of e-services. In particular, it places e-service quality dimensions as a useful bridge between marketing and operations strategic decisions (specifically, operational design decisions) in e-service settings, along Hill’s (1985) notion of order-winners and qualifiers. Finally, the study contributes to the research stream investigating customer heterogeneity on the web (Boyer et al., 2002; Boyer and Frohlich, 2006).
We are confident that our study has led to a deeper understanding of customer profile contingencies associated with the operational design of high quality e-services and that it will motivate future research investigating other operational e-service design attributes besides quality.
Limitations and future research
The study employed a carefully controlled research design, examining a single type of e-service, namely e-banking, a key type of e-service in today’s business landscape. Given that the most relevant results of our study have been of a disconfirmatory nature (i.e. the absence of expected relationships between customer profile and web site quality dimensions), we consider this limitation not to diminish the relevance of the findings. In fact, one disconfirmatory instance is sufficient to disprove a theory. In order to better ascertain the degree of generalizability of these findings, future research should test the developed propositions in other types of e-services.
The research design was also oriented towards maximizing sample size and the associated power of the tests for the developed propositions. In this connection, the study employed a parsimonious instrument made up of single-item measures for the importance attached to the different web site quality dimensions. Future studies, adopting different emphases and benefiting from forthcoming developments in the creation of reliable web site quality measurement instruments, might employ multi-item scales for these dimensions. In addition, future studies could employ experimental methodologies where the users and web site quality dimensions could be more tightly controlled to more directly assess the explored relationships.
Finally, our research model (Figure 2) comprised a subset of several possible types of customer profile variables (basic customer characteristics and behavioral characteristics – see Figure 1). Future research should explore the effects of other types of profile variables, such as psychographic, attitudinal or additional behavioral criteria.
References
Agarwal, R. and Prasad, J. (1999), “Are individual differences germane to the acceptance of new information technologies?”, Decision Sciences, Vol. 30 No. 2, pp. 361-91.
Ansari, A. and Mela, C. (2003), “E-customization”, Journal of Marketing Research, Vol. 40 No. 2, pp. 131-45.
Asher, H. (1983), Causal Modeling, Sage University Press, Newbury Park, CA.
Bartel-Sheehan, K. (1999), “An investigation of gender differences in on-line privacy concerns and resultant behaviors”, Journal of Interactive Marketing, Vol. 13 No. 4, pp. 24-38. Baumgartner, H. and Homburg, C. (1996), “Application of structural equation modeling in
marketing and consumer research: a review”, International Journal of Research in Marketing, Vol. 13 No. 2, pp. 139-61.
Bentler, P. and Chou, C. (1987), “Practical issues in structural modeling”, Sociological Methods & Research, Vol. 16, pp. 78-117.
Berry, W., Bozarth, C., Hill, T. and Klompmaker, J. (1991), “Factory focus: segmenting markets from an operations perspective”, Journal of Operations Management, Vol. 10 No. 3, pp. 363-87.
Black, N., Lockett, A., Ennew, C., Winklhofer, H. and McKechnie, S. (2002), “Modelling consumer choice of distribution channels: an illustration from financial services”, International Journal of Bank Marketing, Vol. 20 No. 4, pp. 161-73.
Boyer, K. and Frohlich, M. (2006), “Analysis of effects of operational execution on repeat purchasing for heterogeneous customer segments”, Production and Operations Management, Vol. 15 No. 2, pp. 229-42.
Boyer, K. and Hult, G. (2005), “Extending the supply chain: integrating operations and marketing in the online grocery industry”, Journal of Operations Management, Vol. 23 No. 6, pp. 642-61.
Boyer, K. and Pagell, M. (2000), “Measurement issues in empirical research: improving measures of operations strategy and advanced manufacturing technology”, Journal of Operations Management, Vol. 18 No. 3, pp. 361-74.
Boyer, K., Hallowell, R. and Roth, A. (2002), “E-services: operating strategy – a case study and a method for analyzing operational benefits”, Journal of Operations Management, Vol. 20 No. 2, pp. 175-88.
Bradley, W. and Schaefer, K. (1998), The Use and Misuses of Data and Models, The Mathematization of the Human Sciences, Sage, Thousand Oaks, CA.
Burke, R. (2002), “Technology and the customer interface: what consumers want in the physical and virtual store”, Journal of the Academy of Marketing Science, Vol. 30 No. 4, pp. 411-32. Cai, S. and Jun, M. (2003), “Internet users’ perceptions of online service quality: a comparison of online buyers and information searchers”, Managing Service Quality, Vol. 13 No. 6, pp. 504-19.
Campbell, D. and Fiske, D. (1959), “Convergent and discriminant validity by the multitrait-multimethod matrix”, Psychological Bulletin, Vol. 56, pp. 81-105.
Darian, J. (1987), “In-home shopping: are there consumer segments?”, Journal of Retailing, Vol. 63 No. 2, pp. 163-86.
Davidow, W. and Uttal, B. (1989), “Service companies: focus or falter”, Harvard Business Review, July/August, pp. 77-85.
Dibb, S. (2000), “Market segmentation”, in Blois, K. (Ed.), The Oxford Textbook of Marketing, Oxford University Press, New York, NY.
Drolet, A. and Morrison, D. (2001), “Do we really need multiple-item measures in service research?”, Journal of Service Research, Vol. 3 No. 3, pp. 196-204.
Eastlick, M. (1993), “Predictors of videotex adoption”, Journal of Direct Marketing, Vol. 7 No. 3, pp. 66-74.
Eurostat (2003), “Statistics on the information society in Europe”, available at: http://europa.eu. int/comm/enterprise/ict/studies/is-stat-96-02.pdf
Evans, P. and Wurster, T. (1999), Blown to Bits: How the New Economics of Information Transforms Strategy, Harvard Business School, Boston, MA.
Ferdows, K. and de Meyer, A. (1990), “Lasting improvements in manufacturing performance: in search of a new theory”, Journal of Operations Management, Vol. 9 No. 2, pp. 168-84. Fogliatto, F. and da Silveira, G. (2008), “Mass customization: a method for market segmentation
and choice menu design”, International Journal of Production Economics, Vol. 111 No. 2, pp. 606-22.
Fram, E. and Grady, D. (1995), “Internet buyers: will the surfers become buyers?”, Direct Marketing, Vol. 58 No. 6, pp. 63-5.
Fram, E. and Grady, D. (1997), “Internet shoppers: is there a surfer gender gap?”, Direct Marketing, Vol. 59 No. 9, pp. 46-50.
Garbarino, E. and Strahilevitz, M. (2004), “Gender differences in the perceived risk of buying online and the effects of receiving a site recommendation”, Journal of Business Research, Vol. 57 No. 7, pp. 768-75.
Gervey, B. and Lin, J. (2000), “The age factor: how internet use varies from teens to seniors”, Advertising Age, Vol. 71 No. 16, p. 22.
Hair, J., Anderson, R., Tatham, R. and Black, W. (1998), Multivariate Data Analysis, 5th ed., Prentice-Hall, Englewood Cliffs, NJ.
Hammond, K., McWilliam, G. and Diaz, A. (1998), “Fun and work on the web: differences in attitude between novices and experienced users”, Advances in Consumer Research, Vol. 25 No. 1, pp. 372-8.
Harrison, A. and Rainer, R. (1992), “The influence of individual differences on skill in end-user computing”, Journal of Management Information Systems, Vol. 9 No. 1, pp. 93-111. Heim, G. and Field, J. (2007), “Process drivers of e-service quality: analysis of data from an online
rating site”, Journal of Operations Management, Vol. 25 No. 5, pp. 962-84.
Heim, G. and Sinha, K. (2001), “A product-process matrix for electronic B2C operations”, Journal of Service Research, Vol. 3 No. 4, pp. 286-99.
Hensley, R. (1999), “A review of operations management studies using scale development techniques”, Journal of Operations Management, Vol. 17 No. 3, pp. 343-58.
Hill, A., Collier, D., Froehle, C., Goodale, J., Metters, R. and Verma, R. (2002), “Research opportunities in service process design”, Journal of Operations Management, Vol. 20 No. 2, pp. 189-202.
Hill, T. (1985), Manufacturing Strategy: The Strategic Management of the Manufacturing Function, Macmillan, London.
Hitt, L. and Frei, F. (2002), “Do better customers utilize electronic distribution channels? The case of PC banking”, Management Science, Vol. 48 No. 6, pp. 732-48.
Iqbal, Z., Verma, R. and Baran, R. (2003), “Understanding consumer choices and preferences in transaction-based e-services”, Journal of Service Research, Vol. 6 No. 1, pp. 51-65. Jenkins, M. and McDonald, M. (1997), “Market segmentation: organizational archetypes and
research agendas”, European Journal of Marketing, Vol. 31 No. 1, pp. 17-32. Kotler, P. (1991), Marketing Management, Prentice-Hall, Englewood Cliffs, NJ.
Lemmink, J. (2005), “The need for more multidisciplinary research”, International Journal of Service Industry Management, Vol. 16 No. 1, pp. 7-9.
Loiacono, E., Watson, R. and Goodhue, D. (2001), “WebQual: a website quality instrument”, working paper, University of Georgia, Athens, GA.
Loudon, D. and Bitta, A. (1993), Consumer Behavior: Concepts and Applications, McGraw-Hill, New York, NY.
Miller, J. and Roth, A. (1994), “A taxonomy of manufacturing strategies”, Management Science, Vol. 40 No. 3, pp. 285-304.
Miyazaki, A. and Fernandez, A. (2001), “Consumer perceptions of privacy and security risks for online shopping”, Journal of Consumer Affairs, Vol. 35 No. 1, pp. 27-44.
Moe, W. and Fader, P. (2001), “Uncovering patterns in cybershopping”, California Management Review, Vol. 43 No. 4, pp. 106-17.
Novak, T., Hoffman, D. and Yung, Y. (2000), “Measuring the customer experience in online environments: a structural modeling approach”, Marketing Science, Vol. 19 No. 1, pp. 22-42. O’Leary-Kelly, S. and Vokurka, R. (1998), “The empirical assessment of construct validity”,
Journal of Operations Management, Vol. 16 No. 4, pp. 387-405.
Olson, J. and Boyer, K. (2005), “Internet ticketing in a not-for-profit, service organization: building customer loyalty”, International Journal of Operations & Production Management, Vol. 25 No. 1, pp. 74-92.
Parasuraman, A. and Zinkhan, G. (2002), “Marketing to and serving customers through the internet: an overview and research agenda”, Journal of the Academy of Marketing Science, Vol. 30 No. 4, pp. 286-95.
Parasuraman, A., Zeithaml, V. and Malhotra, A. (2005), “E-S-QUAL: a multiple-item scale for assessing electronic service quality”, Journal of Service Research, Vol. 7 No. 3, pp. 213-33. Patricio, L., Fisk, R. and Cunha, J. (2003), “Improving satisfaction with bank service offerings: measuring the contribution of each delivery channel”, Managing Service Quality, Vol. 13 No. 6, pp. 471-82.
Peppers, D., Rogers, M. and Dorf, B. (1999), The One to One Field Book, Currency Doubleday, New York, NY.
Phillips, L. (1981), “Assessing measurement error in key informant reports: a methodological note on organizational analysis in marketing”, Journal of Marketing Research, Vol. 18 No. 4, pp. 395-415.
Podsakoff, P., MacKenzie, S., Lee, J. and Podsakoff, N. (2003), “Common method biases in behavioral research: a critical review of the literature and recommended remedies”, Journal of Applied Psychology, Vol. 88 No. 5, pp. 879-903.
Pullman, M. and Moore, W. (1999), “Optimal service design: integrating marketing and operations perspectives”, International Journal of Service Industry Management, Vol. 10 No. 2, pp. 239-60.
Reichheld, F. and Schefter, P. (2000), “E-loyalty: your secret weapon on the web”, Harvard Business Review, Vol. 78 No. 4, pp. 105-14.
Rust, R. (2004), “A call for a wider range of service research”, Journal of Service Research, Vol. 6 No. 3, p. 211.
Rust, R., Zohorik, A. and Keiningham, T. (1995), “Return on quality (ROQ): making service quality financially accountable”, Journal of Marketing, Vol. 59 No. 2, pp. 58-70.
Schneider, M. (2008), “A general model for the design of data warehouses”, International Journal of Production Economics, Vol. 112 No. 1, pp. 309-25.
Schneiderman, B. (1998), Designing the User Interface: Strategies for Effective Human-Computer Interaction, Addison-Wesley, Reading, MA.
Sexton, R., Johnson, R. and Hignite, M. (2002), “Predicting internet/e-commerce use”, Internet Research: Electronic Networking Applications Policy, Vol. 12 No. 5, pp. 402-10.
SIBIS (2003a), “Benchmarking social inclusion in the information society in Europe and the US”, Project IST-2000-26276 SIBIS Statistical Indicators Benchmarking the Information Society, available at: www.empirica.biz/sibis/files/download/reports2.htm
SIBIS (2003b), “Measuring the information society in the EU, the EU accession countries, Switzerland and the US”, Project IST-2000-26276 SIBIS Statistical Indicators Benchmarking the Information Society, available at http: www.sibis-eu.org/sibis/ publications/pocketbook.htm
Smith, T. (1993), “The relationship of age and education across time”, Social Science Research, Vol. 22, pp. 300-11.
Smith, T. and Reece, J. (1999), “The relationship of strategy, fit, productivity, and business performance in a services setting”, Journal of Operations Management, Vol. 17 No. 2, pp. 145-61.
Sousa, R. and Voss, C. (2006), “Service quality in multi-channel services employing virtual channels”, Journal of Service Research, Vol. 8 No. 4, pp. 356-71.
Spathis, C., Petridou, E. and Glaveli, N. (2004), “Managing service quality in banks: customers’ gender effects”, Managing Service Quality, Vol. 14 No. 1, pp. 90-102.
Teo, T. (2001), “Demographic and motivation variables associated with internet usage activities”, Internet Research: Electronic Networking Applications Policy, Vol. 11 No. 2, pp. 125-37. van Dierdonck, R. and Brandt, G. (1988), “Focused factory in service industries”, in Johnston, R.
(Ed.), The Management of Service Operations, IFS, Springer, Berlin.
Venkatesh, V. and Morris, M. (2000), “Why do not men ever stop to ask for directions? Gender, social influence, and their role in technology acceptance and usage behavior”, MIS Quarterly, Vol. 24 No. 1, pp. 115-39.
Verma, R. and Young, S. (2000), “Configurations of low-contact services”, Journal of Operations Management, Vol. 18 No. 6, pp. 643-61.
Verma, R., Iqbal, Z. and Plaschka, G. (2004), “Understanding customer choices in e-financial services”, California Management Review, Vol. 46 No. 4, pp. 43-67.
Voss, C. (2003), “Rethinking paradigms of service: service in a virtual environment”, International Journal of Operations & Production Management, Vol. 23 No. 1, pp. 88-105. Voss, C., Roth, A., Chase, R., Rosenzweig, E. and Blackmon, K. (2004), “A tale of two countries – conservatism, service quality, feedback and customer satisfaction”, Journal of Service Research, Vol. 6 No. 3, pp. 212-30.
Wiedmann, K., Buxel, H. and Walsh, G. (2002), “Customer profiling in e-commerce: methodological aspects and challenges”, Journal of Database Marketing, Vol. 9 No. 2, pp. 170-84.
Wolfinbarger, M. and Gilly, M. (2001), “Shopping online for freedom, control and fun”, California Management Review, Vol. 43 No. 2, pp. 34-55.
Wolfinbarger, M. and Gilly, M. (2002), “.comQ: dimensionalizing, measuring, and predicting quality of the e-tail experience”, Working Paper No. 02-100, Marketing Science Institute, Cambridge, MA.
Yang, Z., Jun, M. and Peterson, R. (2004), “Measuring customer perceived online service quality: scale development and managerial implications”, International Journal of Production & Operations Management, Vol. 24 No. 11, pp. 1149-74.
Yoo, B. and Donthu, N. (2001), “Developing a scale to measure the perceived quality of an internet shopping site (SITEQUAL)”, Quarterly Journal of Electronic Commerce, Vol. 2 No. 1, pp. 31-46.
Zeithaml, V. and Gilly, M. (1987), “Characteristics affecting the acceptance of retailing technologies: a comparison of elderly and nonelderly consumers”, Journal of Retailing, Vol. 63 No. 1, pp. 49-68.
Zeithaml, V., Parasuraman, A. and Malhotra, A. (2002), “Service quality delivery through web sites: a critical review of extant knowledge”, Journal of the Academy of Marketing Science, Vol. 30 No. 4, pp. 362-75.
Corresponding author