SAND BAR OPENING IN A COASTAL LAGOON (IQUIPARI)
IN THE NORTHERN REGION OF RIO DE JANEIRO STATE:
HYDROLOGICAL AND HYDROCHEMICAL CHANGES
SUZUKI, M. S., FIGUEIREDO, R. O., CASTRO, S. C., SILVA, C. F., PEREIRA, E. A., SILVA, J. A. and ARAGON, G. T.
Laboratório de Ciências Ambientais, Universidade Estadual do Norte Fluminense (UENF), Av. Alberto Lamego, 2000, CEP 28015-620, Campos dos Goytacazes, RJ, Brazil
Correspondence to: Marina Satika Suzuki, Laboratório de Ciências Ambientais, Universidade Estadual do Norte Fluminense (UENF), Av. Alberto Lamego, 2000, CEP 28015-620, Campos dos Goytacazes, RJ, Brazil,
e-mail: marina@cbb.uenf.br
Received July 31, 2000 – Accepted December 11, 2000 – Distributed February 28, 2002 (With 7 figures)
ABSTRACT
The aim of this paper was to verify hydrological and hydrochemical changes in the Iquiparí Lagoon water column, during three months, as related to an artificial sand bar opening. A drastic reduction in water volume occurred 28 hours after the sand bar opening, exposing the bottom sediment. This was densely colonized by submerged aquatic plants, which were dominant in the ecosystem metabolism, specially near the sand bar. An increase in salinity values, and dissolved and total nutrient concentra-tions, was observed during the sand bar opening period. In contrast, chlorophyll a concentration decreased. These changes were associated with: 1) mix of remained brackish and marine waters; 2) nutrient release from sediments by physical processes; and 3) submerged plant death. After the sand bar closure, lagoon metabolism was completely regulated by a dense phytoplankton community. We observed that the sand bar opening resulted in an extensile replacement of the lagoon’s water and a change in the community mainly responsible for the ecosystem metabolism.
Key words: sand bar opening, coastal lagoon, hydrology, hydrochemistry.
RESUMO
Abertura de barra em uma lagoa costeira (Iquiparí) na região Norte Fluminense: alterações hidrológicas e hidroquímicas
O presente trabalho teve por objetivo avaliar as alterações hidrológicas e hidroquímicas na coluna d’água da lagoa costeira de Iquiparí, ao longo de três meses, quando esta foi submetida a processo artificial de abertura de barra. Nas 28 horas que se seguiram à abertura da barra, o volume de água foi drasticamente reduzido. Os sedimentos de fundo, densamente colonizados por plantas aquáticas submersas que dominavam o metabolismo da lagoa costeira, foram em grande parte expostos ao ar, principalmente nas porções mais próximas ao mar. Observou-se, durante o período em que a barra esteve aberta, grande elevação da salinidade e da concentração de nutrientes dissolvidos e totais, e, em contraste, redução da biomassa fitoplanctônica. Estes fatos estão associados a: 1) mistura da água salobra remanescente com a marinha; 2) processos físicos de liberação de nutrientes do sedimento; e 3) morte das plantas submersas. Após o fechamento da barra, foi constatado intenso desenvolvimento da comunidade fitoplanctônica, que passou a dominar o metabolismo do ecossistema, especialmente nas porções mais próximas ao mar. Verificou-se que a abertura da barra resultou em substituição quase total das águas da lagoa costeira e alterou o tipo de comunidade predominante no metabolismo do sistema.
INTRODUCTION
Coastal lagoons have peculiar functional and structural characteristics due to their localization between land and sea. They generally show large temporal and spatial variations in hydrochemical characteristics and considerable biological diversity (Yãnez-Arancibia, 1987; Castel et al., 1996). The shallowness of these systems promotes a short nutrient turnover (Nixon, 1981, 1982), resulting in high primary productivity (Knoppers, 1994) and high fishing production (Yãnez-Arancibia et al., 1994).
The artificial opening of sand bars separating the coastal lagoons from the sea is a common prac-tice in the northern region of Rio de Janeiro State. It is intended to both control water level and/or improve commercial fishing activity (Oliveira et al., 1955; Oliveira & Krau, 1955; Aguiaro & Caramaschi, 1996; Saad, 1996). However, the environmental impact entailed by this management has received little attention (Saad, 1996; Suzuki et al., 1998; Kozlowsky-Suzuki, 1998). These sand bar openings can cause radical alterations in physicochemical, chemical, and physical conditions, including drastic reduction of the water volume and profound alterations in the biotic communities due to brackish water overflow and salt water influx.
To determine the hydrological and hydroche-mical changes caused by the artificial sand bar opening event in Iquiparí Lagoon, selected limnolo-gical variables in the water column before, during, and after the opening were monitored.
MATERIAL AND METHODS
Study area
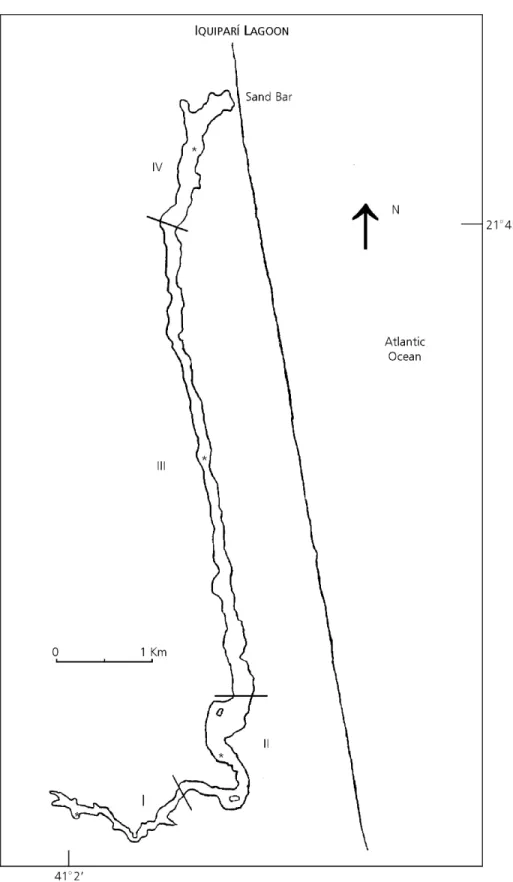
Iquiparí Lagoon is a small, isolated, coastal lagoon situated in the northern region of Rio de Janeiro State, in the city of São João da Barra, between 21o44’20” and 21o48’12”S and 41º01’34” and 41º02’04”W (Fig. 1). Pastures and areas of native vegetation (restinga) cover its water shed. The Lagune is based on quartenary fluvial-marine sand deposits. Its water surface has been estimated at 1.4 km2 with an extension of 10 km, based on satellite images obtained from the National Institute of Space Research (INPE), in August 1992. In September 1996 the lagoon was submitted to a sand
bar opening process which lasted 12 days (Sep-tember 10-22). This was because of the intense development of a mixed bank of Najas marina L., a submerged aquatic macrophyte and macroalgae of the genera Chara (Vaill.) A. Br. at the closest portion of the bar, which impeded both navigation and fishing.
Hydrological dynamics
Prior to the sand bar opening, the relationship between the lagoon water level and the average sea level was calculated based on a topographical profile of the sand bar, obtained through an adap-tation of Emery’s methodology, described in Cunha & Guerra (1996), and with information from a table of tides (DHN, 1996). Peculiar physiographical characteristics of the lagoon allowed its division in four sectors, as presented in Fig. 1. Total water volume before the opening was estimated by the bathymetry of transversal profiles for each sector multiplied by its area.
A water level ruler was installed in sector IV before the sand bar opening on 8 September 1996. Water level was then measured daily throu-ghout the period before the sand bar opening, at low and high tides during the period in which the bar remained open, and daily for one month fol-lowing sand bar closure. This procedure allowed evaluation of lagoon volume variations during this research. The volume variations were used to deter-mine water and nutrient fluxes during the open period and the time necessary after the sand bar closure for the lagoon to recuperate its level prior to the sand bar opening.
The rainfall data for the studied period was obtained at a meteorological station in Campos dos Goytacazes, a city located about 30 km from the Iquiparí lagoon.
Hydrochemical characterization
Fig. 1 — Iquiparí Lagoon map obtained from satellite photos WRS 216/075 B and D, TM5 (INPE, 08/01/1992). The
The water column was sampled with a van Dorn bottle at a subsurface depth of about 0.5 m. Subsamples of 50 ml were used for deter-mining total alkalinity by potentiometric titration (Gran, 1952).
Other subsamples were filtered under vacuum using in a GF/F filter (0.7 µm) and then frozen for later determination of dissolved nutrient concen-trations (ortho-phosphate – P-PO4
3−, ammonium nitrogen – N-NH4+, and reactive silica – SiO2,
accor-ding to methodologies described in Grasshoff et al. (1983) and Strickland & Parsons (1978). Nitrate (N-NO3−) and nitrite (N-NO
2
−) were determined using the FIA, ASIA ISMATEC methods. The material retained by the filter membranes was used to de-termine chlorophyll a (Nusch & Palme, 1975) and particulate organic carbon (POC) (Carmouze, 1994). Non-filtered subsamples were used for ascertaining total nutrients (N-total, P-total) according to metho-dology described in Carmouze, 1994.
RESULTS AND DISCUSSION
Hydrological dynamic
The topographic profile of the sand bar (Fig. 2) shows that before its opening the Iquiparí Lagoon water level was around 1.5 m above the average sea level. This measurement indicated that a great amount of water would flow out into the marine system during the sand bar opening. Integration of the sand bar topographic profile with a schematic profile of the lagoon’s central channel obtained by bathimetry (Fig. 3) clearly showed that a portion of about 4.5 km in the extreme south of the lagoon was above the average sea level, suggesting the total outflow water from sectors I and II.
The sand bar opening corroborated this hypo-thesis: 28 hours after the estimated lagoon water volume was 318,000 m3. Since the estimated vo-lume before the opening was 1,109,000 m3, a re-duction occurred of about 70% in the original volume.
–100 0 100 200 300 400
0 20 40 60 80
Distance from the sea (m)
Lagoon water level before sand bar opening
Elevation
(cm)
Fig. 2 — Topographic profile of the sand bar of Iquiparí Lagoon. Elevation is reported for the mean sea level (zero).
–1 0 1 2 3 4
0 2000 4000 6000 8000 10000
IV III II I
a
b
Distance from the sea (m)
Elevation
(m)
Fig. 3 — Schematic profile of the of the Iquiparí Lagoon main channel integrating the topographic profile of the sand bar and bathymetry. Note that horizontal scale of the sand bar profile is compressed. The elevation is reported for the mean sea level (zero). The pointed lines a and b indicate lagoon water level before and 28 hours after sand bar opening.
While the sand bar remained open, the lagoon functioned as an estuary with an average of 168,000 m3.day–1 displacement controlled by the daily tide cycles. For the 12-day period in which the sand bar remained open, this amount corresponded to a volume superior to that of total lagoon water prior to the sand bar opening (1,880,000 m3). This sizeable water exchange shows that the lagoon water was almost completely substituted in relatively little time.
After the closure of the sand bar, the estimated water volume was reduced to less than 20% of the initial total (214,000 m3) causing aerial exposition of sediments in sectors I and II. Only a small, narrow central channel, through which freshwater came from seepage, remained. Due to the fact that the lagoon has no tributaries, the filling and maintenance of the lagoon water column was mainly through groundwater, run off, and direct rainfall.
Estimated freshwater flow into the lagoon after the bar closure was 30,000 m3.day–1. This should have returned it to the initial water level after approximately 1 month.
Hydrochemical dynamic
Before the sand bar opening Iquiparí Lagoon could be hydrochemically characterized as fresh-water (salinity from 0.3 to 0.9 p.s.u.), and based on the water color and dominant plant community this lagoon would be divided physiographically in four sectors (Fig. 1), as described below.
The first lagoon sector (sector I) presented dark brown coloration (Pt440nm = 264 mg.L–1, accor-ding to Cuthbert & Del Giorgio, 1992), suggesting a significant influx of groundwater, rich in organic acid compounds and originally from the sandbank and the adjacent wetlands. The groundwater in this region presents high nutrient concentrations and low values of pH and dissolved oxygen (Suzuki et al., 1998). As a consequence, sampling station I presented, before the sand bar opening, higher concentrations of dissolved nutrients (2.7 µM P-PO43−; 1.0 µM N-NO3− and 10 µM N-NH4+), as well
as lower pH (7.2) and dissolved oxygen contents (62%) than the other sector stations.
The large fluctuation of dissolved oxygen and pH values during the period prior to the sand bar opening (Fig. 4) suggests intense biological activity in this part of the lagoon. The shallowness of the water column (maximum = 0.8 m) resulted in exu-berant growth of aquatic macrophytes, in
parti-cular Typha domingensis Pers, complicating the physical delimitation of this area of the lagoon as a consequence of the large littoral zone. Besides the ample availability of nutrients in this region, values of chlorophyll a were low (12 µg.L–1), which indicated limited phytoplankton growth, attributed to dark water. Thus the food web would be main-tained principally by organic matter coming from the inundated adjacent areas. This first sector was almost completely drained during the sand bar ope-ning. About two month after the closure, lower values of oxygen saturation (8.5%) and higher values of alkalinity (3.11 mEq.L–1), N-NH
4
+ (37 µM) and P-total (15 mM) were observed, indicating an inten-sification of the organic matter decomposition process in this sector.
Sector II displayed a mix of dark and clear waters, allowing development of the phytoplankton community, which had reached a biomass of 68 µgChloa.L–1 (Fig. 5) before the sand bar opening. This resulted in lower concentrations of dissolved nutrients than those in sector I (0.4 µM P-PO43−;
0.5 µM N-NO3− and 0.5 µM N-NH4+). Also, in the
greater depth (1.2 m) of station I limited the deve-lopment of T. domingensis, limited to the lesser shore.
Sector III comprises the main body of the lagoon and presents abrupt margins and the greatest depth (2.0 m). Its water is clear; prior to the sand bar opening, the phytoplankton community pre-sented high biomass (73 µgChloa.L–1) as opposed to the low concentrations of dissolved nutrients (0.2 µM P-PO4
3−; 0.5 µM N-NO 3
− and 0.3 µM
N-NH4+) (Fig. 6).
Low dissolved nutrient amount and the high contents of chlorophyll a, total nitrogen (> 140 µM), total phosphate (> 7.0 µM), and particulate organic carbon (> 5.5 mg.L–1) in sectors II and III suggest the existence of an efficient internal system of nutrient regeneration related to decomposers able to quickly restore the dead organic matter (Azam et al., 1983; Caumette, 1996). The great phytoplankton biomass suggests that the water metabolism is dominated by this community spe-cially in station III.
of the phytoplankton community by nutrient com-petition (Wetzel, 1983) (< 1.4 µM P–PO4
3−; 0.5 µM N–NO3− and 0.3 µM N–NH4+), in an area which had
presented low biomass before the sand bar opening (5.5 µgChloa.L–1 – Fig. 7).
In sampling stations II to IV, during the sand bar opening period, the studied hydrochemical variables presented strong oscillations and a ten-dency to return quickly to initial conditions after closure (Figs. 5 to 7).
Fig. 4 — Bathymetry profile (a) and hydrochemistry of Iquiparí Lagoon water in sector I before, during (dark bar on horizontal axis), and after sand bar opening: (b) salinity (p.s.u.) and dissolved oxygen saturation (%); (c) pH and total alkalinity (mEq.L–1); (d) ortho-phosphate and ammonium nitrogen (µM); and (e) total nitrogen and total phosphate (µM),
chloro-phyll a (µg.L–1) and POC (mg.L–1).
0.0 0.1 0.2 0.3
0 20 40 60 80 100
23/Aug/96 20/Nov/96
6 7 8 9
0 1 2 3 4
23/Aug/96 20/Nov/96
0 1 2 3
0 10 20 30 40
23/Aug/96 20/Nov/96
0 20 40 60 80 100
0 10 20
23/Aug/96 20/Nov/96
0
0.2
0.4
0.6
0.8
1
0 5 10 15 20 25 30 35 40 45 50
Salinity DO (%Sat)
(b)
pH Total alk.(mEq.L )–1
(c)
Ortho-phosphate ( M)µ N-ammonium. ( M)µ
(d)
N-total ( M)µ Chlo ( g.L )aµ –1
P-total ( M)µ POC (mg.L )–1
(e) Width (m) (a)
Salinity
Depth
(m)
Ortho-phosphate
Dissolved
oxigen
Total
alkalinity
POC
P-total
N-ammonium Chlo
N-total
a
Sector I
pH
Fig. 5 — Bathymetry profile (a) and hydrochemistry of Iquiparí Lagoon water in sector II before, during (dark bar on horizontal axis), and after sand bar opening: (b) salinity (p.s.u.) and dissolved oxygen saturation (%); (c) pH and total alkalinity (mEq.L–1); (d) ortho-phosphate and ammonium nitrogen (µM); and (e) total nitrogen and total phosphate (µM),
chlorophyll a (µg.L–1) and POC (mg.L–1).
0 1 2 3
0 50 100 150
23/Aug/96 Sep Oct 20/Nov/96
(b)
6 7 8 9 10
0 1 2 3 4
23/Aug/96 Sep Oct 20/Nov/96
(c)
0 100 200 300 400 500
0 10 20
23/Aug/96 Sep Oct 20/Nov/96
(e)
0 2 4 6 8 10
0 50 100 150
23/Aug/96 Sep Oct 20/Nov/96
(d) 0
0.4
0.8
1.2
0 10 20 30 40 50 60 70 80 90 100
Bottom After closure (9/22/96) Before opening (9/8/96)
(a)
Salinity DO (%Sat) pH Total alk.(mEq.L )–1
Ortho-phosphate ( M)µ N-ammonium. ( M)µ N-total ( M)µ Chlo ( g.L )
aµ –1
P-total ( M)µ POC (mg.L )–1
Width (m)
Salinity
Depth
(m)
Ortho-phosphate
Dissolved
oxigen
Total
alkalinity
POC
P-total
N-ammonium Chlo
N-total
a
Sector II
Fig. 6 — Bathymetry profile (a) and hydrochemistry of Iquiparí Lagoon water in sector III before, during (dark bar on horizontal axis), and after sand bar opening: (b) salinity (p.s.u.) and dissolved oxygen saturation (%); (c) pH and total alkalinity (mEq.L–1); (d) ortho-phosphate and ammonium nitrogen (µM); and (e) total nitrogen and total phosphate (µM),
chlorophyll a (µg.L–1), and POC (mg.L–1).
0 1 2 3
0 50 100 150 200
23/Aug/96 Sep Oct 20/Nov/96
6 7 8 9 10
0 1 2 3 4
23/Aug/96 Sep Oct 20/Nov/96
0 200 400 600
0 10 20
23/Aug/96 Sep Oct 20/Nov/96
0 3 6 9 12
0 50 100 150 200
23/Aug/96 Sep Oct 20/Nov/96
0
1
2
3
0 10 20 30 40 50 60 70 80 90
(a)
Salinity DO (%Sat)
(b)
pH Total alk.(mEq.L )–1
(c)
Ortho-phosphate ( M)µ N-ammonium. ( M)µ
(d)
N-total ( M)µ Chlo ( g.L )aµ –1
P-total ( M)µ POC (mg.L )–1
(e) Width (m)
Salinity
Depth
(m)
Ortho-phosphate
Dissolved
oxigen
Total
alkalinity
POC
P-total
N-ammonium Chlo
N-total
a
Sector III
pH
Fig. 7 — Bathymetry profile (a) and hydrochemistry of Iquiparí Lagoon water in sector IV before, during (dark bar on horizontal axis), and after sand bar opening: (b) salinity (p.s.u.) and dissolved oxygen saturation (%); (c) pH and total alkalinity (mEq.L–1); (d) ortho-phosphate and ammonium nitrogen (µM); and (e) total nitrogen and total phosphate (µM),
chlorophyll a (µg.L–1), and POC (mg.L–1).
6 7 8 9 10
0 2 4 6
23/Aug/96 Sep Oct 20/Nov/96
0 100 200 300
0 10 20
23/Ago/96 Set Out 20/Nov/96
0 2 4 6 8 10
0 20 40 60 80 100
23/Aug/96 Sep Oct 20/Nov/96
0 3 6 9 12
0 20 40 60 80 100
23/Aug/96 Sep Oct 20/Nov/96
0 0.5
1 1.5 2
0 20 40 60 80 100
Salinity DO (%Sat)
(b)
pH Total alk.(mEq.L )–1
(c)
Ortho-phosphate ( M)µ N-ammonium. ( M)µ
(d)
N-total ( M)µ Chlo ( g.L )aµ –1
P-total ( M)µ POC (mg.L )–1
(e) Width (m) (a)
Salinity
Depth
(m)
Ortho-phosphate
Dissolved
oxigen
Total
alkalinity
POC
P-total
N-ammonium Chlo
N-total
a
Sector IV
pH
Sectors II to IV presented a water column of inconstant depths due to the tides during the sand bar opening period. They also presented, in this period and soon after it, increased electrical conduc-tivity, which even in sector IV never exceeded 12 mS.cm–1. This suggests marine influence of moderate intensity, reflected by a mixture of marine and re-maining brackish water at that time. Two months after the natural closure of the bar, the lagoon water was fresh again (0.4 to 1.3 mS.cm–1), making clear that there was a major fresh water influx into the system, specially from groundwater sources.
Water column reduction caused drastic al-terations in the physicochemical, chemical, and biological characteristics of the lagoon water des-pite minor marine influence during the bar opening period. Movement of the water masses caused sediment resuspension and porewater advection; these processes together with the death and decom-position of the aquatic macrophytes and submerged algae, resulted in a great increased concentration of dissolved and total nutrients in the water column. Usually low values for ortho-phosphate and ammo-nia nitrogen increased 12 times over, reaching values up to 11 and 154 µM, respectively (Figs. 5 to 7).
The great availability of dissolved nutrients and the absence of potential competitors (macro-phytes and macroalgae) caused intense growth of the phytoplankton community immediately after the sand bar closure, specially in sectors II, III, and IV. The phytoplankton community presented in sector II the largest development, as reflected by the high biomass of 545 µgChloa.L–1 and high concentrations of total nutrients (N-total = 346 µM
and P-total = 19 µM) and POC (11 mg.L–1), as shown in Fig. 6. Growth of the phytoplankton biomass also resulted in increased pH (8.97) and total alkalinity (3.81 mEq.L–1) values, and depletion of dissolved nutrients.
The sand bar opening of the Iquiparí Lagoon in September 1996 caused a system whose meta-bolism had been partially dominated by aquatic macrophytes and submerged macroalgae to change into one totally dominated by an active phyto-plankton community. Probably this situation will invert as time goes on and if the interval between openings are long enough. This could happen due to the slow macrophyte and macroalga growth and to limiting factors, e.g., competition for nutrients; predators; and parasitism to which the phytoplankton community is subjected.
The sand bar opening also caused export of large amounts of organic and inorganic materials stored in the lagoonal system to the adjacent coastal marine system, a process representing great nutrient loss (Table 1).
The estimated outflow of dissolved nutrients, based on both concentration values a week before the sand bar opening and exported water volume, indicates a flow of less than 1% of that exported daily by the river Paraíba do Sul (Figueiredo, 1999). However, it is important to observe that this cal-culation – based on the momentary stock of the water column – did not take into account the nu-trients carried away by sediment resuspension, porewater advection, and partial exportation of the macrophytes and macroalgae biomass during the sand bar opening period. This may represent a great nutrient loss from the system.
Sector V before(m3) V 28hafter V flowed
out
P-PO SiO2 N- N-NO3 N- P-Total N-Total POC Chloa
IV 252,000 57,000 195,000 0.5 0.9 0.8 1.4 0.8 48.4 221.1 565.5 1.4
III 561,000 224,000 337,000 1.8 7.3 1.4 2.4 0.5 74.2 688.8 2,359.0 24.6
II 247,000 37,000 210,000 1.4 8.6 1.5 1.5 0.3 39.1 455.7 1,302.0 14.3
I 49,000 49,000 4.4 102.3 6.9 0.7 0.3 14.6 63.1 132.3 1.0
Total 1,109,000 318,000 791,000 8.1 119.1 10.6 5.9 1.9 176.2 1,428.8 4,358.8 41.2
TABLE 1
Total flux of water (m3) and nutrients (Kg) to marine coastal area during first 28 hours after the sand bar
opening in Iquiparí Lagoon.
H4
+
NO2
−
CONCLUSIONS
Considering the hydrodynamic, hydroche-mical, and biological aspects, the artificial sand bar opening of the Iquiparí Lagoon promoted se-vere alterations in the ecosystem. A somewhat relevant alteration is the change from a system with a metabolism partially dominated by aquatic macro-phytes and submerged macroalgae to one totally dominated by phytoplankton activity, which pre-sents accelerated metabolism and efficiency in assimilating dissolved nutrients. During the sand bar opening, a great loss of nutrients and biomass occurs but the lagoon quickly returns to previous hydrochemical conditions. The great increase in phytoplankton biomass suggests great capability to restore the base of food web. This shows the need for complementary studies, e.g., ecological modeling that may indicate the time required for this ecosystem to return to its natural conditions, and could subsidize future management plans for the regional coastal lagoons, facilitate fishery, and consequently have social as well as environmental implications.
Acknowledgment — The authors are grateful to Mr.
Antô-nio Carlos de Oliveira Pessanha for field help and to FENORTE for financial support.
REFERENCES
AGUIARO, T. & CARAMASCHI, E. P., 1996, Icthyofauna composition of three coastal lagoons in the north of the State of Rio de Janeiro (Brazil). Arq. Biol. Tecnol., 38(4):
1181-1189.
AZAM, F., FENCHEL, T., FIELD, J. G., GRAY, J. S., MEYER-REIL, L. A. & THINGSTAD, F., 1983, The ecological role of water-column microbes in the sea. Mar. Ecol. Prog. Ser., 10: 257-263.
CARMOUZE, J. P., 1994, O metabolismo dos ecossistemas aquáticos: fundamentos teóricos, métodos de estudo e análises químicas. Editora Edgard Blücher/FAPESP, São
Paulo, 254p.
CASTEL, J., CAUMETTE, P. & HERBERT, R., 1996, Eutro-phication gradients in coastal lagoons as exemplified by the Bassin dÁrcachon and the Étang du Prévost.
Hydrobiologia, 329: ix-xxviii.
CAUMETTE, P., 1986, Phototrophic sulphur bacteria and sul-phate reducing bacteria causing red waters in a shallow brackish coastal lagoon (Prévost Lagoon, France). FEMS Microbiol. Ecol., 38: 113-124.
CUNHA, S. B. & GUERRA, A. J. T., 1996, Geomorfologia, exercícios, técnicas e aplicações. Ed. Bertrand Brasil,
345p.
CUTHBERT, I. D. & DEL GIORGIO, P., 1992, Toward a stan-dard method of measuring color in freshwater. Limnol. Oceanogr., 37: 1319-1326.
DHN, 1996, Tábua de maré para 1996. Ed. DHN, Marinha
do Brasil, 196p.
FIGUEIREDO, R. O., 1999, Transporte de carbono e nitro-gênio no baixo Paraíba do Sul: fluxos e processos. Tese de Doutorado, UENF, Campos dos Goytacazes, 177p. GRAN, G., 1952, Determination of equivalent point in
poten-tiometric titration. Analyst., 77: 661-671.
GRASSHOFF, K. A., EHRHARDT, M. & KREMLING, K., 1983, Methods of seawater Analisys. 2. ed., Verlag
Che-mie, 419p.
KNOPPERS, B., 1994, Aquatic primary production in coastal lagoons. In: B. Kjerfve (ed.), Coastal lagoon processes. Amsterdan, Elsevier Oceanographyc Series 60, pp. 243-286.
KOZLOWSKY-SUZUKI, B., 1998, O efeito do enriquecimen-to artificial e das aberturas de barra sobre a dinâmica das variáveis abióticas e sobre a estrutura da comuni-dade zooplanctônica na Lagoa Imboacica, Macaé, RJ. Dissertação de Mestrado, UFRJ, Rio de Janeiro, 94p. NIXON, S. W., 1981, Remineralization and nutrient cycling
in coastal marine ecosystems. In: B. J. Neilson & L. E.
Cronin (eds.), Estuarries and nutrients. Clifton, New Jersey, Humana Press, pp. 111-138.
NIXON, S. W., 1982, Nutrient dynamics, primary produc-tion and fisheries yields of lagoons. Oceanologica Acta, 4: 357-371.
NUSCH, E. A. & PALME, G., 1975, Biologische methoden für die praxis der gewisseruntersuchung. 1. Bestimmung des Chlorophyll a und Phaeopigmentgehaltes in Oberflächenwasser. GWF, 116(12): 562-565.
OLIVEIRA, L. P. H. & KRAU, K., 1955, Observações biogeo-gráficas durante a abertura da barra da lagoa de Saqua-rema. Mem. Inst. Oswaldo Cruz, 53: 435-449.
OLIVEIRA, L. P. H., NASCIMENTO, R. & KRAU, K., 1955, Observações biogeográficas e hidrobiológicas sobre a la-goa de Maricá. Mem. Inst. Oswaldo Cruz, 53: 171-227. SAAD, A. M., 1996, Influência da abertura da barra sobre a comunidade de peixes da lagoa Imboacica, Macaé, RJ.
Dissertação de Mestrado, UFRJ, Rio de Janeiro, 130p. SCHWARZBOLD, A., FONSECA, O. J. M. & GUERRA, T., 1986, Aspectos limnológicos do Saco de Tapes, Laguna dos Patos. Acta Limnol. Brasil., 1: 89-112.
STRICKLAND, J. D. H. & PARSONS, T. R., 1978, A practi-cal handbook of seawater analysis. 2. ed., Ottawa,
SUZUKI, M. S., OVALLE, A. R. C. & PEREIRA, E. A., 1998, Effects of sand bar openings on some limnological va-riables in a hypertrophic tropical coastal lagoon, Brazil.
Hydrobiologia, 368: 111-122.
WETZEL, R. G., 1983, Limnology. 2. ed., Philadelphia,
Pennsylvania, Saunders, 743p.
YÃNEZ-ARANCIBIA, A., 1987, Lagunas costeras y estua-rios: cronolia, criterios, y conceptos para una clasificación ecológica de sistemas costeros. Revista de la Sociedad Mexicana de Historia Natural, 39: 35-54.
YÃNEZ-ARANCIBIA, A., LARA DOMINGUEZ, A. L. & PAULY, D., 1994, Coastal lagoons and fish habitats. In: