Cláudia V. Godoy1, Lucimara J. Koga2** & Marcelo G. Canteri2**
1Embrapa Soja, Cx. Postal 231, CEP 86001-970, Londrina, PR, fax: (43) 3371-6100, e-mail: [email protected];
2Departamento de Agronomia, Universidade Estadual de Londrina, CEP 86051-970, Londrina, PR, fax: (43) 3371-4697,
e-mail: [email protected]
(Accepted for publication on 10/10/2005)
Corresponding author: Cláudia V. Godoy
* Part of the second author’s Master Thesis. Universidade Estadual de Londrina (2005).
** CNPq fellowship
GODOY, C.V., KOGA, L.J. & CANTERI, M.G. Diagrammatic scale for assessment of soybean rust severity. Fitopatologia Brasileira 31:063-068. 2006.
ABSTRACT
A diagrammatic scale to assess soybean (Glycine max) rust severity, caused by the fungus Phakopsora pachyrhizi, was developed in this study. Leaflets showing different severity levels were collected for determination of the minimum and maximum severity limits; intermediate levels were determined according to “Weber-Fechner’s stimulus-response law”. The proposed scale showed the levels of 0.6; 2; 7; 18; 42, and 78.5%. Scale validation was performed by eight raters (four inexperienced and four experienced), who estimated the severity of 44 soybean leaflets showing rust symptoms, with and without the use of the scale. Except for rater number eight, all showed a tendency to overestimate severity without the aid of the diagrammatic scale. With the scale, the raters obtained better accuracy and precision levels, although the tendency to overestimate was maintained. Experienced raters were more accurate and precise than inexperienced raters, and assessment improvements with the use of the scale were more significant for inexperienced raters.
Additional keywords: disease assessment, Glycine max, Phakopsora pachyrhizi.
RESUMO
Escala diagramática para avaliação da severidade da ferrugem da soja
Uma escala diagramática para avaliação da severidade da ferrugem da soja (Glycine max), causada pelo fungo Phakopsora pachyrhizi, foi desenvolvida nesse trabalho. Folíolos com severidade em diferentes níveis foram coletados para determinação dos limites mínimos e máximos e os níveis intermediários foram determinados de acordo com a “lei do estímulo visual de Weber-Fechner”. A escala proposta apresentou os níveis de 0,6; 2; 7; 18; 42 e 78,5 %. A validação da escala foi realizada por oito avaliadores (quatro sem experiência e quatro com experiência), os quais estimaram a severidade de 44 folíolos de soja com sintomas de ferrugem, com e sem a utilização da escala. Com exceção do avaliador oito, todos apresentaram tendência de superestimar a severidade sem auxílio da escala diagramática. Com a escala, os avaliadores obtiveram melhores níveis de acurácia e precisão, embora a tendência para superestimiva tenha se mantido. Avaliadores experientes foram mais acurados e precisos do que avaliadores inexperientes, sendo a melhora nas avaliações com o uso da escala mais significativa para os avaliadores inexperientes.
Palavras-chave adicionais: avaliação de doenças, Glycine max, Phakopsora pachyrhizi.
INTRODUCTION
Asian soybean [Glycine max (L.) Merr.] rust, caused
by the fungus Phakopsora pachyrhizi (Syd. & P. Syd.), is
considered highly aggressive, damaging between 10% to 40% of soybean crops in Thailand, 10% to 90% in India, 10% to 50% in the south of China, 23% to 90% in Taiwan, and 40% in Japan (Sinclair & Hartman, 1999). Its occurrence was first reported in Brazil at the end of the 2001 cropping season, in the western region of the State of Paraná (Yorinori et al., 2002). At present, it has spread throughout
the main soybean producing regions, with estimated damages of up to 80% when under optimal conditions for the development of the fungus (Tecnologias, 2002).
The most common symptoms are gray green, tan to dark brown or reddish brown lesions with one to many erumpent, globose uredia, particularly on the underside of the leaflets. The lesions tend to be angular, are restricted by leaf veins, and reach 2 to 5 mm in diameter. Lesions may also appear on petioles, pods, and stems (Sinclair & Hartman, 1999). Severely infected plants show early defoliation, compromising pod formation and filling and final grain weight (Yang et al., 1991). Although damages
localities. When incidence (number, ratio, or percentage of diseased plants or plant parts in the sample or plant population) is not the most suitable variable in the quantification of leaf diseases, severity (absolute values, ratio, or percentage of tissue area or volume covered with symptoms) has been more frequently used (Gaunt, 1995).
In order to reduce the subjectivity of disease severity visual estimates, diagrammatic scales have been developed for several pathosystems (Amorim et al., 1993; Godoy et al., 1997; Giglioti & Canteri, 1998; Michereff et al., 2000;
Leite & Amorim, 2002; Martins et al., 2004). Diagrammatic
scales are illustrated representations of a series of plants or plant parts showing symptoms at different disease severity levels (Bergamin Filho & Amorim, 1996); their use must be easy and quick for a wide range of conditions, with reproducible, accurate, and precise results (Berger, 1980).
Some aspects must be considered in the preparation of diagrammatic scales: a) the lower and upper limits of the scale must correspond, respectively, to the minimum and maximum amounts of the disease observed in the field; b) the determination of the actual intensity of the disease in the field and its representation in the scale must have high precision; c) the intermediate levels must respect human visual acuity limitations as defined by Weber-Fechner’s stimulus-response law, where visual acuity is proportional to the logarithm of the stimulus intensity (Horsfall & Barratt, 1945; James, 1974; Bergamin Filho & Amorim, 1996).
In addition to the recommendations for their preparation, success in the use of diagrammatic scales depends on the experience and visual perception of each rater. Specific software can be used to train raters, thus improving their skills in the visual assessment of diseases and providing reduced subjectivity (Tomerlin & Howell, 1988; Nutter Jr. & Schultz, 1995; Canteri & Giglioti, 1998). Before diagrammatic scales can be used as a standard assessment method, they must be tested (validated) and, in the case of unsatisfactory results, they must be corrected.
An assessment method for soybean rust based on a three-digit rating system was suggested during a meeting of the soybean rust international group, in Chiang Mai, Thailand, in 1976. The first digit denotes the general position of the sampled leaf in the leaf canopy of the crop; the second, the disease severity of the sample leaf as rated by comparison with a standard diagram; and the third, the infection type present on the leaf. The rating system has some value in aiding selection in breeding programs, but it is of limited use in epidemiological investigation or in disease loss surveys because it is not truly quantitative. Scales developed for soybean rust have been published by Bromfield (1984); however, in some of the scales the severity represented in the diagrams show incorrectness in the disease amount and others are not truly quantitative.
Considering the growing need for studies on the epidemiology and control of soybean rust, associated with the absence of standardized methods for quantification of the disease, the objective of this work was to develop and
validate a diagrammatic scale for rust severity assessment in soybean.
MATERIALS AND METHODS
The scale developed in this study had different levels of severity represented in one soybean leaflet diagram. Leaves with the widest possible range of severity were collected from different soybean cultivars inoculated with
P. pachyrhizi uredospores in a greenhouse aiming to
represent the range of levels of severity and to determine the minimum limit (lowest amount of disease observed visually) and maximum limit (amount of disease from which senescence occurs). Plants artificially inoculated were used so that the only disease present on the leaves would be rust. After collection, the central leaflets of each trifoliolate leaf were photographed with a digital camera, and analyzed with regard to lesion shape, distribution, and frequency. The images were colored with the Paint Shop Pro 4.2 software; black was assigned to necrotic and chlorotic areas, while white was assigned to the healthy area. The Scion Image software was used to measure and determine total leaf area and total leaf lesion area, allowing severity of the disease to be obtained (actual leaf lesion area percentage). It was thus possible to determine the soybean leaflets with the least and greatest severity, therefore establishing the lower and upper limits of the diagrammatic scale. The intermediate levels of severity were mathematically determined according to Weber-Fechner’s stimulus-response law (Horsfall & Barratt, 1945).
The validation of the proposed scale was performed based on images of 44 soybean leaflets showing rust symptoms at different severity levels, assessed by eight persons, divided into two groups: inexperienced (four persons without experience in the quantification of the disease and without previous contact with the scale) and experienced (four persons that had worked with soybean rust quantification before, using the proposed scale). In order to estimate severity, the colorized leaflet images were used, where necrotic tissue and yellow halos were considered as diseased area. The eight raters performed an initial estimate without the scale and another immediately afterward using the scale proposed in this work. By comparing the data estimated by the raters with and without the aid of the diagrammatic scale (estimated severity), with the actual severity obtained with Scion Image, the accuracy and precision of assessments was verified, as well as the influence of the use of the diagrammatic scale.
The accuracyand precision of the assessments of each rater were determined by linear regression, where actual severity was the independent variable and estimated severity the dependent variable. The accuracy of the estimates of each rater was determined by t-test applied to the slope coefficient (b), to check whether they were significantly
different from 1.0, and to the intercept (a) to check whether
FIG 1 - Diagrammatic scale of soybean (Glycine max) rust severity (percentage of diseased leaf area).
TABLE 1 - Intercepts (a), slope coefficients (b), and coefficients of determination (R2) of the regression line for actual (independent variable) versus estimated severity (dependent variable) of soybean (Glycine max) rust for eight raters (1 to 4 inexperienced and without previous contact with the scale, 5 to 8 experienced and with previous contact with the scale) with and without the diagrammatic scale
*Situations in which the null hypothesis (a=0 or b=1) was rejected by t-test, p<0.01.
0 20 40 60 80
100
0 20 40 60 80
100
0 20 40 60 80
100
0 20 40 60 80
100
0 20 40 60 80 100 0 20 40 60 80 100
rater 4 rater 3 rater 2
rater 1 rater 5
rater 6
rater 7
rater 8
Estimated severity (%)
Actual severity (%) Actual severity (%)
FIG. 2 - Estimated severity (•) of soybean (Glycine max)rust
without the aid of the diagrammatic scale and linear regressions obtained between actual and estimated severity (solid line). Dotted lines represent an ideal situation, with estimated severity equal to actual severity. Raters 1 to 4 are inexperienced, without previous contact with the scale; raters 5 to 8 are experienced and have used the scale previously.
without scale with scale Rater
a b R2 a b R2
Inexperienced
1 6.57* 1.18 0.85 4.60* 0.92 0.90
2 25.50* 0.90 0.59 5.80* 0.96 0.78
3 41.38* 0.65* 0.6 5 13.22* 0.82 0.67
4 11.05* 1.24* 0.88 4.65* 1.04 0.90
Experienced
5 14.74* 0.98 0.75 7.91* 1.03 0.90
6 9.81* 1.19* 0.90 5.70* 1.05 0.89
7 5.96* 0.87* 0.92 1.57* 0.95 0.95
8 -1.10* 0.83* 0.93 -1.90* 0.78* 0.91
0,6% 2,0% 7,0% 18,0% 42,0% 78,5% the assessments was estimated by the coefficient of determination (R2) of the same regression line and by the variance of the absolute errors (estimated severity minus actual severity) for each assessment (Nutter Jr. & Schults, 1995).
RESULTS AND DISCUSSION
The values for the lower and upper limits of the diagrammatic scale devised in this work, with six severity levels, were 0.6 and 78.5% of the leaf area with lesions (Figure 1). The representation of the symptoms includes tissues that became necrotic because of pustules, chlorotic halos, and coalesced lesions. Values above 80% are rarely found in the field, since rust causes rapid leaf senescence and defoliation.
Accuracy, represented by the degree of proximity of a mean estimate and reality (Nutter et al., 1991), measured
by the intercepts (a) and by the slope coefficients (b) of the
regression line between actual and estimated severity, was higher for experienced raters, with and without use of the scale (Table 1, Figures 2 and 4). Except for rater eight, all others showed a tendency to overestimate severity without
the aid of the diagrammatic scale. This tendency was greater with inexperienced raters. When the scale was used, this tendency was maintained, but overestimation decreased (Figure 4). Leaves where similar severities are represented by different numbers and, consequently, sizes of lesions, often generate different estimates, and the tendency is to overestimate severity when the number of lesions is higher and their size smaller (Sherwood et al., 1983; Godoy et al.,
1997). The use of the scale improved the accuracy of assessments and, except for rater eight, all showed slope coefficient values for the regression line statistically equal to 1 (p<0.01) in the assessment with the aid of the proposed scale (Table 1).
-80 -40 0 40 80 -80 -40 0 40 80 -80 -40 0 40 80 -80 -40 0 40 80
0 20 40 60 80 100 0 20 40 60 80 100
rater 4 rater 3 rater 2
rater 1 rater 5
rater 6
rater 7
rater 8
0 20 40 60 80 100 0 20 40 60 80 100 0 20 40 60 80 100 0 20 40 60 80 100
0 20 40 60 80 100 0 20 40 60 80 100
rater 4 rater 3 rater 2
rater 1 rater 5
rater 6
rater 7
rater 8
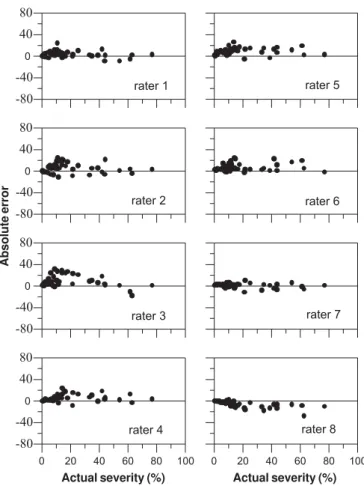
Absolute error
Actual severity (%) Actual severity (%)
Estimated severity (%)
Actual severity (%) Actual severity (%)
FIG. 3 - Absolute errors (actual severity – estimated severity) for assessments of soybean (Glycine max)rust without the aid of the diagrammatic scale. Raters 1 to 4 are inexperienced, without previous contact with the scale; raters 5 to 8 are experienced and have used the scale previously.
FIG. 4 - Estimated severity (•) of soybean (Glycine max) rust with the aid of the diagrammatic scale and linear regressions obtained between actual and estimated severity (solid line). Dotted lines represent an ideal situation, with estimated severity equal to actual severity. Raters 1 to 4 are inexperienced, without previous contact with the scale; raters 5 to 8 are experienced and have used the scale previously.
inexperienced raters ranged from 0.59 to 0.88 without the scale and from 0.67 to 0.90 with the scale, whereas for experienced raters they ranged from 0.75 to 0.93 without the scale and from 0.89 to 0.95 with the scale. Without use of the scale the absolute errors of inexperienced raters were concentrated in the range from 20 to 50%, and for experienced raters in the range from 10 to 20% (Figure 3). When the scale was used, the differences between absolute errors of inexperienced raters were concentrated in the 25% range, and for experienced raters in the 15% range (Figure 5).
For experienced raters, who had had previous contact with the scale, improvements were not so significant as for inexperienced raters, confirming observations of James (1971) with regard to the importance of using diagrammatic scales to “calibrate” the rater’s visual system. Studies have demonstrated that there is great variation in the ability people have to assess the severity of diseases with precision; the quality of the disease estimate is influenced by psychological stimuli and responses and by factors such as complexity of the sampling unit, size and shape of lesions, color and number of lesions, fatigue, and difficulty to concentrate on the task (Kranz, 1988; Sherwood et al., 1983).
Rater training can have a positive influence on the quality of assessments, as observed by Michereff et al. (2000)
in the validation of a scale for yam (Dioscorea cayennensis
Lam.) leaf blight. Computer software can be used to train raters (Tomerlin & Howell, 1988; Nutter Jr. & Schultz, 1995; Canteri & Giglioti, 1998) in order to improve assessments. The presence of some level of absolute error in the measurements can be compensated by the quickness and standardization resulting from the use of diagrammatic scales (Stonehouse, 1994).
The scales developed in this study are similar to the scales developed for quantification of late diseases (Martins
et al., 2004) and powdery mildew (Mattiazzi, 2003) in
accuracy and precision of inexperienced raters and proved suitable when utilized by raters that are used to working with the scale, providing severity estimates near the actual values. The use of the scale proposed in this work, together with the scales developed by Martins et al. (2004) and
Mattiazzi (2003) has been suggested in the assessment of fungicide assays for the control of soybean diseases (Reunião, 2003) and in the construction of disease progress curves (Godoy et al., 2003 ).
Absolute error
Actual severity (%) Actual severity (%)
LITERATURE CITED
AMORIM, L., BERGAMIN FILHO, A., PALAZZO, D., BASSANEZI, R.B., GODOY, C.V. & TORRES, G.A.M. Clorose variegada dos citros: uma escala diagramática para avaliação da severidade da doença. Fitopatologia Brasileira 18:174-180. 1993. BERGAMIN FILHO, A. & AMORIM, L. Doenças de plantas tropicais: epidemiologia e controle econômico. São Paulo: Editora Agronômica Ceres Ltda. 1996.
BERGER, R.D. Measuring disease intensity. In: Teng, P.S. & Krupa S.V. (Eds.) Crop Loss Assessment which Constrain Production and Crop Improvement in Agriculture and Forestry. FIG. 5 - Absolute errors (actual severity – estimated severity) of soybean (Glycine max)rust for assessments with the aid of the diagrammatic scale. Raters 1 to 4 are inexperienced, without previous contact with the scale; raters 5 to 8 are experienced and have used the scale previously.
St.Paul. University of Minnesota. 1980. pp.28-31.
BROMFIELD, K.R. Soybean rust. Monograph n. 11. St Paul, Minnesota. The American Phytopathological Society. 1984 CANTERI, M.G. & GIGLIOTI, E.A. Combro: software for selection and training people to estimate severity of sugarcane rust and borer rot complex. Summa Phytopathologica 24:190-192. 1998.
GAUNT, R.E. The relationship between plant disease severity and yield. Annual Review of Phytopathology 33:119-145. 1995. GIGLIOTI, E.A & CANTERI, M.G. Desenvolvimento de software e escala diagramática para seleção e treinamento de avaliadores do complexo broca-podridões em cana-de-açúcar. Fitopatologia Brasileira 23: 359-363. 1998.
GODOY, C.V., CARNEIRO, S.M.T.P.G., IAMAUTI, M.T., DALLA PRIA, M., AMORIM, L., BERGER, R.D. & BERGAMIN FILHO, A. Diagrammatic scales for bean disease: development and validation. Zeitschrift für Pflanzenkrankheiten und Pfanzenschutz 104:336-345. 1997.
GODOY, C.V., COSTAMILAN, L.M., CANTERI, M.G., ALMEIDA, A.M.R. & PIUGA, F.F. Análise temporal do progresso da ferrugem da soja em Londrina (PR). Fitopatologia Brasileira
28:S386. 2003. (Resumo)
HORSFALL, J.G. & BARRATT, R.W. An improved grading system for measuring plant disease. Phytopathology 35:655. 1945 (Abstract).
JAMES, W.C. An illustrated series of assessment keys for plant diseases. Their preparation and usage. Canadian Plant Disease Survey 5:39-65. 1971.
JAMES. W.C. Assessment of plant disease and losses. Annual Review of Phytopathology 12:27-48. 1974.
KRANZ, J. Measuring plant disease. In: Kranz, J. & Rotem, J. (Eds.) Experimental Techniques in Plant Disease Epidemiology. New York. Springer Verlag. 1988. pp.35-50.
LEITE, M.V.B.C.L. & AMORIM, L. Elaboração e validação de escala diagramática para mancha de Alternaria em girassol. Summa Phytopathologica 28:14-19. 2002.
MARTINS, M.C., GUERZONI, R.A., CÂMARA, G.M.S., MATTIAZZI, P., LOURENÇO, S.A. & AMORIM, L. Escala diagramática para a quantificação do complexo de doenças foliares de final de ciclo em soja. Fitopatologia Brasileira 29:179-184. 2004.
MATTIAZZI, P. Efeito do oídio (Microsphaera diffusa Cooke & Peck) na produção e duração da área foliar sadia da soja. (Dissertação de mestrado). Piracicaba. Escola Superior de Agricultura Luiz de Queiroz. 2003.
MICHEREFF, S.J., MAFFIA, L.A. & NORONHA, M.A. Escala diagramática para avaliação da severidade da queima das folhas de inhame. Fitopatologia Brasileira 25: 612-619. 2000.
NUTTER JR., F.W. & SCHULTZ, P.M. Improving the accuracy and precision of disease assessments: selection of methods and use of computer-aided training programs. Canadian Journal of Plant Pathology 17:174-184. 1995.
NUTTER JR., F.W., TENG, P.S. & SHOKES, F.M. Disease assessment terms and concepts. Plant Disease 75:1187-1188. 1991. PARKER, S.R., SHAW, M.W. & ROYLE, D.J. The reliability of visual estimates of disease severity on cereal leaves. Plant Pathology 44:856-864. 1995.
-80 -40
0
40 80 -80 -40
0
40 80 -80 -40
0
40 80 -80 -40
0
40 80
0 20 40 60 80 100 0 20 40 60 80 100
rater 4 rater 3 rater 2
rater 1 rater 5
rater 6
rater 7
REUNIÃO DE PESQUISA DE SOJA DA REGIÃO CENTRAL DO BRASIL, 25. Uberaba. Ata. Londrina: Embrapa Soja: EPAMIG: Fundação Triângulo, Embrapa Soja. Documentos, 222. 2003.
SHERWOOD, R.T., BERG, C.C., HOOVER, M.R. & ZEIDERS, K.E. Illusions in visual assessment of stagonospora leaf spot of orchardgrass. Phytopathology 73:173-177. 1983.
SINCLAIR, J.B. & HARTMAN, G.L. Soybean diseases. In: Hartman, G.L., Sinclair, J.B. & Rupe, J.C. (Eds.) Compendium of soybean diseases. 4 ed. St. Paul. American Phytopathological Society. 1999. pp.3-4.
STONEHOUSE, J. Assessment of andean bean diseases using visual keys. Plant Pathology 43:519-527. 1994.
TECNOLOGIAS DE PRODUÇÃO DE SOJA – REGIÃO
CENTRAL DO BRASIL, 2003. Londrina: Embrapa Soja; Embrapa Cerrados; Embrapa Agropecuária Oeste; ESALQ, Embrapa Soja/ Sistemas de Produção 1. 2002.
TOMERLIN, J.R. & HOWELL, A. Distrain: a computer program for training people to estimate disease severity on cereal leaves. Plant Disease 72:455-459. 1988.
YANG, X.B., TSCHANZ, AT., DOWLER, W.M. & WANG, T.C. Development of yield loss models in relation to reductions of components of soybeans infected with Phakopsora pachyrhizi. Phytopathology 81:1420-1426. 1991.
YORINORI, J.T., PAIVA, W.M., FREDERICK, R.D.& FERNANDEZ, P.F.T. Ferrugem da soja (Phakopsora pachyrhizi) no Brasil e no Paraguai, nas safras 2000/01 e 2001/02. Resumos, II Congresso Brasileiro de Soja, Foz do Iguaçu, PR., 2002. p.94.