Models and Applications for Risk Assessment and Prediction
of Asian Soybean Rust Epidemics
Emerson M. Del Ponte1, Cláudia V. Godoy2, Marcelo G. Canteri3, Erlei M. Reis4 & X.B. Yang5
1Departamento de Fitossanidade, Faculdade de Agronomia, Universidade Federal do Rio Grande do Sul, Cx. Postal 15100,
&(33RUWR$OHJUH56%UD]LOHPDLOHPHUVRQGHOSRQWH#XIUJVEU2Embrapa Soja, CEP 86001-970,
/RQGULQD35%UD]LOHPDLOJRGR\#FQSVRHPEUDSDEU3Departamento de Agronomia, Universidade Estadual de
/RQGULQD&(3/RQGULQD35%UD]LOHPDLOFDQWHUL#XHOEU4Universidade de Passo Fundo,
&(33DVVR)XQGR56%UD]LOHPDLOHUOHLUHLV#WSRFRPEU5Department of Plant Pathology,
,RZD6WDWH8QLYHUVLW\$PHV,RZD86$HPDLO[E\DQJ#LDVWDWHHGX
(Accepted for publication 18/12/2006)
Author for correspondence: Emerson Medeiros Del Ponte
DEL PONTE, E.M., GODOY, C.V., CANTERI, M.G., REIS, E.M. & YANG, X.B. Models and applications for risk assessment and prediction of Asian soybean rust epidemics. Fitopatologia Brasileira 31:533-544. 2006.
ABSTRACT
Asian rust of soybean [*O\FLQH PD[ (L.) Merril] is one of the most important fungal diseases of this crop worldwide. The recent introduction of 3KDNRSVRUDSDFK\UKL]L Syd. & P. Syd in the Americas represents a major threat WRVR\EHDQSURGXFWLRQLQWKHPDLQJURZLQJUHJLRQVDQGVLJQL¿FDQWORVVHVKDYHDOUHDG\EHHQUHSRUWHG3SDFK\UKL]L is extremely aggressive under favorable weather conditions, causing rapid plant defoliation. Epidemiological studies, under both controlled and natural environmental conditions, have been done for several decades with the aim of elucidating factors that affect the disease cycle as a basis for disease modeling. The recent spread of Asian soybean rust to major production regions in the world has promoted new development, testing and application of mathematical models to assess the risk and predict the disease. These efforts have included the integration of new data, epidemiological knowledge, statistical methods, and advances in computer simulation to develop models and systems with different spatial and temporal scales, objectives and audience. In this review, we present a comprehensive discussion on the models and systems that have been tested to predict and assess the risk of Asian soybean rust. Limitations, uncertainties and challenges for modelers are also discussed.
Additional keywords: 3KDNRSVRUDSDFK\UKL]L, disease forecasting, disease simulation models, fungal aerobiology.
RESUMO
Modelos e aplicações de avaliação e previsão de risco de epidemias da ferrugem asiática da soja
A ferrugem Asiática da soja [*O\FLQHPD[ (L.) Merril] é atualmente uma das mais importantes doenças foliares dessa cultura no mundo. A recente introdução de seu agente causal, o fungo 3KDNRSVRUDSDFK\UKL]L Syd. & P. Syd, nas Américas UHSUHVHQWDXPDJUDQGHDPHDoDjVRMLFXOWXUDQDVSULQFLSDLVUHJL}HVSURGXWRUDVGRPXQGRRQGHSHUGDVVLJQL¿FDWLYDVIRUDP relatadas. A ferrugem Asiática da soja é uma doença extremamente agressiva sob condições ambientais favoráveis, causando rápida desfolha nas plantas e danos à produção de grãos. O conhecimento epidemiológico sob condições controladas e naturais, os quais visam elucidar os fatores que afetam os processos do ciclo da doença tem sido fundamental para dar base a estudos de modelagem da epidemia. Devido à importância e recente expansão da doença para as principais áreas de produção de soja no mundo, uma nova atenção tem sido dada ao desenvolvimento, avaliação e aplicação de modelos para avaliação de risco e previsão de suas epidemias, valendo-se de avanços recentes no conhecimento epidemiológico, métodos estatísticos e simulação por computador. O conhecimento gerado tem permitido a construção de novos modelos para a previsão e avaliação de risco de doenças, os quais se diferenciam em relação aos parâmetros estimados, escala espacial ou temporal, objetivo e público alvo. Nesta revisão, é apresentada uma discussão detalhada de modelos e sistemas de previsão e avaliação GHULVFRGDIHUUXJHPGDVRMDHQFRQWUDGRVQDOLWHUDWXUDEHPFRPRRVGHVD¿RVOLPLWDo}HVHLQFHUWH]DVQDVSUHYLV}HV
Palavras-chave adicionais: 3KDNRSVRUD SDFK\UKL]L, previsão de doenças de plantas, modelos de simulação de epidemias, aerobiologia de fungos.
Distribution and epidemiological aspects
Asian soybean rust (ASR) [*O\FLQHPD[ (L.) Merril] is a fungal disease (3KDNRSVRUDSDFK\UKL]L Syd. & P. Syd) RIJUHDWHFRQRPLFFRQFHUQWRVR\EHDQ7KH¿UVWUHSRUWGDWHV from 1902, in Japan, and during the last century the disease
disease was reported in Hawaii in 1994 (Killgore & Heu, 1994). From Africa, the fungus was thought to have spread into South America, affecting late-season soybean plants in Paraguay and Brazil in 2001 (Yorinori HWDO, 2002), and in northern Argentina in 2002 (Rossi, 2003). In November 2004 Asian soybean rust was found in the continental United States, the last major soybean production area where it had not been previously reported (Schneider HWDO, 2005).
Comprehensive epidemiological studies on Asian soybean rust were initiated in the 70s in containment IDFLOLWLHVLQWKH8QLWHG6WDWHV%URP¿HOGEXWWKHUH have also been studies from Asian countries that examined changes in local epidemics, as well as controlled environment studies (Tan, 1996). Most of these studies aimed to examine environmental and biological factors affecting individual disease cycle components and mechanisms that lead to yield losses (Kitani & Inouse, 1960, Marchetti HWDO, 1976, Melching HWDO, 1979, Tschanz, 1984). In brief, long dew periods and temperatures ranging from 15°C to 29°C appear to be optimal for soybean rust development (Marchetti HWDO, 1976, Melching HWDO, 1989). Rapid disease establishment DQG GHYHORSPHQW LQ WKH ¿HOG ZLWK GHYDVWDWLQJ HIIHFWV on yield, has been associated with high rainfall during the growing season (Tschanz, 1984, Tan, 1996). With the recent expansion of Asian soybean rust in the last 10 years, further epidemiological studies on single disease cycle components have been done in countries where it has recently been found. For example, controlled-environmental studies in Brazil have shown that the optimal temperature for fungal germination ranged between 15 and 25 oC, with a minimum wetness period of 6 hours required for infection, and LQFUHDVLQJLQIHFWLRQHI¿FLHQF\ZLWKWRKRXUVRIZHWQHVV duration (Alves HWDO, 2006a). Moreover, the latent period was a function of temperature, with the shortest period occurring below 23 oC (Alves HW DO, 2006b). In South Africa, studies showed that no rust development occurred for temperatures equal to or less than 15 oC and equal to or greater than 30 oC after infection, and for temperatures that were within this range, lesion size was increased when air relative humidity was 95%, compared to 85% (Caldwell, 2005). Studies for the relationship between urediniospore viability and exposure to solar radiation, LQYHVWLJDWHG XQGHU ¿HOG FRQGLWLRQV LQ 3DUDJXD\ VKRZHG WKDW the proportion of 3SDFK\UKL]Lurediniospores that germinated decreased with increasing exposure to solar radiation, with no JHUPLQDWLRQ XQGHU GDLO\ VRODU UDGLDWLRQ GRVHV 0-P2 (Isard HWDO, 2006).
ASR Model types and applications
Plant disease forecasting models, usually referred to as prediction or disease risk models, have been developed based on the epidemiological knowledge obtained from controlled HQYLURQPHQWRU¿HOGVWXGLHV<DQJRXWOLQHGWKHXVHRI the terms “risk prediction” and “risk assessment”, according to the temporal and spatial scale that uses the risk. “Risk SUHGLFWLRQ´UHÀHFWVDGYDQFHVLQGLVHDVHULVNFRPPXQLFDWLRQ at the farm level for a single season. “Risk assessment”
is an epidemiological study to predict future occurrence of a disease by using non-experimental approaches, often through computer modeling. The study in risk assessment is a macroscale, long-term prediction that encompasses assessment of potential for entry, establishment, epidemic, and/or crop losses in a region or country once an epidemic occurs (Yang, 2006). Several mathematical and computer models have been developed for predicting Asian soybean rust epidemics (Yang HWDO, 1991a, Batchelor HWDO, 1997, IsardHWDO, 2005, Del Ponte HWDO, 2006, Kim HWDO, 2006, Pivonia & Yang, 2006) with applicability in risk assessment studies and prediction frameworks. Recently, plant pathologists, in collaboration with climatologists, have paid new attention to the development, testing and application of models to assess the risk and predict ASR. This has been through using both new and re-analyzed data, as well as new methods and technological resources for modeling development and information delivery. Currently, methods and applications for risk estimation vary among different research groups. Differences encompass model type and how climatic, meteorological, phenological, geographical and other relevant data are stored, processed, and delivered to end-users.
$65PRGHOVFDQEHFODVVL¿HGLQWZRPDMRUJURXSV simulation and empirical models. Simulation (process driven) models are based on concepts derived from a pathosystem and help to improve the understanding of the structure and behavior of such a biological system (Teng, 1985). Empirical models are typically constructed through the statistical relationship(s) of explanatory variables ZLWK H[SHULPHQWDO GDWD 7KLV GDWD PD\ EH IURP WKH ¿HOG on individual (e.g. survival, dispersal, infection, latency, sporulation) or combined epidemic components (e.g. disease SURJUHVV¿QDOVHYHULW\0RVWPRGHOVXVHWKHUHVSRQVHRI foliar pathogens to the combined effects of temperature and duration of leaf wetness (Duthie, 1997). These models have commonly been used in disease forecasting systems, with the reliability of model predictions heavily dependent on the quality of the dataset used for model development (Krause
HW DO, 1975). Table 1 summarizes information on twelve ASR models found in the literature and that are discussed in this review.
Simulation models
TABLE 1 - Mathematical models and their characteristics used for risk assessment and risk prediction of Asian soybean rust epidemics that have been published in the literature
1. S = Simulation, E = Empirical
2. RA = Risk assessment, RP = Risk prediction 3. Soybean Rust Aerobiology Prediction System
4 NOAA ARL HYSPLIT_4 (+\EULG6LQJOH3DUWLFOH/DJUDQJLDQ,QWHJUDWHG7UDMHFWRU\)
5. North American Plant Disease Forecast Center
6. CLIMEX computer model (Southerst & Maywald, 1985). 7. Fuzzy Logic Apparent Infection Rate
(models 4-6, Table 1) and, in some cases, the subsequent host infection and colonization after entry (model 7, Table 1).
Epidemiological models
7KH ¿UVW $65 VLPXODWLRQ PRGHO 62<5867 (Yang HW DO, 1991a) was developed and validated with GDWD IURP OLWHUDWXUH DQG VHTXHQWLDOO\SODQWHG ¿HOG experiments conducted at the Asian Vegetable Research and Development Center (AVRDC) in southern Taiwan in the early 80s. SOYRUST is a process-driven computer model that simulates daily increase of disease severity in two soybean varieties (Yang HWDO, 1991a). Rate variables estimate leaf area development and disease components, including infection, latent period and uredinia senescence. :KLOHLQIHFWLRQUDWHLVLQÀXHQFHGE\OHDIZHWQHVVGXUDWLRQ
and temperature, latent period and uredinia senescence are D IXQFWLRQ RI WHPSHUDWXUH %DVLFDOO\ WKH PRGHO UHÀHFWV the environmental effect on the epidemic cycle to predict epidemic development in daily steps. Local model validation was performed using three soybean growing seasons within a single year and showed that the model was accurate in VLPXODWLQJWKHGLVHDVHZLWKWKHSULPDU\PRGHOÀXFWXDWLRQV due to differences in seasonal temperature. Prediction accuracy was reduced if growing season temperatures were either warmer or colder than regular growing season.
SOYRUST was further linked to a soybean model, SOYGRO, in order to simulate disease effects in the soybean yield and assess potential crop losses in some locations in the United States (Yang HW DO, 1991b). The link between these two models is through the estimated disease severity
1 mechanistic, process-driven S – RP, RA Epidemic and loss
potential
Disease severity progress (%)
SOYRUST ,
Yang ,
(1991a,b)
2 Analyt ic, process -driven S - RA Establishment
potential
Daily number of infectious units
Pivonia & Yang (2006)
3 CLIMEX6 S - RA Survival potential Disease stress -free
index (0-1)
Pivonia & Yang (2004)
4 HYSPLIT4 S – RA, RP Entry potential Spore dispersal and
concentration
Pan (2005)
5 HYSPLIT S - RA Entry potential Spore availability index
(0-7)
Kim (2005)
6 HYSPLIT S - RP Entry and
establishment potential
spore dispersal, qualitative disease risks
NAPDFC5
(2006)
7 Aerobiological process
-driven
S – RA, RP Entry,
establishment and epidemic potential
Spore dispersal and disease development
SRAPS3
Isard (2005)
8 Non -linear regression E – RP Infection potential Daily values of
probability for infection (0-4)
Climatic model
-Reis (2004)
9 Non -linear regression E - RP Infection potential Daily infection
efficiency (0-100)
Canteri (2004)
10 Neural networks E - RP Epidemic
potential
Daily disease severity (%)
Batchelor (1997)
11 Fuzzy logic + non linear
regression
E – RA,RP Epidemic
potential
Apparent infection rate and disease severity progress (%)
FLAIR7
Kim (2005)
12 Linear regression E – RA, RP Epidemic
potential
Final or maximum disease severity (%)
in SOYRUST, which is used to update the “Leaf Area” variable estimated by SOYGRO. From the estimated disease severity, a measure of the corrected leaf area variable is obtained. This variable directly affects plant photosynthesis and, consequently, the yield. At the end of the simulation, WKHPRGHOJHQHUDWHVGLVHDVHSURJUHVVFXUYHVDQG¿QDO\LHOG in the presence or absence of ASR.
More recently, Pivonia & Yang (2006) adjusted a general disease model to predict onset time for four other rust diseases than ASR (two from corn and two from wheat) by examining the temperature effect at the initial stages of an epidemic, in order to assess establishment potential by the estimation of daily increase of infection units (model 2, Table 1) in susceptible hosts during the exponential phase of an epidemic. The general disease model components DUH LQIHFWLRQ HI¿FLHQF\ ODWHQW SHULRG LQIHFWLRXV SHULRG number of spores produced per lesion and proportion of spores landing on a potential infection site (Gumpert HW
DO,Q3LYRQLDDQG<DQJ¶VPRGHOWKHLQLWLDOLQÀX[ values of spores from an external inoculum source were based on literature data for other rusts. This model was used for risk assessment through the calculation of the number RILQIHFWLRQVDQGUDWHRIGLVHDVHLQFUHDVHDPRQJVWWKH¿YH UXVWSDWKRJHQV8VLQJFOLPDWRORJ\GDWDIRUVSHFL¿FORFDWLRQV within the United States (for southern to northern locations), they observed that a longer period of time would be required for ASR to increase from trace to visual detection levels in WKH¿HOG7KHDXWKRUVVSHFXODWHGWKDWLQWKHVRXWKHUQ8QLWHG States, the low temperatures in May and June would limit disease development, causing a delay in disease incipience in northern locations. The model assumes non-limiting moisture conditions for rust infections.
Since 3 SDFK\UKL]L is an obligate parasite, overwintering survival of the pathogen is critical for development of year-to-year epidemics. CLIMEX is a computer model used to assess climatic suitability for biological processes (Southerst & Maywald, 1985). The third model presented was developed by Pivonia & Yang (2004), who adjusted the biological parameters in CLIMEX to integrate information on the response of 3 SDFK\UKL]L to environmental conditions in order to determine stress-free zones for year-round survival of 3SDFK\UKL]Laround the world. Parameters for the estimation of cold, warm or PRLVWXUH VWUHVVHV ZHUH GH¿QHG EDVHG RQ OLWHUDWXUH GDWD 7KUHVKROGYDOXHVIRUFROGDQGZDUPVWUHVVHVZHUHGH¿QHGDV 11 and 34 ºC, respectively. Stress indices take into account the continuous occurrence of those values around the stress level. For example, 100% of cold stress would accumulate after 9 to 10 weeks with mean minimum temperature of 7 oC level, and 100% of warm stress would be calculated after 9 to 10 sequential weeks of constant temperature approximately 40oC. Moisture stress would not occur if weekly precipitation was as low as 10 mm. If precipitation was lower than 10 mm, a procedure was created to take relative humidity into DFFRXQW:KHQUHODWLYHKXPLGLW\ZDVIRUKRXUVRU PRUHLQDVLQJOHGD\PRLVWXUHVWUHVVGLGQRWRFFXU$¿QDO
equation in CLIMEX calculates a stress-free index (0 to 1) for a single location, taking into account the three stress indices. Values close to 1 suggest higher chance for year-round spore survival, which means no stress conditions developed in most of years. The results allowed determining worldwide regions where year-round inoculum survival would be most likely and others where ASR epidemics would depend on primary inoculum originating from long distances (overwintering sources).
Aerobiological models
Aerobiology is the study of biological processes involved in the movement of microorganisms in the atmosphere from one geographical location to another (Gregory, 1973). Given that spores of 3 SDFK\UKL]L are capable of long-distance travel via air currents, aerobiological models have been proposed for risk assessment and seasonal ASR prediction (Isard HWDO, 2005, Pan HWDO, 2006).
7KH ¿UVW $65 DHURELRORJLFDO PRGHO WR GHVFULEH LV a climate-dispersion integrated model system developed for simulating long-distance and long-term transportation of 3SDFK\UKL]Lusing climate forecast over one month in advance (Pan HWDO, 2006). The application is based on the atmospheric transport model NOAA ARL HYSPLIT_4 (HYSPLIT - +\EULG6LQJOH3DUWLFOH/DJUDQJLDQ,QWHJUDWHG
Early July (1997-2003)
CAI 0-1 1-2 2-3 3-4 4-5 5-6 6-7
Late July (1997-2003)
0-1 1-2 2-3 3-4 4-5 5-6 6-7 A
B
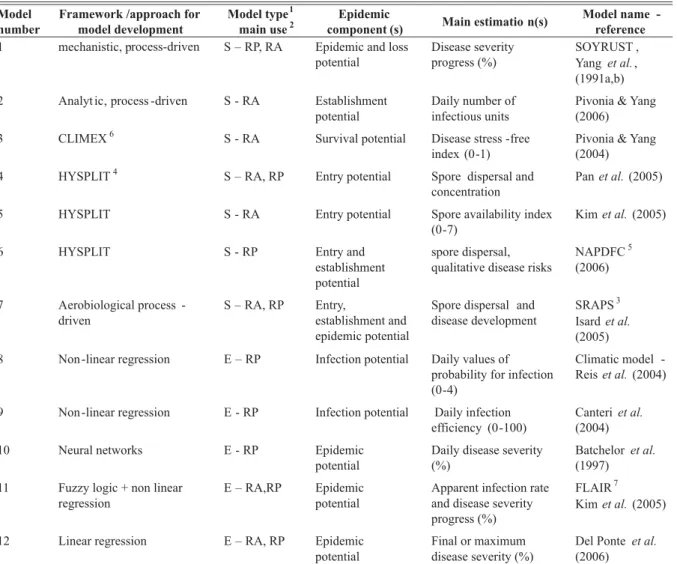
FIG. 1 - Computer simulation of historical weather data (1997-2003) for potential deposition areas for 3KDNRSVRUDSDFK\UKL]L during two 15-day period in the month of July (A and B) produced from southeastern Alabama if a large amount of spores is produced there. Grayscale code is the relative frequency of spore travels expressed as CAI (combined availability index), a qualitative index (0-7) for possibility of spore deposition. White square indicates area of spore’s source. Adapted from Yang HWDO., (2005).
to predict the likeliest within-season movement of spores IURPFRQ¿UPHGORFDWLRQVRI$VLDQVR\EHDQUXVWLQIHFWLRQV in the southern states. In this application, the model was run on a weekly basis with forecasted weather data to predict likely movement and concentration of spores into northern regions of the country, as part of a framework to predict the seasonal risk of soybean rust in that year (Pan HWDO, 2005, 2006). The quasi-operational prediction in the 2005 growing season further indicated that the model could capture the general pattern of disease spread in the southeastern states. The month-long prediction of spore movement was based on the emerging seasonal forecast techniques that predict mean conditions (or climate), rather than day-to-day weather (Pan
HWDO, 2006)
0RGL¿FDWLRQV WR WKH $65 +<63/,7EDVHG PRGHO used by Pan HW DO(2006) were made using a statistical approach which analyzed 7 years of climate data in order to assess the potential spread of viable spores arising in a FHUWDLQ¿[HGQXPEHURIORFDWLRQVDQGSHULRGVRIWLPHZLWKLQ the United States, as part of a risk assessment framework (KimHWDO, 2005). The authors adjusted components in the basic aerobiological model to simulate survival of spores during transport and the potential entry of viable spores in a region (model 4, Table 1). This model ran using hourly meteorological data from the years 1997 to 2003 in order to calculate a combined availability index (CAI). The higher the index for a region, the greater the climatic potential for spore availability. An index of 7 indicates deposition of viable spores during all years in the simulation (Figure 1). The authors suggested that there is the potential for soybean UXVW VSRUH GLVSHUVDO RYHU ORQJ GLVWDQFHV LQ VRPH \HDUV however, the frequency and spatial distribution of spores was quite variable across years.
A third application was made using the HYSPLIT model to predict ASR risks in the United States during the 2005 growing season (NAPDFC, 2005). In this, each prediction included a description of the factors pertinent to the disease status, a general outlook that assessed the risk of disease development, and a map showing the spore-laden ZLQGÀRZLQJDZD\IURPDQDFWLYHVRXUFHRUVRXUFHUHJLRQ (i.e., a cluster of closely-grouped counties) using multiple, centrally-located trajectories. To estimate the risk of ASR, researchers combined biological and meteorological elements into a qualitative evaluation of the risk of disease development associated with one or a group of sources. The IRUHFDVWLQJ SURFHGXUH WKDW GH¿QHV GLVHDVH ³WKUHDWV´ DQG “risks” follows the model proposed to forecast tobacco blue mold, in which the meaning is described elsewhere (Main HW
DO, 2001). The model allowed then the prediction of entry and establishment potential by estimating qualitative risks (model 6, Table 1).
The last ASR aerobiological model to describe is called SRAPS (SR\EHDQ 5XVW $HURELRORJ\ 3UHGLFWLRQ
6\VWHP) and is an advance on the other models of this kind since it aims to simulate the transportation process of airborne inoculum and the further disease establishment and
Disease Incidence (%)
60
50
40
30
20
10
0
0 10 20 30 40 50 60 70 80 90
y= 1.1617x - 33.165
R2 = 0.97
CDVPI
FIG. 2 - Relationship between Asian soybean rust incidence on
OHDÀHWV DQG FXPXODWLYH GDLO\ YDOXHV SUREDELOLW\ IRU LQIHFWLRQ
(CDVPI) for the location of Pereiras, São Paulo State, Brazil. Disease onset occurred when CDVPI accumulated 30 units. Source: ReisHWDO(data not published).
details and model application are described elsewhere (IsardHWDO, 2004, 2005). In the 2005 growing season, the system was run through the Internet (USDA APHIS, 2005). A nationwide network of sentinel plots was established and intensively monitored to inform the geographic distribution of the early season pathogen in southern soybean regions in the United States. Each day, SRAPS-generated maps showing deposition of spores, phenological development of soybean and kudzu, and disease progression estimated on these hosts were available to extension specialists as a basis for commentaries and regional recommendations (Isard HW
DO2005).
Empirical models
Six empirical models are described here, and they were separated into three kinds according to epidemic component estimated: suitability or critical periods for infection, disease progress, or maximum disease severity levels (models 8 to 13, Table 1). Such empirical models were obtained using modeling techniques such as linear and non-linear regression, neural networks and fuzzy logic.
Suitability or critical periods for infection
The two empirical models that predict the suitability or critical periods of infection for ASR were developed and applied in Brazil. They basically follow the principles of several models that were developed for other foliar diseases (Krause HW DO, 1975, Lalancete HW DO, 1988, Evans HW DO, 1992).
Reis HW DO(2004) proposed a climatic model to predict a daily value for the probability of infection by 3
SDFK\UKL]L based on literature data regarding the interaction of leaf wetness duration-mean temperature during period of wetness and infection (Melching HW DO, 1989). Reis HW
DO(2004) reanalyzed the original data in order to obtain a surface response model that estimates the intensity of lesions (lesions.cm-1). The authors developed a “table of critical periods” for daily values for probability of infection (DVPI), which are a function of the number of lesions predicted to develop in a single day according to leaf wetness duration and temperature. In its application, the climatic model was input into a computerized weather station equipped with electronic sensors that measured temperature and leaf wetness every 15 minutes (Aura One. Quanta Agro, Passo Fundo - RS). The device is then placed within or near D¿HOGIURPZKLFK'93,DUHFDOFXODWHGDQGDQDOHUWZLOO then be shown on the display whenever cumulative DVPI &'93,UHDFKHVDGH¿QHGWKUHVKROG7KHV\VWHPKDVEHHQ validated across soybean regions in Brazil to determine the correlations between CDVPI and the disease’s onset and incidence progress - proportion of leaves infected over time. In the validation experiments, a trap plot (10 x 10 m) ZDVVRZQGD\VSULRUWRWKHSURGXFWLRQ¿HOGLQRUGHUWR detect the presence of local inoculum. Recordings of leaf wetness and mean temperature during the wet period were LQLWLDWHG E\ WKH WLPH ¿UVW OHDYHV HPHUJH DQG WKH WUDS SORW
was monitored twice a week. Preliminary results indicated that there was a high probability for disease occurrence when CVDPI values reached values from 30 to 45 across the locations. At Pereiras municipality, São Paulo State, disease onset occurred when CDVPI reached 30 units (Figure 2). For Primavera do Leste, Mato Grosso State and Londrina, Paraná State, disease onset was observed when CVDPI reached 32 and 45, respectively (data not shown). Efforts DUHXQGHUZD\WRGH¿QHWKUHVKROGYDOXHVIRUVSHFL¿FUHJLRQV in order to time fungicide sprayings according to weather suitability for Asian soybean rust.
Soybean Rust (Phakopsora pachyrhizi) 2/2/2005 to 2/28/2005 (%)
100 75 50 25 0
FIG. 3 - Risk map for Asian soybean rust in Paraná State, Brazil, generated by using a prediction model that uses temperature and leaf wetness duration to predict climatic favorability for infection. The map above summarizes the frequency of favorable events for infection during the month of February 2005. Adapted from Fundação ABC (2005).
in recent studies in Brazil for the effect of temperature and leaf wetness duration on infection (Alves HWDO, 2006).
Disease development
Two other techniques have been applied to develop ASR models using the extensive disease data from Taiwan, apart from the SOYRUST simulation model. They are neural networks and fuzzy logic.
Batchelor HWDO(1997) developed a neural network model using the data from epidemics recorded in growing seasons in 1980 (model training) and then validated that model with data from 1981 growing seasons in that country in order to predict ASR severity in a single day (model 10, Table 1). Neural networks are sophisticated pattern recognition systems capable of learning relationships in patterns of information and, once trained, they can be used to classify new disease patterns according to the knowledge on the existing patterns (Ripley, 1996). For ASR, Batchelor
HWDOcreated 7 input variables: 1) planting date, 2) days to PDWXUDWLRQ ¿UVW GD\ WKH GLVHDVH ZDV REVHUYHG DJH of plants on the evaluation date, 5) cumulative days of relative humidity greater than 90%, 6) cumulative degree-days for rust development, and 7) cumulative degree-degree-days for crop development. Two models, using three- or four-input variables, respectively, had the best results with a FRHI¿FLHQW RI GHWHUPLQDWLRQ R2) of 0.85. The three-input variable model had the lowest mean prediction error and a KLJKHUFRHI¿FLHQWRIGHWHUPLQDWLRQ7KHSUHGLFWRUYDULDEOHV were: (i) day disease was observed, (ii) cumulative degree-day for rust development and (iii) cumulative degree-degree-day for soybean development. For the four-variable model, an additional variable, cumulative daily relative humidity over ZDVDGGHGWRWKHWKUHHYDULDEOHPRGHOKRZHYHUQR increase in prediction accuracy was observed. Using the
1981 Asian soybean rust data (model validation), 84% of the cases were within deviations (observed minus predicted) of r 20%, and 54% of the cases were within r 10% actual disease severity. The authors suggested the potential application of neural networks for predicting Asian soybean rust, given that their results were comparable to the SOYRUST model and that the variables used in the neural network model were based on degree-days, which have a biological meaning, –ie. severity levels are expressed as a function of host, pathogen, environment and time.
Kim HW DO(2005) developed a fuzzy logic-based model using the Taiwan data to estimate the apparent infection rate, an input variable found in the logistic population growth model (van der Plank, 1963). Their model, named FLAIR ()X]]\/RJLF$SSDUHQW,QIHFWLRQ5DWH), used a dataset for training some functions and decision rules within the context of fuzzy logic. Twelve decision rules were determined using the previous knowledge regarding the epidemiological knowledge of Asian soybean rust. $V DQ H[DPSOH WZR UXOHV ZHUH GH¿QHG LQ WKH IROORZLQJ manner: 1) “if mean night-time temperature is very low, then apparent infection rate is very low”, 2) “if maximum daily temperature is high, then the apparent infection rate is low”. A fuzzy logic model describes the variables and their states in natural language terminology, such as “very low” DQG³YHU\KLJK´7KURXJKDSURFHVVFDOOHG³IX]]\¿FDWLRQ´ a quantitative value is included in the system and converted LQWRWKHOLQJXLVWLFWHUP6SHFL¿FGHWDLOVDUHZHOOH[SODLQHG in Kim HWDO(2005). In the model validation, the authors assumed that initial infection occurred 14 days after planting and initial severity values were heuristically estimated for each case in the validation dataset. The authors found that in cases when mean seasonal temperature was higher than 25oC, or lower than 20 oC, Asian soybean rust epidemics deviated from a logistic pattern, resulting in failure of the model to correctly simulate disease severity during those periods. The rules created in this model did not use measurements of leaf wetness, but night-time temperature as a surrogate variable. This variable did not seem to affect the model performance, which was not much of a surprise given that moisture was not a limiting factor for epidemics in Taiwanese experiments (Yang HWDO, 1991, Batchelor HW
DO, 1997). The authors suggested that a population dynamics model using estimations of the apparent infection rate by the FLAIR model satisfactorily simulated disease progress as 85% of disease variation in the validation dataset was explained, and this approach showed potential for disease prediction, conditional on the availability of a model that accurately estimates initial disease severity levels (Kim HW
DO, 2005).
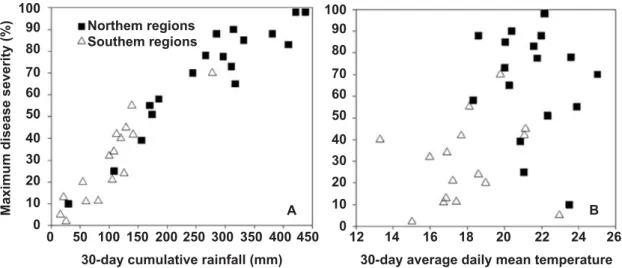
Maximum disease severity
Maximum disease severity (%)
100 90
80
70 60 50
40 30 20
10
0
100 90 80
70 60 50
40 30
20
10
0 Northem regions
Southem regions
30-day cumulative rainfall (mm) 30-day average daily mean temperature 0 50 100 150 200 250 300 350 400 450 12 14 16 18 20 22 24 26
FIG 4 – A.5HODWLRQVKLSEHWZHHQGD\DFFXPXODWHGUDLQIDOOB. and average daily mean temperature, following
VR\EHDQUXVWGHWHFWLRQDQGHVWLPDWHG¿QDORUPD[LPXPGLVHDVHVHYHULW\DWPDWXULW\VWDJHVRIVR\EHDQREVHUYHGLQ
natural epidemics in 21 locations from 2003 a 2005 in Brazil. Adapted from Del Ponte HWDO(2006).
A B
during epidemic development after ASR was detected. They examined data from 34 naturally occurring epidemics in experimental plots that were located at 21 sites from southern to northern soybean regions in Brazil over three growing seasons (2002/03 to 2004/05). The authors found that use of DUDLQIDOOYDULDEOHEHVWSUHGLFWHG¿QDO$65VHYHULW\ZKHUHDV temperature variables had poor predictive ability (Figure 4). The rainfall models explained 85 to 93% of the variation in PD[LPXPGLVHDVHVHYHULW\7ZRUDLQIDOOPRGHOVWKH¿UVWD second-order linear model using only accumulated rainfall for the 30-day period following disease detection, and the VHFRQG D ¿UVWRUGHU OLQHDU UHVSRQVH PRGHO WKDW XVHG WKH same variable and also the number of rainy days for the same period, had highest R2, as well as lowest prediction
HUURUV7KH¿UVWRUGHUOLQHDUPRGHOWHQGHGWRRYHUHVWLPDWH when actual disease severity was < 30%, while the second-order linear model had predictions with lower deviations from the actual disease severity. Low values for maximum disease severity were found for locations in southern regions of Brazil (latitude > 230), where relatively longer dry periods were recorded, and where minimum temperature was lower during the growing season, compared to northern locations. This work showed a capacity for predicting epidemic potential, where the epidemic prediction is based on a function of rainfall over a 30-day period following disease detection. The results observed by Del Ponte HWDO(2006) on WKHXVHRIUDLQIDOOWRSUHGLFWVR\EHDQUXVWHSLGHPLFVFRQ¿UPHG previous reports from China, where an empirical model based on the number of rainy days and accumulated rainfall for the month of September (using 7 years of epidemic data) was developed to predict a soybean rust index at one single location in Wuhan province (Tan HWDO, 1996).
The rainfall models developed by Del Ponte HW
DO(2006) have been applied in both risk assessment and prediction studies. For the former, the model was used to
GHWHUPLQHWKHVHDVRQDOHSLGHPLFSRWHQWLDOIRUWZHQW\VSHFL¿F locations in soybean regions in the United States. Fifty years of weather data were used to determine the frequency of moderate (>25% disease severity) and severe (>50% disease severity) epidemics across the locations, for two scenarios of disease detection time during the growing season (late June or late July). Results, using climate data for July and August, considered the most critical months, indicated a distinct climatic suitability for epidemic across different regions. Rainfall patterns in the main soybean regions (northern locations) seem not to be suitable for severe epidemics, such as those observed in central-western Brazil, although the disease can develop to light and moderate levels every year if inoculum is available early to mid-season, a condition that may not happen every year, because spores need to migrate from southern to northern locations (Del Ponte HW DO, <DQJDI¿UPHGWKDWVXFKLQIRUPDWLRQLVYHU\ LPSRUWDQWIRUSROLF\PDNHUVIRUH[DPSOHLIHSLGHPLFOHYHOV of concern have a frequency of one-in-eight or ten years, which was the case for some locations in the risk assessment study, then Asian soybean rust may not be considered a major production concern for the region.
FIG. 5 - Seasonal risk prediction framework for Asian soybean rust epidemics in the United States, 2005 year. A.Maps for spore
FRQFHQWUDWLRQLQWKHDLUSUHGLFWHGIRURYHUPRQWKSHULRGB. Maps for climatic suitability for soybean rust epidemics during a 30-day
SHULRGEDVHGRQDUDLQPRGHOC.Risk for disease establishment was estimated higher for regions where both higher climatic favorability and higher spore concentration was predicted (or an inoculum
VRXUFH ZDV UHSRUWHG LQ D UHJLRQ 6R\EHDQ UXVW ZDV FRQ¿QHG WR
southern United States by the end of 2005 season (source: PIPE - http://www.sbrusa.net).
Predictions for cumulative spore dispersal and concentration
May 7 to August 1st2005
Climatic suitability for soybean rust epidemics June 18 to July 17 2005
scale: log (#spores)/m3
<-5 -4 -3 -2 -1 A
B C
Soybean rust in the US. 2005
spore dispersal area by models
Data source: NOAA Climate Prediction Center
very low low moderate higt very higt
Risk information was made available to plant pathologists, specialists and risk interpretations to the public during the season (Del Ponte & Yang, 2005).
Uncertainties and challenges for the future
In spite of the great efforts to increase our understanding of the Asian soybean rust pathosystem, there DUHVWLOOQXPHURXVXQFHUWDLQWLHVDQGGLI¿FXOWLHVWKDWPXVWEH overcome in order to make the most accurate risk assessment and risk predictions. They relate mainly to inoculum DYDLODELOLW\FRQ¿GHQFHLQZHDWKHUDQGFOLPDWLFGDWDJDSV in epidemiological knowledge, and built-in limitations to a model and its validation. Although it seems plausible to extensively monitor early-season inoculum using trap plots DQGLQWHQVLYHGLVHDVHVFRXWLQJLWLVVWLOOH[WUHPHO\GLI¿FXOWWR dimension the actual number of inoculum sources across the regions in order to input these into aerobiological models. For example, within some locations several alternative hosts may harbor 3 SDFK\UKL]L spores, and many of the events associated with either local or long-distance spore dispersal (release, transport, survival and viability) are not satisfactorily understood. Further research is necessary to understand factors such as solar radiation, ultra-violet light, temperature and rain and how they may affect aerobiological processes. Recent studies on the mortality of 3 SDFK\UKL]L spore by the effect of solar radiation are very useful for improving predictions of spore movement based on aerobiological models (Isard HWDO7KHUHLVDOVRDGH¿QLWHQHHGIRUDQ improved understanding of the role of alternative hosts such as kudzu. Kudzu is a widely distributed weed across southern United States, and there is an inconsistency in the relative susceptibility of kudzu to 3SDFK\UKL]L, the reasons for which are still not fully understood. Also, increased understanding of environmental and landscape factors related to inoculum build-up and further local or long-distance disease spread in a region requires further investigation and seems to be one of the most critical pieces of information, especially for models that predict risk in regions where inoculum cannot survive or was not found. To overcome problems related to inoculum uncertainties, it remains crucial to monitor the inoculum by the use of spore samplers or trap plots. Besides the usefulness for alerting researchers to the presence of inoculum, the extensive data on inoculum monitoring will surely help to validate current models.
Regarding empirical infection-based models that take into account only the environmental effect on one component of an epidemic, a potential problem is that a high climatic favorability for infection may be estimated when inoculum is absent. However, further validation of such models will demonstrate the usefulness of the SUHGLFWLRQ V\VWHPV DW WKH ¿HOG OHYHO IRU UHJLRQV ZKHUH inoculum is not limiting. A true seasonal disease risk prediction should be based on weather and climate IRUHFDVWV KRZHYHU ZHDWKHUUHODWHG YDULDEOHV VXFK DV OHDI ZHWQHVV GXUDWLRQ DUH GLI¿FXOW WR HVWLPDWH IURP weather forecasts. Moreover, spatial variations and biased
disease onset from regional surveys. Interpretations of rainfall model predictions should be made from a higher spatial scale, representing an estimated risk for regional DYHUDJHFRQGLWLRQVDQGQRWIURP¿HOGOHYHODVVHVVPHQWV although the model can be used at the farm level once there is information on rainfall for the site.
When selecting and evaluating models to input into a risk prediction or assessment framework, one needs to know model details, how they were constructed, variables needed and on which scale and in which locations they should be applied to minimize prediction error. Fundamentally, empirical models developed with data from one region should be tested and validated for another region, before implementing broad use. However, a model constructed from a dataset collected over a large geographic region for a longer period of time would provide more reliable prediction, and so could be used in risk assessment of an exotic and new disease to an area. This assessment can be made for single or combined components, such as entry, establishment, epidemic and loss potential (Yang, 2006). Model validation may be, in turn, more critical for seasonal risk prediction at lower spatial and time scales when information will be used for the farmer’s decision.
According to Isard HW DO (2005), the use of aerobiological models to forecast aerial movement of an invasive species is in its infancy and will require the integration of biological knowledge, monitoring techniques and information technology. The efforts and advances in the development of a general aerobiological framework will be important to predict invasive species (including Asian soybean rust), enabling a rapid and comprehensive response to complex processes. Some of the limitations of such complex VLPXODWLRQPRGHOVPD\EHUHODWHGWRHUURUDPSOL¿FDWLRQLI inaccurate estimations are made for single components. For example, wrong estimations for spore strength and dispersal from a source by aerobiological models may lead to over-predicting infections in a target region. However, an aerobiological framework, besides prediction application, is considered an important tool to identify knowledge gaps and point toward the future epidemiological research that might lead to more accurate predictions. Moreover, as observed, 3
SDFK\UKL]L spore data may become available in the coming years, Pan HWDO (2006) showed how validation of aerobiological models against actual spore concentration would improve model formulations, serving as a useful guide for early warning and detection of ASR, especially for regions where primary inoculum comes from distant regions.
In spite of the uncertainties, incredible advances in science and the use of cutting-edge technologies for plant disease prediction have been made in recent years to develop, enhance and apply models to predict and assess the risk of ASR. Advances such as aerobiological models and use of climate forecasts would not have been possible without the integration of a multi-disciplinary team of researchers, including plant pathologists, meteorologists, climatologists and computer specialists. Efforts for
monitoring disease patterns (over years), spore trapping and further biological research will continue to provide valuable information for enhancing models that are currently being applied in the leading soybean-producing countries – the United States and Brazil. Although the situation in the two countries is contrasting in terms of the impact of this disease on production, the previous and ongoing collaborative efforts among researchers and modelers from both countries have been of extreme value. Brazil provides a unique situation to observe disease patterns every year under very distinct conditions, and it can learn from North American experience in risk assessment and prediction to improve current models. Such interactions and information will help to keep improving our understanding of the factors affecting epidemics from ¿HOGWRFRQWLQHQWDOVFDOHLQRUGHUWRGHOLYHUPRUHUHDOLVWLF information about ASR risks to the various receivers.
ACKNOWLEDGEMENTS
We appreciate the critical review of this manuscript and suggestions given by Paul Esker, a Postdoctoral Research Fellow of the National Science Foundation on Biological Informatics and Francisco F. Laranjeira.
REFERENCES
ALVES, S.A.M., FURTADO, G.Q. & BERGAMIN FILHO, A. ,QÀXrQFLDGDVFRQGLo}HVFOLPiWLFDVVREUHDIHUUXJHPGDVRMD,Q Zambolim, L. (Org.). Ferrugem Asiática da Soja, Visconde do Rio %UDQFR0*6XSUHPD*Ui¿FDH(GLWRUDSS
ALVES, S.A.M., FURTADO, G.Q., GODOY, C.V. & BERGAMIN ),/+2 $ ,QÀXrQFLD GD WHPSHUDWXUD QR SHUtRGR ODWHQWH GD ferrugem asiática da soja. Summa Phytopathologica 32:S71. 2006.Summa Phytopathologica 32:S71. 2006. (Resumo)
BATCHELOR, W.D., YANG, X.B. & TSCHANZ, A.T. Development of a neural network for soybean rust epidemics. Transactions of the American Society of Agricultural Engineers 40:247-252. 1997.
BROMFIELD, K.R. Soybean rust: some considerations relevant to threat analysis. Protection Ecology 2:251-257. 1980.
BROMFIELD, K.R. Soybean Rust. Saint Paul MN. APS Press. Monograph no. 11. 1984.
CALDWELL, P.M., NUNKUMAR, A., PRETORIUS, Z.A. & FERNANDES, J.M.C. Development of 3KDNRSVRUD SDFK\UKL]L at different temperatures, relative humidities and leaf wetness duration. Proceedings, 9th International Workshop on Plant Disease Epidemiology. Landerneau, France. 2005.2005.
CANTERI, M.G., GODOY, C.V., DEL PONTE, E.M., FERNANDES, J.M.C. & PAVAN, W. Aplicações da computação QD¿WRSDWRORJLD5HYLVmR$QXDOGH3DWRORJLDGH3ODQWDV 285. 2004.
Brasileira, 29 (suplemento):S27-S28. 2004.
CANTERI, M.G., CARAMORI, P., TSUKAHARA, R., SILVA, O.C., FARIA, R. & GODOY, C.V. A system to map risk of infectionA system to map risk of infection by3KDNRSVRUDSDFK\UKL]L for Parana State, Brazil. Phytopathology 95:S16. 2005 (Abstract)
DEL PONTE, E.M. & YANG, X.B. Estratégias de modelaje para la predición e comunicación del riesgo de epidemias de la roya asiática de la soja. In: Popler, L.D. (Ed.) Roya Asiática de la Soja en América – El libro. Las Talitas, Tucumán, Estación Experimental Obispo Colombres. 2006. pp. 49-62.
DEL PONTE, E.M., GODOY, C.V., LI, X. & YANG, X.B. Predicting severity of Asian soybean rust with empirical rainfall models. Phytopathology 96:797-803. 2006.
DEL PONTE, E.M., LI, X. & YANG, X.B. Assessing the rainfall suitability of Asian soybean rust epidemics in the US soybean regions. Proceedings, National Soybean rust symposium, Nashville, TN, USA. . Online: http://www.plantmanagementnetwork.org/ infocenter/topic/soybeanrust/symposium/posters/06.asp. 2005.
DUTHIE, J.A. Models of the response of foliar parasites to the combined effects of temperature and duration of wetness. Phytopathology 87:1088-1095. 1997.
EVANS, K.J., NYQUIST, W.E. & LATIN, R.X. A model based on temperature and leaf weatness duration for establishment of alternaria leaf blight of muskmelon. Phytopathology 82:890-895. 1992.Phytopathology 82:890-895. 1992.
FUNDAÇÃO ABC. Sistema de informação de doenças da soja. Online: http://sid.fundacaoabc.org.br. 2006.2006.
GREGORY, P.H. The Microbiology of the Atmosphere. New York NY. Wiley. 1973.
GUMPERT, F. M., GEIGER, H. H. & STAHLE, U. A mathematical model of the epidemics in homogeneous and heterogeneous host VWDQGV =HLWVFKULIW 3ÀDQ]HQNUDQNKHLWHQ 3ÀDQ]HQVFKXW] 215. 1987.
ISARD S.A., MAIN, C.E., KEEVER, T., MAGAREY, R., REDLIN, S. & RUSSO, J.M. Weather based Assessment of Soybean Rust Threat to North America: First Year Report to Aphis. US Department of Agriculture, Animal and Plant Health Inspection 6HUYLFH 2QOLQH KWWSVQHW¿OHVXLXFHGXDULDWWLZZZ6%55HSB2QOLQH KWWSVQHW¿OHVXLXFHGXDULDWWLZZZ6%55HSB 15Jul04.htm. 2004.2004.
ISARD, S.A., GAGE, S.H., COMTOIS, P. & RUSSO, J.M. Principles of the Atmospheric Pathway for Invasive Species Applied to Soybean Rust. Bioscience 55:851-861. 2005.
ISARD, S.A., DUFAULT, N.S., MILES, M.R., HARTMAN, G.L., RUSSO, J.M., DE WOLF, E.D. & MOREL, W. The effect of solar irradiance on the mortality of 3KDNRSVRUD SDFK\UKL]L urediniospores. Plant Disease 90:941-945. 2006.
KIM, K.S., YANG, X.B., PAN, Z. & PEREZ-HERNANDES, O. Simulation of spore trajectories to identify potential pathways of soybean rust in the United States. Phytopathology 95:S54. 2005a. (Abstract)
KIM, K.S., WANG, T.C. & YANG, X.B. Simulation of apparent infection rate to predict severity of soybean rust using a fuzzy logic system. Phytopathology 95:1122-1131. 2005b.
KITANI, K. & INOUE, Y. Studies on the soybean rust. Bull. Shikoku Agric. Exp. Stn. (Zentsuji, Japan) 5:319-342. 1960.
KOCHMAN, J.K. The effect of temperature on development of soybeans rust (3KDNRSVRUD SDFK\UKL]L). Australian Journal of
Agricultural Research 30:273–277. 1979.
KOCHMAN, J.K. Soybean rust in Australia. In: Ford, R.E. & Sinclair, J.B. (Eds.) Rust of Soybean - The problem and research needs. Manila, Philippines. International Agricultural Publications. 1977. pp. 44-48.
KRAUSE, R.A. & MASSIE, L.B. Predictive systems: modern approaches to disease control. Annual Review of Phytopathology 13:31-47. 1975.
LALANCETTE, N., ELLIS, M.A. & MADDEN, L.V. Development RI DQ LQIHFWLRQ HI¿FLHQF\ PRGHO IRU3ODVPRSDUD YLWLFROD on American Grape based on temperature and duration of leaf wetness. Phytopathology 78:794-800. 1988.
LEVY, C. Epidemiology and chemical control of soybean rust in southern Africa. Plant Disease 89:669-674. 2005.
MARCHETTI, M.A., MELCHING, J.S. & BROMFIELD, K. R. The effects of temperature and dew period on germination and infection by urediospores of 3KDNRSVRUD SDFK\UKL]L. Phytopathology 66:461-463. 1976.
MELCHING, J.S., BROMFIELD, K.R. & KINGSOLVER, C.H. Infection, colonization, and uredospore production on Wayne soybean by four cultures of 3KDNRSVRUDSDFK\UKL]L, the cause of soybean rust. Phytopathology 69:1262-1265. 1979.
MELCHING, J.S., DOWLER, W.M., KOOGLE, D.L. & ROYER, M.H. Effects of duration, frequency, and temperature of leaf wetness periods on soybean rust. Plant Disease 73:117-122. 1989.
NAPDFC. North American Plant Disease Forecast Center. Soybean Rust Forecast Homepage. Online: http://www.ces.ncsu.edu/depts/Online: http://www.ces.ncsu.edu/depts/ pp/soybeanrust/. 2006.
NOAA. National Oceanic and Atmospheric Administration.National Oceanic and Atmospheric Administration. Atmospheric Research Laboratory. NOAA ARL HYSPLIT Model. Online: http://www.arl.noaa.gov/ready/hysplit4.html. 2006.
NOAA. National Oceanic and Atmospheric Administration. ClimateNational Oceanic and Atmospheric Administration. Climate Prediction Center. 2005. Online: http://www.cpc.noaa.gov
PAN, Z., PIVONIA, S., PASKEN, R., PIETROWICZ, J. & YANG, X.B. Simulation of airborne dispersal potentials of soybean rustSimulation of airborne dispersal potentials of soybean rust from Africa to South America and from South America to North America. Phytopathology 94:S90. 2004. (Abstract)
PAN, Z., XUE, L., DEL PONTE, E.M., ANDRADE, D., LI, X., PASKEN, R. & YANG, X.B. Soybean rust dispersal prediction and analysis in the US for 2005 growing season. Proceedings, National Soybean rust symposium, Nashville, TN, USA. Online:
http://www.plantmanagementnetwork.org/infocenter/topic/ soybeanrust/symposium/posters/26.asp. 2005.
PAN, Z., YANG, X.B., PIVONIA, S., XUE, L., PASKEN, R. & ROADS, J. Long-term prediction of soybean rust entry into the continental United States. Plant Disease 90:840-846. 2006.
PIVONIA, S. & YANG, X.B. Assessment of potential year round establishment of soybean rust throughout the world. Plant Disease 88:523–529. 2004.
PIVONIA, S. & YANG, X.B. Relating epidemic progress from a general disease model to seasonal appearance time of rusts in the United States: implications for soybean rust. PhytopathologyPhytopathology 96:400-407. 2006.
30:290-292. 2004.
RIPLEY, B.D. Pattern Recognition and Neural Networks. Cambridge. Cambridge University Press. 1996.
ROSSI, R.L. First report of 3KDNRSVRUD SDFK\UKL]L, the causal organism of soybean rust in the Province of Misiones, Argentina. Plant Disease 87:102. 2003.
SCHNEIDER, R.W., HOLIER, C.A., WHITAM, H.K., PALM, M.E., MCKEMY, J.M., HERNANDEZ, J.R., LEVY, L. & DEVRIES-PATERSON, R. First Report of Soybean Rust Caused by3KDNRSVRUDSDFK\UKL]Lin the Continental United States. Plant Disease 89:774. 2005.
SINCLAIR, J.B. & HARTMAN, G. L. Soybean diseases. In: Hartman, G.L., Sinclair, J.B. & Rupe, J.C. (Eds.) Compendium of soybean diseases. 4 ed. Saint Paul MN. APS Press. 1999. pp. 3-4.
SOUTHERST, R.W. & MAYWALD, G.F. A computerized system for matching climates in ecology. Agriculture, Ecosystems & Environment 13:281-299. 1985.
TAN, Y.J., YU, Z. & YANG, C.Y. Soybean rust. Beijing, China. China Agricultural Press. 1996.
TENG, P.S. A comparison of simulation approaches to epidemic modeling. Annual Review of Phytopathology 23:351-379. 1985.
6101
TSCHANZ, A. T. Soybean rust epidemiology: Final report. Asian Vegetable Research and Development Center. 1984.
VAN DER PLANK, J.E. Plant diseases: epidemics and control. New York NY. Academic Press. 1963.
YANG, X.B. Risk assessment: concepts, development, and future opportunities. Plant Health Progress. doi:10.1094/PHP-2003-11-3-02-RV. 2003.
YANG, X.B., DOWLER, W.M. & TSCHANZ, A.T. A simulation model for assessing soybean rust epidemics. Journal of Phytopathology 133:187-200. 1991a.
YANG, X.B., DOWLER, W.M. & ROYER, M.H. Assessing the risk and potential impact of an exotic plant disease. Plant Disease 75:976-982. 1991b.
YANG, X.B., DEL PONTE, E.M. & KIM, K.S. Soybean rust outlook – June 30. Integrated Crop Management 494(17):4. 2005.
YANG, X.B. Framework development in plant disease risk assessment and its application. European Journal of Plant Pathology 115:25–34. 2006.
![FIG. 1 - Computer simulation of historical weather data (1997- (1997-2003) for potential deposition areas for 3KDNRSVRUDSDFK\UKL]L during two 15-day period in the month of July (A and B) produced from southeastern Alabama if a large amount of spores is](https://thumb-eu.123doks.com/thumbv2/123dok_br/15854762.661292/5.892.484.834.136.611/computer-simulation-historical-potential-deposition-kdnrsvrudsdfk-produced-southeastern.webp)