http://www.uem.br/acta ISSN printed: 1679-9275 ISSN on-line: 1807-8621
Acta Scientiarum
Doi: 10.4025/actasciagron.v36i1.16919
Genetic control of partial resistance to Asian soybean rust
Juliana Araújo Santos Martins1* and Fernando Cézar Juliatti2
1
Instituto Federal de Educação, Ciência e Tecnologia do Triângulo Mineiro, Fazenda Sobradinho, s/n, Cx. Postal 592, 38400-974, Uberlândia, Minas Gerais, Brazil. 2
Instituto de Ciências Agrárias, Universidade Federal de Uberlândia, Uberlândia, Minas Gerais, Brazil. *Author for correspondence. E-mail: julianaaraujo@iftm.edu.br
ABSTRACT. The genetic control of rust resistance was studied using the Caiapônia x IAC-100 and Luziânia x Potenza crosses. The F2 and F3 generations were evaluated. Rust severity was quantified through visual assessment of the middle third of three leaflets per plant and performed by three different evaluators; the average score was calculated foreach individual plant. From these data, we estimated the mean and variance of the genetic components by employing the weighted least squares method. The estimated number of genes and broad- and narrow-sense heritabilities were also obtained. It was concluded that rust resistance is a characteristic controlled by 2 to 23 genes that are predominantly dominant. The estimate of narrow-sense heritability was greater than 70% for the Caiapônia x IAC-100 cross, and the wide-sense heritability was greater than 60% for the Luziânia x Potenza cross; thus, it is possible to successfully select resistant individuals in early generations.
Keywords:Glycine max, Phakopsora pachyrhizi, dominance variance, heritability, race non-specific disease resistance.
Controle genético da resistência parcial à ferrugem asiática da soja
RESUMO. Estudos sobre o controle genético da resistência à ferrugem asiática foram a conduzidos a partir dos cruzamentos Caiapônia x IAC 100 e Luziânia x Potenza. Foram avaliadas as gerações F2 e F3. A severidade da ferrugem asiática foi obtida pela estimativa visual de 3 folíolos do terço médio/planta. A partir desses dados foram estimados os componentes genéticos de média e de variância, empregando-se o método dos quadrados mínimos ponderados. Foram obtidas também a estimativa do número de genes e da herdabilidade no sentido amplo e restrito. Concluiu-se que o controle genético da resistência à Phakopsora pachyrhizi governado por 2 a 23 genes, com predominância dos efeitos dominantes no controle. A estimativa da herdabilidade no sentido restrito acima de 70% para o cruzamento Caiapônia x IAC 100 e amplo acima de 60% para o cruzamento Luziânia x Potenza, mostrou que há possibilidade de sucesso na seleção de indivíduos resistentes já nas gerações iniciais.
Palavras-chave:Glycine max, Phakopsora pachyrhizi, variância de dominância, herdabilidade, resistência raça não-específica.
Introduction
The Asian soybean rust (ASR) caused by the fungal pathogen Phakopsora pachyrhizi was identified in Brazil in 2001 and quickly infected soybeans in several countries in South America. ASR is responsible for severe economic losses because of its high damage potential and its constant presence in almost all soybean-producing areas recently (HARTMAN et al., 2005).
Brazilian breeding programs have not yet developed resistant cultivars, and therefore, chemical control is still used to reduce the losses caused by ASR. Currently, the primary form of control is based on the use offungicides of different classes and action modes (MILES et al., 2007). This is partially because the fungus hasseveral races with multiple virulence alleles (SINCLAIR; HARTMAN, 1999), which suggests that the ASR
pathogen has high genetic variability, mainly in the Brazilian savanna (YORINORI et al., 2005). Thus, theidentification of resistant cultivars is necessary.
Genetic studies confirm the existence of additive genetic effects for ASR (PIEROZZI et al., 2008; RIBEIRO et al., 2007). Quantitative studies of the genes that express resistance to ASR genotypes are needed to support the development of effective longer-lasting resistance in new cultivars. However, in Brazil,because of the recent re-emergence of the pathogen, there are few studies concerning the inheritance of resistance to soybean rust (AKAMATSU et al., 2004; PIEROZZI et al., 2008; RIBEIRO et al., 2007).
(CRUZ, 2005). Previous studies by Azevedo et al., 2007, Santos et al., 2007 and Silva et al., 2007, demonstrated partial resistance for IAC-100 and Potenza.
This study investigates on genetic control of resistance to Asian soybean rust in lines derived from IAC-100 and Potenza.
Material and methods
The experiment was carried out in a greenhouse at the Agricultural Sciences Institute, which belongs to the Federal University of Uberlândia, Uberlândia, Brazil, and also at CapimBranco farm, which belongs to the Federal University of Uberlândia, Uberlândia, Minas Gerais State (located at 55º18'23''S and 48º17'19''W). The populations were assessed at the Agroteste Experimental Station, Uberlândia, Minas Gerais State (located at 21º12'58''S and 45º03'18''W). In July 2007, (Caiapônia x IAC-100) and (Luziânia x Potenza) were crossed in greenhouse conditions to obtain the F1 population. The breeding of the F1 and F2
generations and the multiplication of the parents was also performed in a greenhouse in the 2008 to 2009 period.
For the 2009-2010 crop, the parents and the F2
and F3 generations were assessed under field
conditions. The trials were arranged in a randomised complete block design with four replications. The experimental conditions were those commonly used in soybean crop management. During the experiment, chemical control of pests and manual weed control were performed as necessary.
To reduce the risk of the evolving ASR epidemic (because sowing was delayed) and to better assess partial resistance, a fungicide of the chemical group strobilurin (azoxystrobin) was sprayed. 300 mL of commercial product per hectare were used for the first spraying. In the second spraying, a mixture of triazole and strobilurin (pyraclostrobin + epoxiconazole) was used; the dose was 500 mL per hectare. The spraying was performed at stages R1
and R5 (FEHR; CAVINESS, 1977). This action,
therefore, was intended to improve thereliability of the assessment of partial resistance.
The assessment was performed at stage R5.5
(FEHR; CAVINESS, 1977), 80 days after sowing, because this stage was the developmental stage in which there was the greatest expression of the severity of symptoms in susceptible strains. The disease severity was scored by three evaluators who inspected the middle third ofthree leaflets per plant and used the diagrammatic scale of disease severity
scores, which considers the percentage of leaf tissue that is infected (the scale uses thresholds of 0.5, 5, 20, 40,60, and 80%).
Statistical and genetic analysis
Using the scores of individual plants, the analysis of variance (ANOVA) was calculated for each cross using the parents and the F2 and F3 generations. The
means and variances of the severity scores of the parents and the F2 and F3 generations were
estimated. Using these data, the mean components were also estimatedusing the weighted least squares method (WLS) (MATHER; JINKS, 1984; RAMALHO et al., 1993; ROWE; ALEXANDER, 1980). The additive-dominance model without epistasis was considered. The genetic variance and environmental components were estimated using the WLS method iterative (MATHER; JINKS, 1984;RAMALHO et al., 1993). The components of the mean and variance were estimated using the computer software Mapgen. The software was also used to estimate the number of genes and the broad- and narrow-sense heritability coefficients (BERNARDO, 2002):
2 rF2
h =A2/
2
F2
,h2rF3=1,5 / 2 A
2
F3
,h2aF2 = 2 F2
-2 E /F22
andh2aF3= 2 F3 -E2
/F23
.
To estimate the number of genes (k) involved in the trait control and to consider what fraction are dominant, the expression of Burton (1951) was used by Ramalho et al. (1993):
k = 2 E 2 F 2 2 ˆ ˆ D ) 4 3 ( 4 1 2 , where 1 2 1 1 P P P F
, D = P2P1, P1 isthe mean trait
for parent 1,P2is the mean trait for parent 2, 2 F2 is
the phenotypic variance of the F2 family, 2 E is the
environmental variance and F1is the mean of the F1
family.
Results and discussion
for studying the genetic control of the disease resistance trait.
Table 1. Analysis of the variance of the severity scores of Asian rust for the parent and the cross-derived F2 and F3 generations of soybeans.
MSQ MSQ
Source of variation Degrees of freedom
Caiapônia x IAC100
Degrees of freedom
Luziânia x Potenza
Blocks 3 8,36 3 11,12
Generations 5 513,17** 3 671,17**
Residual 15 30,10 9 13,0
Mean 27,01 24,0
Coefficient
Of variation (%) 20,31 15,02
**: significant at the level of 1% of probability (p > 0.01) by F test.
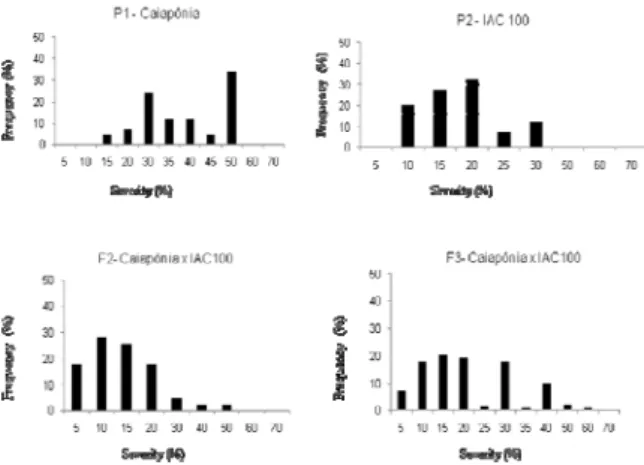
The frequency distributions of the F2 and F3
severity scores of each cross are shown in Figures 1 and 2. The frequency distribution in all generations suggests that the trait is controlled polygenically; if the trait were monogenic, without the environmental effect, two or three phenotypic classes would be expected, but this was not the case. The absence of a distribution with well-defined phenotypic frequencies has already been noted by others (PIEROZZI et al., 2008; RIBEIRO et al., 2007).
For the Caiapônia x IAC-100 cross, the results shown in Figure 1 indicate the presence of dominance in the trait control. IAC-100 demonstrated strong resistance and had a score below 30%. The F2 and F3 generations demonstrated
similar performance to that of the parents, but with some individuals had higher scores. The results presented by Garcia et al. (2008) and Pierozzi et al. (2008) for PI200526 reinforce the observation that some dominant genes may control the trait.
Figure 1. Frequency distribution of these verity of soybean rust in each generation for the Caiapônia x IAC-100 cross grown in Uberlândia, Minas Gerais State, 2011.
The Luziânia x Potenza cross generations showed a continuous distribution for the trait (see Figure 2). Although the parent Potenza is partially
resistant to ASR (SILVA et al., 2007), in this experiment, the scores of disease severity for Potenza were significantly higher than for the parent Luziânia. This fact maybe related toenvironmental conditions and the variability of the pathogen (JULIATTI et al., 2003). The frequency distributions of the severity scores suggested that quantitative inheritance controls the resistance to ASR, which has been observed in other studies that used if different parents (GARCIA et al., 2008; RIBEIRO et al., 2007).
Figure 2. Frequency distribution oftheseverity scores of soybean rustin each generation for the LuziâniaxPotenza cross grown in Uberlândia, Minas Gerais State, 2011.
Components of the means and variances Caiapônia x IAC-100 cross
The data inTable2 demonstrate that the means of the F2 and F3 generations’ scores were different from
the mean scores of the parents. In principle, this result demonstrates that dominant genes participate in the control of partial resistance to ASR in the IAC-100 parent.
This last observation may be confirmed by the estimates of the mean components. Observe that the estimate of d, the contribution of heterozygous loci in relation to the midpoint of the two homozygous parents, was non zero and negative, which indicates that the dominance is to reduce the expression of the trait (Table 2). It was also shown that the mean dominance degree (MDD) was greater than 1 (the value was 2.64).
Table 2. The number of individuals per population cross and the mean, the variance, and the components of the mean and the variance for the soybean rust severity scores of Caiapônia x IAC-100.
Population Nº individuals Mean (%) Variance
Caiapônia 40 37.63 120.50
IAC 100 40 18.25 39.17
F2 120 15.13 89.09
F3 400 21.46 146.41
Mean Variance Components1 Estimates components Estimates
m 27.89 ± 0.062 A2
62.70
[55.94; 70.76]3
a 9.66 ± 0.08 2D
-4
-
d -25.59 ± 0.21 E2
79.84
[59.70; 112.27]
MDD 2.64 - -
2
0.01ns
R2 (%) 99.9 - 96.6
1m: mean of the homozygous genotypes; a: deviation of the homozygous genotypes relative to the midpoint; d: deviation of the heterozygote relative to themidpoint. 2Standard error. 3Lower and upper limits of the reliable interval for the variances. 4 The estimates 2
D
are negative.
Negative estimates can occur when the variance component is very small. Another cause may have been the failure of the assumptions of the Warner-Mather method, in which it is assumed that the sources of genetic variation are only dominant additive and that the environmental variance component for the F2 generation is the mean of the
environmental variance components for the backcross generations. Furthermore, there is the possibility of human error because the disease assessment used to assign the scores to the plants was made visually (LOBO et al., 2005).
Luziânia x Potenza cross
In this study, the heterozygous dominance effect (d) and the additive effect contribute to decreased susceptibility or increased resistance to ASR (Table 3).
The component of the additive effect (a) would never be negative, whereas the signal component of the effects of dominance deviations (d) depends on the predominant direction of dominance (MATHER; JINKS, 1984). The existence of negative additive components (a) is because that the parent P1 does not always refer to the genotype with
the highest trait expression, which in this case would be the genotype most susceptible to the disease. P1,
Luziânia, was more resistant and received the lowest scores and thus the lowest mean; therefore, it had less disease severity. The negative value for the additive effect (a) is a result of the low mean (LOBO et al., 2005).
It has been found that soybean lines’ resistance to the pathogen may vary over time. In principle, this variance indicates that in some strains, the resistance mechanism depends on environmental factors or
physiological effects. It has been observed that environmental conditions are the main factor that controls the disease severity and that more severe disease cases occur under conditions of prolonged leaf wetness (DEL PONTE et al., 2006). This fact was confirmed in the severity assessment because high variance in the disease severity was observed among the parents, which indicates greater instability because of environmental effects on the disease. The instability of the rust severity displayed by some soybean lines has been observed by others (PIEROZZI et al., 2008).
Table 3. The number of individuals per population cross and the mean, the variance, and the components of the mean and the variance for the soybean rust severity scores of Luziânia x Potenza.
Population Nº individuals Mean (%) Variance
Luziânia 40 12.16 31.86
Potenza 40 42.43 96.76
F2 226 20.77 194.62
F3 400 20.29 162.54
Mean Variance components 1 Estimates components Estimates
m 25.52 2A
32.4
(3.28)2 [29.25; 36.07]3
a -14.13
2 D
96.55
(3.67) [83.23; 113.36]
d -13.45 E2
65,68
(10.83) [49.11; 92.36]
MDD 0.95 - -
2
17.44*
R2 (%) 99.20 - -
1m: mean of the homozygous genotypes; a: deviation of the homozygous genotypes relative to the midpoint; d: deviation of the heterozygote relative to the midpoint. 2Standard error. 3Lower and upper limits of the reliable interval for the variances.
The estimate of d was lower than the estimate a, which demonstrates that the additive effects were more important than non-additive effects. The MDD calculated using the components of the mean was estimated to be 0.95, which indicates that dominance is present in the control of the resistance. However, when the variance components were considered, the non-additive component D2
was
greater than A2
. This is because the value d is calculated using the sum of the deviations such that values with opposite signs can cancel. The high value of D2
associated with the low value (d) demonstrates that this trait is primarily controlled by dominant alleles. However, these alleles do not act in the same manner, i.e., there are dominant alleles that cause ASR resistance, but there are also dominant alleles that decrease the resistance.
opposite signs, the individual effects are not clearly indicated because the individual effects of each locus were squared.
However, unlike the results found in this study, some previous studies have reported a predominance of additive effects in the genetic control of soybean rust resistance (PIEROZZI et al., 2008; RIBEIRO et al., 2007). According to Ribeiro et al. (2007) and Pierozzi et al. (2008), quantitative genetic resistance to rust is controlled predominantly by genes that act additively and which are dispersed in the parents.
Estimation of the heritability and the number of genes
Estimates of the heritability and the number of genes are shown in Table 4. It is noteworthy that the heritability is a property of the trait that depends on the population and the environmental conditions to which the individuals were submitted (RAMALHO et al., 1993).
Table 4. Estimates of heritability in broad and narrow sense and the likely number of genes.
F2 population (%) F3 population (%)
Crosses 2
a
h h2r h2a 2 r
h k
Luziânia x Potenza 66.25 16.65 60.0 30.0 2.0 Caiapônia x IAC 100 10.40 70.40 45.5 64.23 23.0
The estimates of the narrow-sense heritability (h2r) for the F3 population were 30 and 64.23%; these
values are similar to those observed by Pierozzi et al. (2008) for populations in the F2 generation. The
estimates of Ribeiro et al. (2007) ranged from 23.12 to 55.83%, which demonstrates that resistant individuals can be successfully selected in early generations. Because the values are not very high, the breeder should use a low selection intensity in early generations such that in later generations, the most superior progeny can be identified.
The differences between the narrow-sense heritability values ( 2
r
h ) of two crosses for the two
generations are noticeable; the values are higher in the F2 generation for the Caiapônia x IAC-100 cross
( 2 r
h = 70.40%),and in the Luziânia x Potenza cross, the
highest value was for the F3 generation ( 2 r
h = 30%). The
high valuesof 2 r
h , which are higher than the estimate of
2 a
h , for the Caiapônia x IAC-100 cross may be related to
thenegative values of the dominance variance.
In the Luziânia x Potenza cross, even the highest estimate of h2r was not large. These results
demonstrate the effect of the environment on the expression of resistance to soybean rust.
For the F2 population, the broad-sense
heritability estimates ranged from low (Caiapônia x IAC-100) to moderately high (Luziânia x Potenza) (Table 4). High or moderately high estimates for some traits indicate the prevalence of the genetic environmental effects (MARIGUELE et al., 2008). Estimates of h2rwere low for the Luziânia x Potenza
cross. The low estimate indicates that although there was a predominance of genetic environmental effects, the efficiency of the selection of individual plants tends to be low in segregating generations, which are not significantly advanced because of low values of h2r (
2 r
h is a function of additive genetic variance in addition to the portion of genetic variance that can be fixed with the selection).
When selection is used to reduce the symptoms or the disease severity in the presence of the pathogen (by artificial or natural inoculation), the effects of different genes and alleles in their allelic forms and the dominance variance derived from them, which directly influences the broad-sense heritability, are highly likely to be fixed by selection. Thus, one can successfully increase the ASR resistance by performing selection on the F2 or F3
populations. It is easier to understand this concept when the occurrence of disease in cultivated plants and the host-pathogen interaction is examined based on the key-lock phenomenon (the product of a gene or allele in the plant blocks recognition by the pathogen or delays the vital cycle, which reduces the disease progress). A failure of the pathogen to recognise the host or a delay in this process is caused by the effects of dominance (RIBEIRO et al., 2007). Thus, a protein or toxin that is produced is at least partially responsible for decreasing the severity of the symptoms. These effects were studied in the ASR pathosystem and were measured by the reduction in the disease progress rate (AZEVEDO et al., 2007; SANTOS et al., 2007; SILVA et al., 2007), the incubation and latent periods and the area under the disease progress curve, which directly relates to partial or horizontal resistance.
Estimates of the broad-sense heritability ( 2 a
h ) of
the F3 populationwere moderately elevated (60.0 and
45.5% for Luziânia x Caiapônia and Potenza x IAC-100, respectively) and there was a predominance of genetic environmental effects.
number but rather as an indication of the inheritance type (mono-, oligo- or polygenic). The estimated number of genes observed in this study confirms the quantitative inheritance of ASR resistance. The values estimated for the number of genes indicate that each intersection is particular and depends on the genotypes used in the crosses and on biotic and abiotic factors that are present.
The development of partial resistance to ASR is viable. However, cycles of recurrent selection for smaller groups must be used. One can use genes in different genotypes, with or without the use of molecular markers, or pyramid these genes to increase partial resistance to soybean rust (JULIATTI et al., 2010).
Conclusion
It was concluded that rust resistance is a characteristic controlled by 2 to 23 genes that are predominantly dominant. The estimate of narrow-sense heritability was greater than 70% for the Caiapônia x IAC-100 cross, and the wide-sense heritability was greater than 60% for the Luziânia x Potenza cross; thus, it is possible to successfully select resistant individuals in early generations.
Acknowledgements
The authors are indebted to the Fundação de Amparo a Pesquisa do Estado de Minas Gerais (FAPEMIG) and the Universidade Federal de Uberlândia (UFU) for funding and support.
References
AKAMATSU, M. A.; BARRETO, M.; AKAMATSU, R. Detecção e distinção de Phakopsora pachyrhizie P. meibomiae
em amostras do herbário uredinológico do Instituto Biológico. Fitopatologia Brasileira, v. 29, Suplemento, p. 277-278, 2004.
AZEVEDO, L. A. S.; JULIATTI, F. C.; BARRETO, M. Resistência de genótipos de soja à Phakopsora pachyrhizi. Summa Phytopathologica, v. 33, n. 3, p. 364-371, 2007. BERNARDO, R. Breeding for quantitative traits in plants. Minnesota: Dept. of Agronomy and Plant Genetics, 2002.
CRUZ, C. D. Princípios de genética quantitativa. Viçosa: Universidade Federal de Viçosa, 2005.
DEL PONTE, E. M.; GODOY, C. V.; LI, X.; YANG, X. B. Predicting severity of Asian soybean rust epidemics with empirical rain fall models. Phytopathology, v. 96, n. 7, p. 797-803, 2006.
FEHR, W. P.; CAVINESS, C. E. Stages of soybean development. Agriculture and home economics experiment station and cooperative extension service. Ames: Iowa State University, 1977. (Special Report 80).
GARCIA, A.; CALVO, E. S.; KIIHL, R. A. S.; HARADA, A.; HIROMOTO, D. M.; VIEIRA, L. G. E. Molecular mapping of soybean rust (Phakopsora pachyrhizi) resistance genes: discovery of a novel locus and alleles. Theoretical and Applied Genetics, v. 117, n. 4, p. 545-553, 2008. HARTMAN, G. L.; MILES, M. R.; FREDERICK, R. D. Breeding for resistance to soybean rust. Plant Disease, v. 89, n. 6, p. 664-666, 2005.
JULIATTI, F. C.; BORGES, E. N.; PASSOS, R. R.; CALDEIRA JÚNIOR, J. C.; BRANDÃO, A. M. Doenças da soja. Cultivar, v. 47, p. 3-14, 2003.
JULIATTI, F. C.; BALARDIN, R. S.; MARTINS, J. A. S.; REZENDE, A. A.; LENTZ, G. Resistência genética da soja à Phakopsora pachyrhizi e uso de fungicidas no manejo sustentável da doença. Revisão Anual de Patologia de Plantas, v. 18, n. 1, p. 77-118, 2010.
LOBO, V. L. S.; GIORDANO, L. B.; LOPES, C. A. Herança da resistência à mancha-bacteriana em tomateiro. Fitopatologia Brasileira, v. 30, n. 4, p. 343-349, 2005. MARIGUELE, K. H.; MALUF, W. R.; GOMES, L. A. A.; LOPES, M. J. C.; MELO, O. D. Controle genético da qualidade da vagem em cruzamento de feijão-vagem e feijão-comum. Pesquisa Agropecuária Brasileira, v. 43, n. 1, p. 47-52, 2008.
MATHER, K.; JINKS, L. L. Introdução à genética biométrica. Ribeirão Preto: Sociedade Brasileira de Genética, 1984.
MILES, M. R.; LEVY, C.; MOREL, W.; MUELLER, T.; STEINLAGE, T.; VAN RIJ, N.; FREDERICK, R. D.; HARTMAN, G. L. International fungicide efficacy trials for the management of soybean rust. Plant Disease, v. 91, n. 11, p. 1450-1458, 2007.
PIEROZZI, P. H. B.; RIBEIRO, A. S.; MOREIRA, J. U. V.; LAPERUTA, L. D. C.; RACHID, B. F.; LIMA, W. F.; ARIAS, C. A. A.; OLIVEIRA, M. F.; TOLEDO, J. F. F. New soybean (Glycine max Fabales, Fabaceae) sources os qualitative genetic resistance to asian soybean rust caused by
Phakopsora pachyrhizi (Uredinales, Phakopsoraceae). Genetics and Molecular Biology, v. 31, n. 2, p. 505-511, 2008. RAMALHO, M. A. P.; SANTOS, J. B.; ZIMMERMANN, M. J. O. Genética quantitativa em plantas autógamas: aplicações ao melhoramento do feijoeiro. Goiânia: UFG, 1993.
RIBEIRO, A. S.; MOREIRA, J. U. V.; PIEROZZI, P. H. B.; RACHID, B. F.; TOLEDO, J. F. F.; ARIAS, C. A. A.; SOARES, R. M.; GODOY, C. V. Genetic control of Asian rust in soybean. Euphytica, v. 157, n. 1-2, p. 15-25, 2007. ROWE, K. E.; ALEXANDER, W. L. Computations for estimating the genetic parameters in joint-scaling test. Crop Science, v. 20, n. 1, p. 109-110, 1980.
Society for Horticultural Science, v. 114, n. 1, p. 111–114, 1989.
SILVA, V. A. S.; JULIATTI, F. C.; SILVA, L. A. S. Interação entre resistência genética parcial e fungicidas no controle da ferrugem asiática da soja. Pesquisa Agropecuária Brasileira, v. 42, n. 9, p. 1261-1268, 2007. SINCLAIR, J. B.; HARTMAN, G. L. Soybean diseases. In: HARTMAN, G. L.; SINCLAIR, J. B.; RUPE, J. C. (Ed.). Compendium of soybean diseases. 4th ed. St. Paul: American Phytopathological Society, 1999. p. 3-4. YORINORI, J. T.; PAIVA, W. M.; FREDERICK, R. D.; COSTAMILAN, L. M.; BERTAGNOLLI, P. F.;
HARTMAN, G. E.; GODOY, C. V.; NUNES JUNIOR, J. Epidemics of soybean rust (Phakopsora pachyrhizi) in Brazil and Paraguay. Plant Disease, v. 89, n. 6, p. 675-677, 2005.
Received on April 24, 2012. Accepted on September 4, 2012.