Resilience analysis for agricultural systems of North China
Plain based on a dynamic system model
Hongjun Li
1; Zhijun Liu
1,2; Li Zheng
1; Yuping Lei
1*
1
Center for Agricultural Resources Research, Inst. of Genetic and Developmental Biology, Chinese Academy of Sciences, 286 Huaizhong Road, Shijiazhuang – 050021 – Hebei Province, China.
2
Dynamics Solutions, LLC, Knoxville, Tennessee – 37919 – USA. *Corresponding author <[email protected]>
ABSTRACT: This paper presents a case study of resilience theory to understand agricultural systems in the Luancheng County of the North China Plain. A dynanic system model coupled with social, economic and ecological subsystems of agriculture for the Luancheng County was constructed with a time step of one month. The model includes five main components, water resources, profitability, irrigation, crop yield and area. The simulated groundwater table, wheat area and yield, maize area and yield, and rural labor transfer reflected the general trend of the observed data, with calculated determination coefficients higher than 0.88. Resilience of agricultural systems, as indicated by agricultural profitability and food security, were explored for the Luancheng County. Initially, investments in agriculture increased its resilience rapidly. However, with the degradation of resources and the increases in agricultural investment, the cost of agricultural production became too high to gain profit. The rise in population increases the risk of food security. As a result, the resilience of agricultural systems decreased gradually. The Luancheng County is now in the conservation phase of the adaptive cycle. Partial adjustments should be introduced to enhance its resilience and promote the continuing development of the agricultural systems.
Key words: agricultural management, water resources, food production, natural and socioeconomic systems
Análise de elasticidade para sistemas agrícolas da Planície do Norte da
China baseada em um modelo dinâmico de sistema
RESUMO: Este trabalho se refere a um estudo de caso da teoria de elasticidade para entender sistemas agrícolas na província de Luancheng na planície do norte da China. Foi construído um modelo de sistema dinâmico acoplado a subsistemas agrícolas sociais, econômicos e ecológicos para a província de Luancheng com um intervalo de tempo de um mês. O modelo inclui cinco componentes principais: recursos hídricos, rentabilidade, irrigação, produção agrícola e área. O lençol freático simulado, a área e a produção de trigo, a área e produção de milho e a transferência de mão de obra refletiram a tendência geral dos resultados observados com coeficientes de determinação maiores que 0.88. A elasticidade dos sistemas agrícolas, indicada pela rentabilidade e segurança alimentar, foi explorada para a província de Luancheng, que mostrou que inicialmente os investimentos em agricultura tiveram sua elasticidade aumentada rapidamente. Entretanto, com a degradação dos recursos e o aumento do investimento agrícola, o custo da produção agrícola tornou-se muito alto para obtenção de lucro. O aumento de população aumenta o risco de segurança alimentar. Como resultado, a elasticidade dos sistemas agrícolas decresceu gradualmente. A província de Luancheng encontra-se agora na fase conservativa do ciclo de adaptação. Ajustes parciais deveriam ser implementados para impulsionar sua elasticidade e promover o desenvolvimento contínuo dos sistemas agrícolas.
Palavras chave: manejo agrícola, recursos hídricos, produção de alimentos, sistemas naturais e sócio-econômicos
Introduction
Due to the nonlinea changes in system behavior, ex-ternal disturbances and reflexivity of human actions, ag-ricultural systems are not easy to be understood, man-aged, and predicted. As a result, linear programming, multi-objective optimization and “command and con-trol” approaches have generally failed in modeling and managing agricultural systems (Holling and Meffe, 1996). At the same time, approaches that can maintain systems in a desirable state by means of maintaining and improving system resilience have received more and more attention (Walker et al., 2002). Resilience research
and management have therefore been increasingly of in-terest in the management of complex systems.
of the dynamic system model as a quantitative frame-work for conducting practical resilience research on real-world systems.
The North China Plain (NCP, 35° to 40.5° N, 113° to 119.5°E), located in east China, is the second largest plain in China. NCP is China’s most important agricul-tural centre, producing more than half of the country’s wheat and one-third of its maize, making the status of its agricultural systems crucial to food security of China (Chen, 1999). Decreases in agricultural income and grain yield, transfer of rural labor to city, shortage of water resources, are the main elements threatening the NCP agricultural production nowadays. How can agricultural systems of the NCP achieve continuing development by absorbing these disturbances now and in the future? The answer is of great importance to the agriculture in China and to the world (Brown and Halweil, 1998). The objec-tive of this study is to apply resilience theory to the analy-sis and management of agricultural systems of the NCP. To accomplish this, we constructed a dynamic system model of agricultural systems for the Luancheng County to obtain the resilience information through its behav-iors and structure changes in the past. Using this model as a framework, two analyses acenarios were conducted to analyze the resilience of the agricultural systems in the future.
Material and Methods
The Luancheng County (37°412 343 -38°012 073 N, 114°282 253 -114°472 353 E) is located in the middle of NCP, southeast to Shijiazhuang (capital of the Hebei Province), and belongs to the Taihang piedmont plain (Figure 1). The elevation of the Luancheng County ranges from 45 to 65 m and its area is about 345 km2. There are two rivers in the county: the Xiao River and the Tuishui Ditch. The two rivers are all dried out and their main use is to drain sewage and storm water from the city of Shijiazhuang.
The crop schedule is dominated by dual-cropping system consisting of winter wheat and summer maize. Due to the climate change and interception by the up-stream dams, many rivers become dried out, and the groundwater is the only water resource available for crop irrigation. The average annual rainfall in this area is approximately 500 mm (Zhang, and You, 1996). The measured evapotranspiration (ET) of winter wheat and summer maize is about 800 mm (Wang, et al., 2001). And there is only 115.9 mm rainfall occurring during the growing season of the winter wheat which needs more than 453 mm of water to meet its need (Liu et al., 2002). The great deficit between rainfall and crop requirement has to be met by irrigation from groundwater. The over-exploitation of groundwater resources has resulted in the continuing decline of the groundwater table. The ground-water level declined from 3 - 4 m in 1949 to 30 m below surface in 2000. Now, the decline rate of groundwater is about 1 m year–1 (Yang et al., 2006).
A comprehensive agricultural dynamic system model was developed using Vensim 5.6a during 1950 to 2000. Five components, crop yield, crop area, irrigation, profitability, and water resources were included in the model. Figure 2 is the fuzzy cognitive map of the model and shows the interaction between these components. The selection of these five components was based on a review of the dynamics of the agricultural systems as described below.
As early as in 1950s, there were abundant water re-sources in the Luancheng County, and the groundwater level was at about 5 m below soil surface. Most wells were built of brick and the power of the pumping facili-ties was low. One brick well can only provide irriga-tion water for an area of 1.7 ha farmland (Luancheng County Annals, 1995). Due to the low irrigation capac-ity and frequent droughts, grain yields were very low and only two-thirds of arable land received irrigation. Planting systems were of one crop per year or three crops per two years.
Figure 1 – The location of the Luancheng County and North China Plain.
During 1960 to 1970, the irrigation capacity was greatly enhanced because drilled wells were substituted by brick wells. The increase in irrigation capacity en-sured that all arable land in this area could be irrigated in dry seasons. The improvement of the irrigation con-dition resulted in a change of the crop pattern. The area of winter wheat and summer maize (Zea mays L.) in-creased rapidly. The cultivated area of crops with low yield decreased, such as cotton (Gossypium hirsutum L.), millet (Panicum miliaceum L.) and yam (Colocasia esculenta L.). The planting schedule changed to the rota-tion of winter wheat (Triticum aestivum L.) and summer maize gradually. At the same time, commercial fertil-izer was introduced into the management practices in addition to the traditional animal manure, which greatly increased the grain yield.
By the end of 1999, the number of drilled wells had increased to 9,558 compared to 20 drilled wells in 1953. The drilled wells were distributed every 300 to 500 m (Lu et al., 2003). Each drilled well can provide irrigation water for an area of 6.6 ha farmland. The improvement in irrigation capacity and the increase in cropping area speeded up the consumption of groundwater resources, which resulted in the continuing lowering in groundwa-ter table (Yang et al., 2006). Hence, drilled wells had to be drilled deeper, which increases the cost for agricul-tural irrigation, which in turn reduces the profitability of crop production.
For farmers, agricultural production is to meet their demands for cash and food. With the increase in popu-lation, more and more arable land was converted to ur-ban land. The area of arable land for a farmer is too small to provide enough food and cash for his family. So, some farmers are renting their land to other farm-ers. Now, more and more rural labors transfer to the city for making a living. Agricultural production is now becoming a part-time job for farmers. It is possible that farmers will give up planting wheat when the profit de-creased to zero.
In the model, the water resources component simu-lates the water balance and groundwater table dynam-ics. The irrigation component describes the irrigation capacity and irrigation schedule of crops. The compo-nent of crop yield modeled the wheat and corn yield by taking into account the irrigation capacity, groundwa-ter resources availability, cropping system, fertilizers, variety, policy, and so on. The crop area component simulates the crop areas change during the simulation period, especially the effect of rural labor force transfer on cropped areas. The component of profitability esti-mates the profit of crop production.
The groundwater of Luancheng County is recharged by lateral flow, rainfall, seepage from rivers and return from irrigation. The isolines of groundwater are nearly perpendicular to the borders of north and south. The amounts of water flow into or out of the two borders were deemed to be negligible. Many researchers focused on calculating the amount of the lateral flow from the
Taihang Mountain (Wang et al., 2003; Jia et al., 2003; Huang et al., 2006). In this model, the lateral flow is cal-culated by Darcy’s Law. The southeast border is paral-lel to the isolines of groundwater. The hydraulic gradi-ent is equal to the slope of the landform. Therefore, the flow out of the area is also calculated by Darcy’s Law. The seepage rate from the Xiao River and Tuishui Ditch is set to be 35,000,000 m3 year–1 (Jia et al., 2003). Returned water rate from irrigation is also estimated. The ground-water is very deep. Therefore the groundground-water evapora-tion is assumed to be negligible. Water pumped from groundwater is mainly for the use of agriculture, indus-try, living and stockbreeding. Each item of water use is calculated, respectively.
In the model, specific water yield of the aquifer is set to 0.16 (Jia et al., 2003). Domestic water use is calcu-lated by multiplying population and their water use ra-tio respectively. Water consumpra-tion of industry was es-timated by multiplying the production value per US$ 1,471.00 by its water use. The data of industrial produc-tion and the number of livestock, such as cattle, pig, goat, chook and so on, came from statistical data. Water use by each kind of livestock was obtained from the Water Conservancy Office of Hebei Province.
The evolution of irrigation was caused by the en-hancement of irrigation capacity with the increase in the number of wells. This has caused the change of the crop irrigation schedule in terms of irrigation time, number of applications, and irrigation volume (Fu et al., 2002).
In NCP, the winter wheat growth stages receiving irrigation include planting, winter, seeding, turning green, jointing, heading, filling, and ripening (Zhang et al., 2002), and the irrigation stages of summer maize in-clude seeding and filling (Zhang et al., 2002). In practice, some stages are bypassed if the capacity of irrigation is low or soil water is enough for crop demand. With the information of irrigation capacity, soil water content, meteorological data, drought menace and crop water demand, the irrigation schedule can be determined quan-titatively as follows.
The quantity of crop water demand in different stages is calculated by multiplying crop reference evapo-transpiration by the crop coefficient. Liu et al. (2006) found that the Hargreaves method is very suitable in NCP for its good agreement with observation. The equa-tion of Hargreaves is shown by Equaequa-tion (1).
0 0.0023 x n( 17.8) a/O
ET T T T R (1)
where: ET0 is reference evapotranspiration (mm month–1);
Ra is extra-atmospheric radiation (MJ m–2 month–1); O is latent heat of vaporization (MJ kg–1); T
x, Tn and T are the
maximum, minimum and mean temperatures, respec-tively. The crop coefficients (Kc) of winter wheat and summer maize are provided by Cheng et al. (1994) and Chen (1995).
i–1 and precipitation in month i. If ASW is greater than the crop water demand in month i, the irrigation will not be needed. After the deduction of crop water demand from ASW, if the ASW is still greater than its field wa-ter-holding capacity, the leakage to groundwater will occur. If the ASW is less than the crop water demand in month i, whether or not to irrigate is determined by the capacity of irrigation at that time. If the crop is irrigated, the water balance in the top 2-m soil will be calculated again. The irrigation amount in one time is set to be 60 mm (600 m3 ha–1).
The area of irrigable land is calculated by multiply-ing the well number with its irrigation capacity. So, the volume of irrigation water can be calculated with the information of irrigation schedule and the area of irrigable land.
The Cobb-Douglas production function, which has been used successfully in the analysis of input and out-put in various fields (Huang and Li, 2003; Xiao and Wang, 2004), is applied to simulate the yield of winter wheat and summer maize. Five factors were used in the construction of the crop yield simulation function. They were total evapotranspiration of the crop (TEC), fertil-izer, crop variety, drought index and policy. Among these factors, variety, drought index and policy are dummy variables.
TEC of winter wheat and summer maize is the sum-mation of crop ET in its growing seasons. The amount of fertilizer (FERT) used by winter wheat and summer maize in history were obtained from statistic data of the Luancheng County. According to the historic informa-tion about crop variety (CV) it will add 1 after one change of crop variety. The crop drought index (DI) is calculated by equation 2.
∑
1 =/
=
N
I
ni
ri
ET
ET
DI
(2)where: ETniand ETriare water demand and actual ET of crop in month i, respectively (mm). Policy variable (PV) is set to 3 categories (0, 1 and 2) to represent 3 kinds of policies in the history of China. 0 and 1 represent the policy before and after the introduction of the house-hold contract responsibility system, respectively. And policy variable 2 represents the stages with the mistake in policy, such as the institutional revolution.
Using the historical statistic data from the Luancheng County and other modeling efforts, the simulation equa-tion of crop yield is determined by regression:
( CV PV DI)
FERT TEC
at
Yieldofwhe 3.947372 0.098734 0.021272 0.178035* +0.326137* -0.07507* e
e =
(R2 = 0.89, p < 0.01) (3)
( CV PV DI)
FERT TEC
ze
Yieldofmai 4.004545 0.087552 0.059955 0.159154* +0.159154* -0.06418* e
e =
(R2 = 0.94, p < 0.05) (4)
Agricultural planting structure (APS) is the variety and area of a crop in one region. The evolution of ASP in the Luancheng County can be divided into two stages: before and after the introduction of the household
con-tract responsibility system in 1981. The main objective of agriculture is to meet peoples’ food demand at the first stage. By the end of 1970s, the issue of food supply had been resolved and more and more cash crops were planted. At the first stage, the main factors influencing the ASP are grain yield of the last year, self-support area of grain, and grain variety. Self-support area of grain is the grain planting area to meet the need of food, and is the threshold of food security:
GAPC - FDP * NP / YIELD (5)
where: GAPC is self-support grain area (ha); FDP is food demand per capital (kg); NP is the total number of popu-lation; YIELD is the crop yield (kg ha–1). Simulation equa-tion of the winter wheat planting area at the first stage is shown as below:
AWHEAT = 2.71824.55GAPC0.25254YIELD0.3737VWHEAT 0.3874 (R2 = 0.92, p < 0.01) (6)
where: AWHEAT is the area of wheat (ha); VWHEAT is the variety of wheat. The planting schedule is domi-nated by the rotation of winter wheat and summer maize. The increase of the winter wheat area will cause the in-crease of the summer maize area simultaneously. Ac-cording to this relationship, planting area of the sum-mer maize can be estimated.
At the second stage, all the arable land is irrigable. Due to the rural labor transfer, labor-intensive crops, such as vegetables, cotton and so on, were not suitable for these families. What they are able to plant are win-ter wheat and summer maize which need little invest-ment of work force. In addition, our investigation re-vealed that the increase in agricultural cost dominated by the irrigation fee can promote the planting of cash crops in families without labor force transfer. Cash crops area can be estimated by equation 7:
y = 0.0429e0.029x (R2 = 0.9927, p < 0.01) (7)
where: y is the ratio of cash crops (%); x is the ground-water level (m). Combined with the population data, APS at the second stage can be calculated.
Rural labor force transfer is an important factor de-termining the cultivated crop area. According to the in-vestigation, arable land per capita, level of mechaniza-tion and urbanizamechaniza-tion, and the difference between the average expense and agricultural income were selected to simulate the rural labor force transfer. The equations are as following:
Y1 = 7.6117x1 + 1.0176 (R2 = 0.97, p < 0.01) (8)
Y2 = 0.0497e2.0484x2 (R2 = 0.99, p < 0.01) (9)
Y3 = 0.2442ln(x3) + 1.0115 (R2 = 0.98, p < 0.01) (10)
Y4 = 0.24e0.0004x4 (R2 = 0.76, p < 0.05) (11)
mechanization, level of urbanization and the difference between the average expense and agricultural income respectively; Y1, Y2, Y3 and Y4 are the ratios of rural la-bor force transfer calculated by each equation. Using the value of R2 as their weight, we integrated all the factors into Equation 12:
Y = (0.262Y1 + 0.267Y2 + 0.265Y3 + 0.206Y4) (R2 = 0.93,
p < 0.05) (12)
where: Y is the ratio of rural labor transfer calculated by four factors (%).
Agriculture is an important source of farmer’s in-come. However, due to the price fluctuation of grain and agricultural materials, it is difficult to measure and com-pare the change of agricultural profitability. For this rea-son, agricultural input and output are calculated accord-ing to the current market price. Labor investment is not included in the model. The inputs include irrigation, mechanization, pesticides, fertilizers, and crop varieties renewal. The outputs are grain yields only.
The cost of irrigation is dominated by the ground-water level. Survey data of irrigation costs in different groundwater levels was used to develop the relationship between irrigation water cost and groundwater level:
IC = 0.008WL + 0.0255 (R2 = 0.99,
p < 0.01) (13)
where: IC is irrigation water cost (Dollar m–3);
WL is the groundwater level (m). Inputs for pesticide, fertilizer and crop variety were obtained from Luancheng County an-nals and current market investigation.
To calibrate the model, the simulated monthly wheat yield, maize yield, wheat area, maize area, groundwa-ter table, and rural labor forces were compared with the observed data. When the calibrated dynamic system model was deemed to be good enough with determina-tion coefficient higher than 0.88, another two scenarios were designed to explore the sensitivity of winter wheat irrigation in the agricultural systems. The base scenario is keeping the irrigation schedule as today’s. The other scenario is to change the irrigation schedule of the win-ter wheat according to the ground wawin-ter level.
For the simulation of the two scenarios, the time of the model was expanded to 2100. Meteorological data of each month for the model from 2001 to 2100 were the mean values calculated using those of 1991 to 2000, re-spectively. The resilient analysis was conducted for both historical periods (1950-2000) and future period (2001-2100).
Results and Discussion
The model starts in 1950 and is designed on a monthly basis. The computed monthly groundwater level have a good agreement with the observed data (R2 = 0.98,
p < 0.01) - Figure 3. The groundwater level had been declining since 1960s with the application of drilled wells. At the same time, the groundwater level fluctuated with the annual rainfall and higher rainfall can raise the groundwater level.
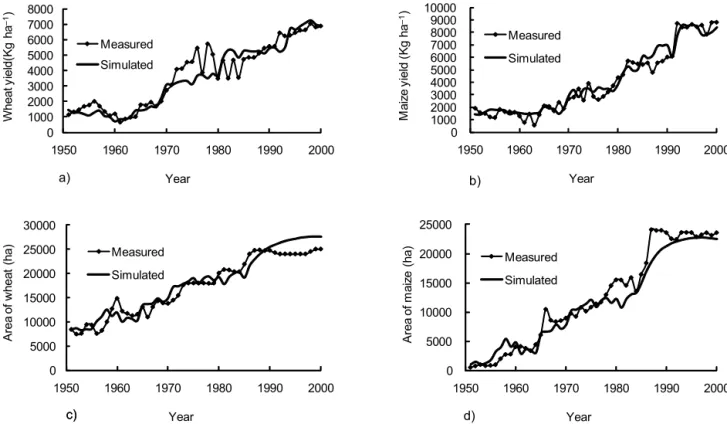
The simulation results of area and yield for winter wheat and summer maize are shown in Figure 4. Tends of simulation results are consistent with those of histori-cal data. The histori-calculated determination coefficients for wheat yield, maize yield, wheat area, and maize area, were 0.89, 0.95, 0.92, and 0.96, which indicated that the mathematical model has explained the majority of the variations in the observed data. There is an obvious de-crease and inde-crease of yields near 1960 and 1980, respec-tively. The decrease in 1960 was caused by natural di-sasters which took place during the period 1959 to 1961, and the increase in 1980 was caused by the policy, the introduction of the household contract responsibility system in 1981. The simulation results of the summer maize plant area were influenced by the area of winter wheat and were in good agreement with observed data.
The rural labor force transfer is a very complex issue (Hu, 2007). Generally, the model represented the histori-cal trend of rural labor force transfer, with the histori- calcula-tion of a determinacalcula-tion coefficient of 0.93 (Figure 5). The high fit could be the result of using aggregated data.
Due to the lack of observed data, the agricultural prof-itability was not calibrated. The simulated wheat and summer maize profits are shown in Figure 6. The in-crease of profit was caused by the continuous improve-ment of agricultural production conditions as improve-mentioned before. In NCP, the growing season of summer maize coincides with the rain season. A small amount of irri-gation can meet the water demand of summer maize. Therefore, the irrigation cost of the summer maize is much lower than that of winter wheat. This resulted in a higher income of the summer maize. In 1980, the Luancheng County was set as the base of grains (Lv et al., 1996) by the Government of the Hebei Province. The amount of wheat sold by per capita in Luancheng County has reached the peak in the Hebei Province for many years since 1980 (http://www.agri.com.cn/maps/ agri_com_cn_small_map_130124.html). The amount of wheat per capita rose to 260 kg in 1980, and then in-creased year by year until reaching 300-400 kg per capita, which matched the historical record (Figure 6).
Figure 3 – Simulated and measured groundwater levels and precipitation in the Luancheng County.*Significant of groundwater levels simulation is at 1%.
0 200 400 600 800 1000
0 10 20 30 40 50
1950 1970 1990
A
n
n
u
a
l r
a
in
fa
ll
(m
m
)
G
ro
u
n
d
wa
te
r le
v
e
ls
(
m
)
Year
According to the description about adaptive cycle (Walker and Salt, 2006), the agricultural systems of the Luancheng County went through a rapid growth phase from 1950 to 2000. They made use of a variety of avail-able resources and gained rapid development. At the be-ginning of this period, agricultural systems are relatively independent, closed and weakly interconnected with other systems. Resources that were available for agricul-ture were abundant, such as cultivated land resources, water resources, labor resources and so on. As the early pioneer species in ecosystems, although with low pro-duction capacity, agricultural systems were unaffected by all types of resources and with a large room for
de-velopment. Due to the lack of development and accu-mulation, agricultural profitability and food production were low and agricultural systems are still weak. This made the resilience of agricultural systems to stay in a low state.
External disturbances can make them degrade eas-ily. For example, in the three-year natural disasters hap-pened during 1959 to 1961, the grain production de-creased considerably, and hunger made many people starve to death. Two kinds of resilience, which can make the agricultural systems degrade and develop, were in the state of confrontation. During this period, each kind of agricultural material invested in croplands, such Figure 6 – Simulation for the profit of wheat and maize plantation and the wheat occupied by per capita.
0 100 200 300 400 500 600 0 1000 2000 3000 4000 5000 6000 7000 8000 9000
1950 1960 1970 1980 1990 2000
Whea oc c u pied by p e r c api ta ( K g) P rof it o f w he at & m ai z e ( Y uan ha –1 ) Year Profit of wheat
Profit of maize
Wheat occupied by per capital
Figure 5 – Rural labor transfer simulation. *Significant at 1%. 0.00
0.10 0.20 0.30 0.40
1985 1990 1995 2000
R u ra l l a b o r tr a n sf e r ra ti o Year Measured Simulated
Figure 4 – Comparison of measured and simulated wheat/maize yield and plantation area. *Significances of (a), (b), (c) and (d) are all at 1%. 0 1000 2000 3000 4000 5000 6000 7000 8000
1950 1960 1970 1980 1990 2000
W heat y ie ld (Kg h a –1 ) Year Measured Simulated a) 0 1000 2000 3000 4000 5000 6000 7000 8000 9000 10000
1950 1960 1970 1980 1990 2000
M a iz e y iel d ( K g ha –1 ) Year Measured Simulated b) 0 5000 10000 15000 20000 25000 30000
1950 1960 1970 1980 1990 2000
A rea o f w h ea t (h a) Year Measured Simulated c) c) 0 5000 10000 15000 20000 25000
1950 1960 1970 1980 1990 2000
as fertilizer, irrigation, pesticide and so on, had positive marginal utility to agricultural profitability. This stimu-lated farmers to invest more agricultural material for more income. Agricultural systems were no longer a closed system. The connections with chemical, mechani-cal, electrical and other systems are increasingly strength-ened. This led to the progressive realization of agricul-tural modernization.
With the accumulation of material and technology, resilience of agricultural systems was increased gradu-ally. This was reflected by the significant increase of grain yield and agricultural profitability. The ability of agricultural systems to resist disturbance, such as natu-ral disasters and price fluctuations, is enhanced. How-ever, the development of agricultural systems also brought some gradually-increasing constraints to itself, such as the depletion of water resources, population growth, rural labor transfer, reduction of arable land and the dependence on fertilizer, pesticides, and so on, which will undermine the resilience for the agricultural sys-tems to develop continually in the future. Fluctuations in the slow growth of agricultural profitability and grain yield at the end of this period mean the incrementally coming of a conservation phase.
To explore the possible future dynamic change of system behaviors, a base scenario that all model param-eters remain unchanged, such as crop irrigation
sched-ule, increase rate of population (4‰ in 2000), price of all material, was proposed. The time of the model was expanded to 2100. The other scenario (scenario 1) is to change the irrigation schedule of winter wheat accord-ing to the ground water level. The groundwater table is continually declining at the rate of 1 m year–1 (Figure 7). This will lead to the increase of the irrigation fee rap-idly as shown in Figure 7. Farmers will have no profit if they continue to plant wheat in 2081 as the model simulates. Meteorological data in this scenario are good for the growth of summer maize in terms of water. The water demand of summer maize can be met by precipi-tation only. Therefore, the income of summer maize will not change in the future.
Self-support area and planting area of wheat are in-dexes for the threshold and actual state of food security respectively. The planting area of wheat was greater than the self-support area since 1985 (Figure 7). However, the increase of population required more self-support area of wheat to ensure the food supply and more arable lands to meet the housing demand, which will elevate the threshold of food security. All these factors make the supply of food fall short of demands in 2070. With the increase of the irrigation fee, farmers will plant more cash crops for more income (Figure 7). With the de-crease in agricultural profitability, more and more la-bor will transfer out of the agricultural industry. The high ratio of rural labor transfer leaves fewer and fewer farmers to plant cash crops. Cash crop planting area has a turning point in 2070 and will decrease year by year after 2070.
From the point of view of profitability, the area of wheat should be zero when the profit of wheat be-comes zero. The crop schedule dominated by winter wheat and summer maize will change to summer maize only. If this situation comes true, Luancheng will have to import grains for local residents instead of serving as a food base for China. However, the situ-ation in the base scenario is not going to happen in the future. An investigation conducted in the Luancheng County showed that farmers will decrease the times of irrigation with the decline of ground wa-ter (Figure 8).
Figure 7 – System behavior under the base scenario.
-5000 -2500 0 2500 5000 7500 10000 -100 -60 -20 20 60
1950 1975 2000 2025 2050 2075 2100
P ro fit o f w h ea t & m a iz e ( Y u a n h a –1 ) G rou nd w at e r l ev el ( m ) Year
Groundwater level Profit of wheat Profit of maize
0 20000 40000 60000 80000 100000 120000 140000
1950 1975 2000 2025 2050 2075 2100
Wh ea t ar e a ( h a ) Year Self-support area Planting area 0 2000 4000 6000 8000 10000 12000 0 2000 4000 6000 8000 10000 12000 14000 16000
1950 1975 2000 2025 2050 2075 2100 Irri
g at io n f e e of w he at ( Y ua n h a –1 ) C a sh c rop s a re a ( h a) Year Cash crop area
Irrigation fee of wheat
Figure 8 – Farmers’ inclination of wheat irrigation according to the groundwater levels. *Significant at 1%.
y = 0.0002x2- 0.0716x + 5.8496
R² = 0.9388
0 1 2 3 4 5
0 30 60 90 120 150
Ir ri g a tio n t im e s o f w h e a t
Scenario 1 with the only change of crop irrigation schedule was investigated. The agricultural systems be-haviors simulated by the model are shown in Figure 9. The status of scenario 1 is more desirable than that of the base scenario. The declining rate of groundwater level is approximately 0.52 m year–1 and is much lower than 1 m year–1 at present. With the decrease of irriga-tion, the yield of winter wheat and the rate of increase in the cost of irrigation are reduced. The profit of wheat planting still exists at the end of scenario 1. This will be of great importance for the food security. The period with wheat planting area greater than self-support wheat area is prolonged to 2100. Duration of food security in scenario 1 is 30 years longer than that of the base sce-nario. In scenario 1, the cash crop area increases con-tinuously from 2001 to 2100 as shown in Figure 9. This means that the agricultural environment is suitable for cash crop planting, and farmers can earn more money after the adjustment of APS.
With the development of agriculture, limiting factors to agricultural systems are increased and the state of ag-ricultural systems changed to a conservation phase. The increase in population requires more and more self-sup-port wheat area to meet the food demand (Figures 7 and 9). The decrease in the difference between self-support wheat area and actual wheat planting area weaken the
resilience of food security. The increase of agricultural cost undermines the profit of wheat planting. The wheat planting will be terminated once the cost of wheat pro-duction excesses the income of wheat. Irrigation agricul-ture will change to rain-fed agriculagricul-ture. This means the disappearance of food security. Subsidy for grain plant-ing was introduced by the Government of China to pro-mote the food security. By subsidizing to maintain the system is a characteristic of the conservation phase (Walker and Salt, 2006).
The longer the system is maintained in the conser-vation phase, the lower the resilience of the system will be. Through the simulation, we may find that a slight disturbance, such as markup of agricultural material, in-crease of irrigation due to drought, cut of wheat price, can make the planting of wheat unprofitable in the fu-ture. A little reduction of wheat yield will make it hard to meet the food demand of people. Meanwhile, the in-crease of agricultural cost and rural labor transfer reduce the farmers’ option to plant cash crops for more profit. Like the biodiversity in ecosystems is important for se-curing multifunctionality as well as resilience (Gordon et al., 2010), the disappearance of this kind of option is an indication of the decrease in resilience also.
The household contract responsibility system, cre-ated in 1953 and introduced all over the China, is a kind of the farmers’ self-organization. This policy has pro-moted the development of Chinese agriculture greatly (Long, 2003). However, the policy is unsuitable for the modern agriculture at present due to its small-scale pro-duction (Yin, 2001). The self-organizing ability of the sys-tem determines its capacity to respond to the stresses and shocks (Folke et al., 2007).The farmers who trans-fer to cities lend their lands to the local farmers in the past years. This makes it convenient for the implement of agricultural modernization. Land per capita is less than 0.1 ha in the Luancheng County at present and will be less in the future with the increase of population. By land circulation, it will be possible for the farmers with large land to buy agricultural machines. This will de-crease the cost of agricultural production and enhance the resilience of agricultural profitability.
The capacity to learn and adapt is very important to the systems coupled with the social system. By these ca-pacities, agricultural modernization techniques includ-ing mechanization, irrigation, chemical fertilizers, and farm chemicals and so on were implemented. This en-hanced the agricultural resilience to obtain development. However, people do not know all of nature. The un-known part will impair the resilience of system. There are two broken lines with “?” in Figure 2: one is the feed-back from groundwater level to irrigation; the other is from the agricultural material price to the agricultural modernization. Farmers only know how to increase yield by more investment, but do not know how to de-crease cost when the price of agricultural material is too high. With the increase of the irrigation fee, what farm-ers can do is to reduce the number of irrigations. To cope Figure 9 – System behavior under the scenario with the change
of irrigation schedule.
0 1000 2000 3000 4000 5000 6000 -30 -20 -10 0 10 20 30 40 50
1950 1975 2000 2025 2050 2075 2100
P ro fi t o f w he a t (Y ua n ha –1 ) G rou ndw a te r t ab le (m ) Year
Groundwater table Profit of wheat
0 1000 2000 3000 4000 5000 6000 7000 8000 0 20000 40000 60000 80000 100000 120000 140000
1950 1975 2000 2025 2050 2075 2100
Wh e a t y ie ld (K g ha –1) W h eat a re a ( h a ) Year
Self-support area Plant area Wheat yield
0 200 400 600 800 1000 1200 1400 0 1000 2000 3000 4000 5000 6000
1950 1975 2000 2025 2050 2075 2100 Irriga
tion f ee o f w hea t ( Y ua n ha –1 ) C a sh c rop ar e a ( ha) Year
with the markup of agricultural material, no measures can be put into practice due to the concerns of reduc-tion in crop yield. Under this circumstance, the absence of necessary feedbacks will decrease the resilience of agricultural systems. For the lack of ability in the learn-ing of new agricultural production techniques, some new technologies, such as precision agriculture, water-saving irrigation and soil testing and fertilizer recom-mendations, cannot be introduced widely. Agricultural resilience is undermined.
According to the theory of the adaptive cycle, the agricultural systems of the Luancheng County, in the conservation phase at present, have three kinds of pos-sible future: rapid growth and exploitation, collapse or release and reorganization. Clever managers often engi-neer this cycle in order to prevent a large collapse at the late conservation phase. That is, they avoid a release phase at the scale of concern (the whole agricultural sys-tems) by generating release and reorganization phases at lower scales thereby preventing the development of a late conservation phase at the scale of concern (Walker and Salt, 2006). Resilience-based system stewardship is a fundamental shift from steady-state resource manage-ment, which attempted to reduce variability and prevent change, rather than to respond to and shape change in ways that benefit society (Chapin III et al., 2009). There-fore, the agricultural systems should be reorganized par-tially to enhance their resilience, e.g. improvements on the agricultural techniques and establishment of train-ing organizations.
Conclusions
Investments in agriculture enhanced the resilience of agricultural activities at the beginning phase. However, with the degradation of resources, especially water re-sources, the cost of agricultural production is too high to gain profit for wheat planting. The resilience of agri-cultural income is decreased gradually. The rise in popu-lation requires more self-support area of grain to meet the demand of food, which decrease the resilience of food security. The Luancheng County is at the phase of conservation, in the adaptive cycle at present. To en-hance the resilience of the agricultural systems, partial adjustment should be introduced in the system to avoid its total breakdown..
Acknowledgements
To the Natural Science Foundation Committee (40971025), the financial support of the Knowledge In-novation Program of Chinese Academy of Sciences (KZCX2-YW-449) and National Science and Technology Supporting Project (2006BAD17B05).
References
Bennett, E.M.; Cumming, G.S.; Peterson G.D. 2005. A systems model approach to determining resilience surrogates for case studies. Ecosystems 8: 945-957.
Brown, L.R.; Halweil, B. 1998. China’s water shortage could shake world food security. World Watch 11: 14-16.
Carpenter, S.; Walker, B.; Anderies, J.M.; Abel, N. 2001. From metaphor to measurement: resilience of what to what?. Ecosystems 4: 765-781.
Chapin III, F.S.; Folke, C.; Kofinas, G.P. 2009. p. 3-28. In: A framework for understanding change. In principl es of ecosystem stewardship: resilience-based natural resource management in a changing world. Springer Verlag, New York, NY, USA.
Chen, Y. 1999 . Ana lysi s f or th e chan g e in th e pl ant in g production pattern in China. Agricultural Information Study 5: 1-5.
Chen, Y. 1995. p. 225. In: Water demand and irrigation for main crop in China. Water and Electricity Publishing, Beijing, China. (in Chinese).
Cheng, W.; Hu, C.; Zhang, X. 1994. p.158. In: Study on evaporation of field and water used by crops. Weather Publishing, Beijing, China. (in Chinese).
Folke, C.; Pritchard, L.; Berkes, F.; Colding, J.; Svedin, U. 2007. The problem of fit between ecosystems and institutions: ten years later. Ecology and Society. 12: 30. Available at: http:// www.ecologyandsociety.org/vol12/iss1/art30/. [Accessed Dec. 21, 2008].
Fu, Q.; Jin, L.; Liang, C. 2002. Application of projection pursuit model to optimize paddy irrigation schedule. Journal of Hydraulic Engineering 10: 39-45. (in Chinese).
Gordon, L.J.; Finlayson, C.M.; Falkenmark, M. 2010. Managing water in agriculture for food production and other ecosystem services. Agricultural Water Management 97: 512-519. Holling, C.S. 1973. Resilience and stability of ecological systems.
Annual Review of Ecology and Systematics 4: 1-23.
Holling, C.S.; Meffe, G.K. 1996. Command and control and the pathology of natural resource management. Conservation Biology 10: 328-337.
Hu, F. 2007. Review about the rural labor transfer research in China. Zhejiang Social Sciences 1: 207-212. (in Chinese). Huang, J.; Li, N. 2003. China’s agricultural policy simulation
an d projec tion mod el-CAPSIM. Jour nal of N anji ng Agricultural University (social science edition) 3: 30-41. (in Chinese).
Huang, T.; Lei, Y.; Zheng, L. 2006. Spatial variation simulation of lateral potential of groundwater in piedmont region. Water Resources Protection 22: 16-19. (in Chinese).
Jia, J.; Tian, B.; Liu, C. 2003. Visual MODFLOW and its application on groundwater simulation: a case study on Luancheng county if Hebei Province. Journal of Agricultural University of Hebei 26: 71-78. (in Chinese).
Luancheng County Annals, 1995. Committee of Luancheng County Annals. Beijing, China. (in Chinese).
Liu, C.; Zhang X.; Zhang Y. 2002. Determination of daily evaporation and evapotranspiration of winter wheat and maize by large-scale weighing lysimeter and micro-lysimeter. Agricultural and Forest Meteorology 111: 109-120.
Liu, X.; Li, Y.; Wang, Q. 2006. Evaluation on several temprature-based methods for estimating reference crop evapotranspiration. Transaction of the Chinese Society Agricultural Engineering 22: 12-18. (in Chinese).
Long, J. 2003. China’s local organizing-process and countryside governance: microscopic analysis of the development of China’s politics. Journal of Shanghai Normal University 32: 18-22. (in Chinese).
Lu, Y.; Wu, Y.; Wang, J. 2003. The type of underground water pollution by drilling engineering and its control countermeasures. Henan Science 21: 357-360. (in Chinese). Lv, F.; Wang, S.; You, M. 1996. Problems in agricultural
Walker, B.; Carpenter, S.; Anderies, J.; Abel, N.; Cumming, G.S.; Janssen, M.; Lebel, L.; Norberg. J.; Peterson, G.D.; Pritchard, R. 2002. Resilience management in social-ecological systems: a working hypothesis for a participatory approach. Con servati o n Ecology 6: 14. Available at: http:// www.consecol.org/vol6/iss1/art14. [Accessed Nov. 10, 2008]. Walker, B.; Salt, D. 2006. p. 212. In: Resilience thinking: sustaining
ecosystems and people in a changing world. Island Press, Washington, DC, USA.
Wang, H.; Zhang, L.; Dawes, W.R.; Liu, C. 2001. Improving water use efficiency of irrigated crops in the North China Plain: measurements and modeling. Agricultural Water Management 48: 151-167.
Wang, H.; Lou, H.; Zou, L. 2003. The application of Modflow software in the simulation for the underground reservoir of Huabei Plain. Global Geology 22: 69-72 (in Chinese). Xiao, H.; Wang, J. 2004. Analysis on influencing factors of China’s
grain production. Journal of Agricultural Economics 6: 45-49. (in Chinese).
Yang, Y.; Watanabe, M.; Zhang, X.; Zhang, J.; Wang, Q.; Hayashi, S. 2006. Optimizing irrigation management for wheat to reduce groundwater depletion in the piedmont region of the Taihang Mountains in the North China Plain. Agricultural Water Management 82: 25-44.
Yin, C. 2001. Industrialization of agriculture is an important way to improve its competition power. Problems of Agricultural Economy 2: 2-7. (in Chinese).
Zhang, X.; You, M. 1996. Dynamics of soil-water content and water-saving potential in the farmland of Taihang piedmont. Ecological Agriculture Research 4: 63-68. (in Chinese). Zhang, X.; Pei, D.; Hu, C. 2002. Index system for irrigation
scheduling of winter wheat and maize in the piedmont of Taihang. Transaction of the Chinese Society Agricultural Engineering 18: 36-41. (in Chinese).