http://dx.doi.org/10.1590/2318-0331.011616021
RBRH, Porto Alegre, v. 21, n. 3, p. 570-575, jul./set. 2016 Scientiic/Technical Article
Evaporation from Camargos hydropower plant reservoir: water footprint
characterization
Evaporação do reservatório da usina hidrelétrica de Camargos: caracterização da pegada hídrica
Eduardo de Oliveira Bueno1, Carlos Rogério de Mello1 and Geovane Junqueira Alves1
1Universidade Federal de Lavras, Lavras, MG, Brazil
E-mails: [email protected] (EOB), [email protected] (CRM), [email protected] (GJA)
Received: February 05, 2016 - Revised: April 04, 2016 - Accepted: April 13, 2016
ABSTRACT
In recent years, a relevant debate has been raised by a question related to if the hydropower plants indeed represent a non-consumptive use of water resources. In this context, this work was developed at the Camargos Hydropower Plant reservoir, Grande river basin, southern Minas Gerais state, aiming to estimate evaporation rates, which allow the characterization of the Water Footprint in this facility,
between the years of 2010 and 2014. Evaporation rates were estimated based on Linacre, Penman and Penman-Monteith methods. Regarding the distribution of evaporation throughout the year, all methods showed the same seasonal pattern, consistent with the meteorological elements behavior that inluence this physical process. Although an annual average evaporation considered normal for
the studied region (1329 mm) and a small reservoir area (64 km2), this hydropower plant has presented low electric energy production
as it is an old facility (more than 50 years) and has low installed capacity. Therefore, Camargos Hydropower Plant has presented, by all methods, a high Water Footprint (130 m3.GJ–1 on average) compared to estimates for other hydropower plants in Brazil and worldwide.
Keywords: Evaporation; Hydroelectric; Water footprint.
RESUMO
Nos últimos anos, um debate relevante tem ocorrido provocado pelo questionamento se as usinas hidrelétricas são de fato de uso não consuntivo dos recursos hídricos. Neste contexto, foi desenvolvido um estudo no reservatório da usina hidrelétrica de Camargos, rio Grande - Minas Gerais, com o objetivo de estimar as taxas de evaporação e caracterizar a pegada hídrica desta usina para o período
de 2010 a 2014. A evaporação foi estimada pelos métodos de Linacre, Penman e Penman-Monteith. Em relação à distribuição da
evaporação ao longo do ano, todos os métodos apresentaram o mesmo padrão sazonal, condizente com o comportamento das variáveis
meteorológicas que inluenciam o processo. Apesar de uma evaporação anual média (1329 mm.ano–1) e da pequena área do reservatório
(64 km2), por se tratar de um aproveitamento antigo (mais de 50 anos) e com baixa potência instalada, a geração da usina hidrelétrica de
Camargos é pequena, resultando, para todos os métodos avaliados, em uma pegada hídrica elevada (média de 130 m3.GJ–1), comparada as estimativas indicadas na literatura para outras usinas hidrelétricas no Brasil e no mundo.
INTRODUCTION
In recent years, due to the increase scarcity of water resources, an important debate has been triggered by questioning whether the use of water resources by hydroelectric plants is in fact non-consumptive. This issue has been linked to the concept
of water footprint (WFP), which is deined as the total volume
of water used directly or indirectly in the production of a unit of goods and services (HOEKSTRA et al., 2011).
For hydroelectric generation, WFP quantiication can be
carried out based on the relationship between evaporation from reservoirs and electric energy produced in a given period, since
the higher the WFP the lower the water resource use eficiency.
The hydropower water footprint is function of evaporation from the reservoirs, which means the higher this process the larger the water footprint. Therefore, it depends on the size (surface area) of the reservoir and climatic conditions (especially solar
radiation, wind velocity and air temperature) that directly inluence
evaporation. On the other hand, WFP is inversely related to the electric energy production by the facilities, that is, the lesser the energy produced, the larger the water footprint. Thus, there is a
direct dependency of installed capacity, turbine eficiency and
market demand.
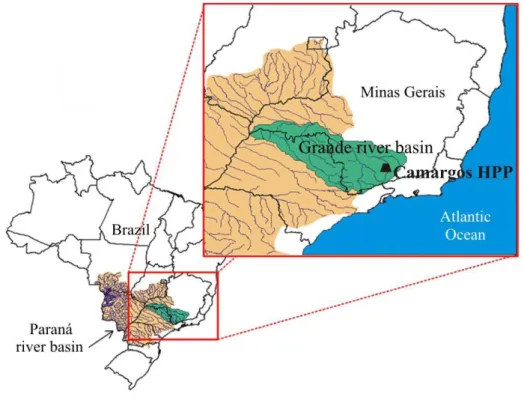
In this context, we developed a WFP study for the Camargos Hydropower Plant (HPP), which is the most upstream facility located in the Upper Grande river basin, southern Minas Gerais state, using meteorological data obtained directly from the site
as well as Camargos operational data for a period of ive years (2010-2014).
The aim was to estimate evaporation rates using different meteorological methods and characterize the WFP of the Camargos
HPP, based on the electric energy production, comparing the results against those indicated for other plants in Brazil and in the world.
MATERIAL AND METHODS
Study area characterization
The study area involves Camargos HPP reservoir, whose
dam has 37 meters high and is located in the Grande River at the coordinates of 21°20’S and 44°37’W in the municipality of
Itutinga, Minas Gerais state, Brazil. It is important to highlight that Grande river basin is one the most important Brazilian basin for
electric energy production, encompassing 14 facilities throughout
the river (VIOLA et al., 2014).
The climate of the region, according to Köppen classiication,
is Cwa, which means a temperate climate, with mild and humid summers and cold and dry winters, with mean annual rainfall of 1500 mm (MELLO et al., 2012).
In addition, Camargos HPP reservoir is the most upstream project on the Grande river basin (Figure 1), with a contributing area of 6228 km2. Its reservoir has a useful volume of 792 hm3, with normal water operating level at an elevation of 910 m, an
average depth of 8 m and normal water surface of 64 km2.
Electric power generation data from Camargos HPP
The Camargos HPP has an installed capacity of
46 MW, however, since it is a plant with more than 50 years
of operation, its current capacity is low. The average power
generation in the studied period (2010 to 2014) was 19 MW,
which was inluenced by the historical drought that affected the region in 2014, implicating in a generation only about 6 MW for this year. Regarding the monthly distribution of the
electric energy production, Camargos HPP has increased its production capacity from mid-November, taking the peak in
January and then, decreasing gradually until reaching a minimum in the irst half of November. This behavior is mainly linked
to the market demand.
Meteorological data
The meteorological data used in this study were obtained by a Campbell weather station, called “Marcela”, located approximately 6 km to the north of Camargos HPP reservoir,
at geographic coordinates 21°16’S and 44o30’W and at 979 m
of altitude. The meteorological elements were automatically monitored every 30 min, storing the data on temperature and relative humidity, wind speed, solar radiation, and atmospheric pressure.
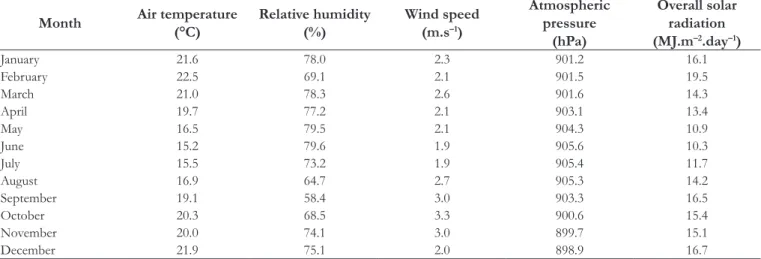
Table 1 shows the monthly average values for the period
2010-2014, when the average air temperature was 19.2 °C, relative
humidity 71.6%, wind speed 2.8 m.s–1 and the income solar
radiation of 14.5 MJ.m–2.day–1.
In 2014, air temperature, wind speed and solar radiation
were higher than the average from the previous years (2010 to 2013), whereas the relative humidity was the lowest of the studied period. This weather is associated with the historical drought
that affect the southeastern Brazil in the 2014, explained by the intensiication of South Atlantic Subtropical Anticyclone, with
reduction of the occurrence of South Atlantic Convergence Zone (SACZ) episodes over southeastern Brazil (COELHO;
CARDOSO; FIRPO, 2015).
Water footprint calculation method
The calculation of the water footprint for Camargos HPP was carried out annually based on the total evaporated estimated by the studied methods, and the total electric energy produced by the cited plant.
For Mekonnen and Hoekstra (2012), the water footprint (WFP), in m3.GJ–1, for hydroelectric generation can be obtained by the following expression:
E WFP
H
= (1)
Where E and H are, respectively, the annual evaporation (m3) and
electric energy production (GJ).
In addition to the annual estimate, the seasonal behavior of the WFP was also analyzed, verifying the months of the year in which it is more critical, since this depends on both weather conditions and market demand for electricity. To calculate the monthly water footprint, we considered the monthly average surface area (A) of the Camargos HPP reservoir, which ranged from 50 km2 (in December) to 65 km2 (in May), obtained based on daily water level readings (L) and the L × A reservoir curve.
According to Mekonnen and Hoekstra (2012), the volume of water used to calculate WFP is estimated based on only the evaporation from reservoirs, which means disregarding the consumption of water for operation of the plant (equipment cooling, washing of machines, use by employees and others),
admitting that these are insigniicant if compared to the volume
evaporated from reservoir.
Methodologies adopted for evaporation estimation
Direct estimates of evaporation from reservoirs, in adequate
both spatial and temporal scales, requires sophisticated and expensive devices, like those based on turbulent vortices (“Eddy Covariance”). Thus, theoretical methods, which are based on physical principles of evaporation and take into account weather elements, are mostly used as a plausible alternative.
Evaporation from Camargos HPP reservoir for the period
between 2010 and 2014 was estimated by the methods listed in
Table 2 with respective source.
It is important to highlight that we did not applied water budget technique to estimate evaporation from Camargos HPP
reservoir due to errors identiied in some of the variables which are inputs for this procedure, especially the inlows and outlows.
Table 1. Mean values (2010-2014) of the meteorological elements observed by “Marcela” weather station.
Month Air temperature (°C)
Relative humidity (%)
Wind speed (m.s–1)
Atmospheric pressure
(hPa)
Overall solar radiation (MJ.m–2.day–1)
January 21.6 78.0 2.3 901.2 16.1
February 22.5 69.1 2.1 901.5 19.5
March 21.0 78.3 2.6 901.6 14.3
April 19.7 77.2 2.1 903.1 13.4
May 16.5 79.5 2.1 904.3 10.9
June 15.2 79.6 1.9 905.6 10.3
July 15.5 73.2 1.9 905.4 11.7
August 16.9 64.7 2.7 905.3 14.2
September 19.1 58.4 3.0 903.3 16.5
October 20.3 68.5 3.3 900.6 15.4
November 20.0 74.1 3.0 899.7 15.1
RESULTS AND DISCUSSION
Evaporation from Camargos HPP reservoir between 2010 and 2014
Figure 2 shows the monthly Camargos HPP reservoir evaporation estimated based on the methods listed in Table 2.
At this time scale, all methods showed the same seasonal
evaporation pattern, with minimum daily rates estimated for June,
which presented the lowest values of both air temperature and solar radiation. Maximum rate values were calculated for the months from
December to February, which are characterized by the highest air
temperature and solar radiation
Table 3 presents the mean monthly evaporation values for Camargos HPP reservoir, estimated by the methods of Linacre, Penman and Penman-Monteith, which require local weather observations, and adopted by ONS (National Electric System Operator), which uses only average weather elements from Climatological Normal from 1961-1990 of the INMET stations for the location of interest
(ANDRIOLO; KAVISKI, 2005).
The evaporation distribution throughout the year showed quite similar pattern among the cited methods and is directly related
to the seasonal weather elements that strongly inluence the process.
The highest rates were estimated for the period from September to March (when normally the highest of both solar radiation and air temperature values are observed in the region) and for October due to stronger winds that are normally observed in southern Minas Gerais state.
Table 4 presents the annual evaporation from Camargos
HPP reservoir for the years between 2010 and 2014, obtained by
the studied methods, comparing against ONS method (ONS, 2004). The mean annual evaporation, calculating based on the studied
methods, was equivalent to 1329 mm.yr–1, which is greater than the potential evapotranspiration for the region (950 mm.year–1), according to Viola et al. (2015).
The annual evaporation in 2014 was the highest, regardless
of the meteorological method applied, except for ONS as it uses long-term averages from Climatological Normal. This result occurred as the meteorological methods taken into account the meteorological elements observed in situ (“Marcela” station), and these are associated to the anomalous climate period observed in the region (and in southeastern Brazil as a whole), which has been
classiied as the worst drought period ever recorded in the region
(COELHO; CARDOSO; FIRPO, 2015).
In 2014, average air temperature, wind speed and solar
radiation were much higher than the average of the previous years
Table 2. Equations for evaporation estimation from reservoirs and their most relevant features.
Method Equation Author Observations
Linacre ( ) ( )
700 Ta 0,006h 15 Ta Td 100
E
80 Ta
+ + −
−
= ϕ − (2) Linacre (1977)
Based on successive correlations found between meteorological elements and evaporation. Equation based only on latitude, altitude and air temperature.
Penman E=⋅∆ +RL f u es ea( )( − ) 1
∆ +
γ
γ λ (3) Penman (1948)
It has as a premise that variation of the heat stored in the reservoir equals zero. According to the author, its weight is low if compared to the other elements
(sensible heat lux and latent heat lux) that make up
the energy balance in the reservoir surface. Moreover,
the author adopts a simpliication considering that the
water surface temperature is equal to the temperature of the air adjacent layer, which means an isotherm condition.
Penman-Monteith w( L ) ( )( )
w
R G f u ew ea 1
E=⋅∆ − + −
∆ +
γ
γ λ (4) McJannet et al. (2008)
It uses the water temperature to estimate average depth and the portion (G) of varying heat stored in the reservoir. The water surface temperature can be estimated from the equilibrium temperature concept. In the term that is representative of the mass transfer process, the aerodynamic function is determined based on the reservoir area and wind speed.
Where: E – evaporation (mm.day-1); Ta – average air temperature (°C); h – elevation (m.); φ – latitude (decimal degrees); Td – dew point temperature (°C); λ – latent
heat of vaporization (MJ.kg-1); Δ – slope of the saturation pressure curve of water vapor in the air at the air temperature (kPa.°C–1); R
L – net radiation (MJ.m –2.day–1);
f (u) – aerodynamic function (MJ.m–2.day–1.kPa–1); es – saturation pressure of vapor water in the air at the air temperature (kPa); ea – the partial pressure of water
vapor in the air at the air temperature (kPa); γ – psychometric constant (kPa.°C–1); Δw – slope of the saturation pressure curve of water vapor in the air at the water
temperature (kPa.°C-1); G – variation of heat stored in the body of water (MJ.m–2.day–1); ew – saturated pressure of water vapor in the air at the water temperature (kPa).
Figure 2. Monthly evaporation from Camargos HPP reservoir
(2010 to 2013), while the relative humidity was the lowest from the studied period. In the case of the SisEvapo v2.0 Program (ONS method), which uses data from 1961-1990 Climatological Normal, the mean annual evaporation was strongly underestimated, returning a biased WFP.
Water footprint characterization for Camargos HPP
Table 5 presents the average water footprint (WFP) results for Camargos HPP estimated based on evaporation obtained by Linacre, Penman, Penman-Monteith and ONS methods.
The average WFP of Camargos HPP, calculated based on
the studied methods, for the 2010-2014 period, was 130 m3.GJ–1,
exceeding the values speciied in the literature for other facilities in
Brazil and worldwide (GERBENS-LEENES; HOEKSTRA; MEER, 2009; MEKONNEN; HOEKSTRA, 2012; BAKKEN et al., 2013).
Gerbens-Leenes, Hoekstra and Meer (2009) estimated the global average water footprint of hydroelectric plants at 22 m3.GJ–1, while Bakken et al. (2013) indicated an average of 18 m3.GJ–1.
According to Mekonnen and Hoekstra (2012), who studied 35 hydropower plant reservoirs around the world, under different climatic conditions, reservoir size and installed capacity, the global average water footprint for hydroelectric generation was estimated around 68 m3.GJ–1. This study included eight hydropower plants in Brazil (Sobradinho, Tucurui, Itaipu, São Simão, Marimbondo,
Itumbiara, Estreito and Jaguari), whose estimated average WFP was about 84 m3.GJ–1.
Because of the historical dry season, the average Camargos
HPP generation in 2014 was only about 6 MW. Besides that low power, evaporation during 2014, calculated by all methods (except
for ONS), was the highest for the period studied and much higher than the normal, as discussed before. Thus, the water footprint estimated for that year (272 m3.GJ–1) was much higher than for other years evaluated.
Figure 3 illustrates the WFP monthly distribution throughout
the year, obtained based on the studied methods. In June, due to lower
evaporation rates, WFP was low, reaching the minimum monthly value of 85 m3.GJ–1, considering the Penman method. Lower values
were also observed in January, which is characterized as the period
with the highest electric energy generation by Camargos HPP, thus
relecting in a greater water use eficiency. The largest WFP values
were obtained for August by Penman, Penman-Monteith and Linacre methods and in November by ONS, corresponding to the months with the lowest energy generation by Camargos HPP.
Table 3. Mean monthly Camargos HPP reservoir evaporation, obtained by Linacre, Penman, Penman-Monteith and ONS methods (SisEvapo v2.0 Program based on the 1961-1990 Climatological Normal).
Month
Monthly Evaporation (mm)
Linacre Penman
Penman-Monteith ONS
January 114 137 133 128
February 111 132 120 141
March 107 116 139 128
April 103 98 116 113
May 94 78 108 92
June 84 63 74 81
July 89 73 81 82
August 117 111 99 97
September 109 115 96 117
October 118 138 117 124
November 106 124 115 138
December 126 151 122 141
Total 1279 1336 1320 1382
Table 4. Annual evaporation of Camargos HPP reservoir between
2010 and 2014.
Year
Annual average evaporation (mm)
Linacre Penman
Penman-Monteith ONS
2010 1203 1240 1226
2011 1211 1126 1157
2012 1261 1373 1342
2013 1201 1235 1225
2014 1519 1706 1652
Average 1279 1336 1320 1382
Table 5. Water footprint (WFP) for the electric energy production
in the Camargos HPP between 2010 and 2014.
Month
Water Footprint - WFP (m3.GJ–1)
Linacre Penman
Penman-Monteith ONS
January 95 114 111 107
February 109 129 118 138
March 118 128 153 141
April 115 109 129 126
May 122 102 141 120
June 114 85 100 109
July 116 95 105 107
August 181 172 154 150
September 150 158 132 161
October 141 166 141 149
November 136 159 147 177
December 115 138 112 129
Average 125 131 129 135
CONCLUSIONS
• The temporal distribution of evaporation from Camargos HPP reservoir, by all methods considered in this study, showed the same seasonal pattern, consistent with the
meteorological elements behavior that inluence this process. • In terms of annual evaporation during the studied
period (2010-2014), the methods indicated an average
of 1329 mm.yr–1. However, the year of 2014 resulted in greater evaporation values due to a severe dry season that has affected the region. The evaporation adopted by the ONS method for Camargos HPP reservoir underestimates it as this method is based on Climatological Normal of INMET and does not able to capture temporal behavior
of the weather elements, like was observed for 2014. • The water footprint calculated for the Camargos HPP was
a result of the combination of meteorological elements and the pattern of the electric energy generation during the studied period. Because of the evaporation behavior and the size area of the reservoir, energy generation had a greater weight in the calculation of water footprint.
• The electric energy production by Camargos HPP for
the period studied (2010-2014) was low, resulting, by all
methods evaluated, in a high water footprint (average of 130 m3.GJ–1), compared to those values indicated in the literature for other hydroelectric plants in Brazil and even in the world. It was observed that during prolonged dry
periods, as in 2014, the water footprint was extremely high
(272 m3.GJ–1), making this plant highly ineficient, from a water use point of view.
ACKNOWLEDGEMENTS
To CAPES for the scholarship. To CNPq and FAPEMIG
for inancial support for the development of the project and to
CEMIG for providing research data.
REFERENCES
ANDRIOLO, M. V.; KAVISKI, E. Projeto HG-211: revisão,
atualização e aperfeiçoamento do sistema de avaliação líquida dos reservatórios do sistema interligado nacional: SisEvapo v2.0:
relatório final. Curitiba: CEHPAR, 2005.
BAKKEN, T. H.; KILLINGTVEIT, A.; ENGELAND, K.;
ALFREDSEN, K.; HARBY, A. Water consumption from hydropower
plants: review of published estimates and an assessment of the concept. Hydrology and Earth System Sciences, v. 17, p. 3983-4000, 2013.
COELHO, C. A. S.; CARDOSO, D. H. F.; FIRPO, M. A. F. Precipitation diagnostics of an exceptionally dry event in São Paulo, Brazil. Theoretical and Applied Climatology, p. 1-16, 2015.
FINEP – FINANCIADORA DE ESTUDOS E PROJETOS.
Previsão de afluência a reservatórios hidrelétricos: projeto FAURGS/
FINEP 40.04.0094.00. Brasília, 2007.
GERBENS-LEENES, P. W.; HOEKSTRA, A. Y.; MEER, T. H.
V. The water footprint of energy from biomass: a quantitative assessment and consequences of an increasing share of bio-energy in energy supply. Ecological Economics, v. 4, n. 68, p. 1052-1060, 2009.
HOEKSTRA, A. Y.; CHAPAGAIN, A. K.; ALDAYA, M. M.;
MEKONNEN, M. M. The water footprint assessment manual: setting the global standard. London: Earthscan, 2011.
LINACRE, E. T. A simple formula for estimating evaporation
rates in various climates, using temperature data alone. Agricultural Meteorology, v. 18, p. 409-424, 1977.
MCJANNET, D. L.; WEBSTER, I. T.; STENSON, M. P.; SHERMAN,
B. S. Estimating open water evaporation for the Murray-darling basin: a
report to the Australian government from the CSIRO Murray-Darling basin sustainable yields project. Melbourne: CSIRO, 2008.
MEKONNEN, M. M.; HOEKSTRA, A. Y. The blue water footprint of electricity from hydropower. Hydrology and Earth System Sciences, v. 16, p. 179-187, 2012.
MELLO, C. R.; NORTON, L. D.; CURI, N.; YANAGI, S. N. M. Sea surface temperature (SST) and rainfall erosivity in the Upper
Grande River Basin, Southeast Brazil. Ciência e Agrotecnologia, v.
36, p. 53-59, 2012.
ONS – OPERADOR NACIONAL DO SISTEMA ELÉTRICO.
Diretoria de Planejamento Programação da Operação. Evaporações
líquidas nas usinas hidrelétricas: ONS RE 3/214/2004. Brasília, 2004.
PENMAN, H. L. Natural evaporation from open water, bare soil and grass. Proceedings of the Royal Society of London. Series A, Mathematical and Physical Sciences, v. 193, n. 1032, p. 120-145, 1948.
VIOLA, M. R.; MELLO, C. R.; BESKOW, S.; NORTON, L. D. Impacts of land-use changes on the hydrology of the grande river basin headwaters, Southeastern Brazil. Water Resources Management,
v. 28, p. 1-14, 2014.
VIOLA, M. R.; MELLO, C. R.; CHOU, S. C.; YANAGI, S. N. M.; GOMES, J. L. Assessing climate change impacts on Upper
Grande River Basin hydrology, Southeast Brazil. International Journal
of Climatology, v. 35, p. 1054-1068, 2015.
Authors contributions
Eduardo de Oliveira Bueno: PhD student. Preparation of calculation spreadsheets, as pre-deined methodologies; the calculations;
analysis and presentation of results. Structuring and text editing.
Carlos Rogério de Mello: Leader. Project design; deinition of
methodologies; and interpretation of results. Translation and text completion.
Geovane Junqueira Alves: Master student. Installation and