ASSESSMENT OF DAILY ACTUAL EVAPOTRANSPIRATION WITH SEBAL AND S-SEBI
ALGORITHMS IN COTTON CROP
CARLOS ANTONIO COSTA DOS SANTOS, BERGSON GUEDES BEZERRA, BERNARDO BARBOSA
DA SILVA AND TANTRAVAHI VENKATA RAMANA RAO
Department of Atmospheric Science, Federal University of Campina Grande, Campina Grande, PB, Brazil
[email protected], [email protected]; [email protected]; [email protected]
Received May 2009 - Accepted February 2010
ABSTRACT
The main objective of this study is to assess the daily ET accuracy obtained by remote sensing algorithms in comparison with measurements in situ. The experiment was conducted in the State of Ceará, Brazil, in a cotton experimental ield of EMBRAPA using Bowen ratio measurements to obtain the energy balance components. SEBAL and S-SEBI algorithms were used with four TM Landsat – 5 images of 2005, in order to determine the actual evapotranspiration of cotton crop. The comparison between the estimated values by remote sensing algorithms and the measured values in situ showed that the methods (SEBAL and S-SEBI) presented satisfactory results. The S-SEBI algorithm is an important tool to be applied in ET analysis of semi-arid regions, due its practicability to solve the energy balance and its processing is simpler than SEBAL algorithm which needs the solution of an iterative process.
Keywords: Energy balance, Landsat, Bowen ratio, semi-arid
Resumo: AVALIAÇÃO DA EVAPOTRANSPIRAÇÃO REAL DIÁRIA ESTIMADA COM OS ALGORITMOS SEBAL E S-SEBI NA CULTURA DO ALGODÃO
O principal objetivo deste estudo foi avaliar a precisão de ET diária, obtida por algoritmos baseados em sensoriamento remoto, em comparação com os valores obtidos em campo pelo método da razão de Bowen na cultura do algodão. Esta campanha experimental foi desenvolvida no Estado de Ceará, Brasil, no campo experimental de EMBRAPA. Foram usadas neste estudo 4 imagens Landsat – 5 TM do ano de 2005, para aplicação dos algoritmos SEBAL e S-SEBI. A comparação entre os valores obtidos pelos algoritmos e os valores medidos em campo apresentou precisão satisfatória com um evidente melhor desempenho do algoritmo SEBAL. Os resultados comprovaram que o algoritmo S-SEBI é uma ferramenta importante a ser aplicada na análise da ET em regiões semi-áridas, devido a sua praticidade na obtenção do balanço de energia, assim como, por seu processamento ser mais simples do que o do algoritmo SEBAL, o qual necessita da solução de um processo iterativo. Palavras-chave: Balanço de energia, Landsat, Razão de Bowen, semi-árido
1. INTRODUCTION
The evapotranspiration (ET), which includes water evaporation from soil surfaces and vegetation transpiration, represents a fundamental process of hydrological cycle and is a key element of water resources management, particularly in semi-arid and arid regions (Budyko, 1974; Bouwer et al.,
Figure 1 - Experimental area location in relation to Ceará State and Brazil.
balance), but do not allow the estimation of luxes when dealing with larger spatial scales due to the inherent heterogeneity of land surfaces and the dynamic nature of water vapour transport processes (Gao et al., 2008).
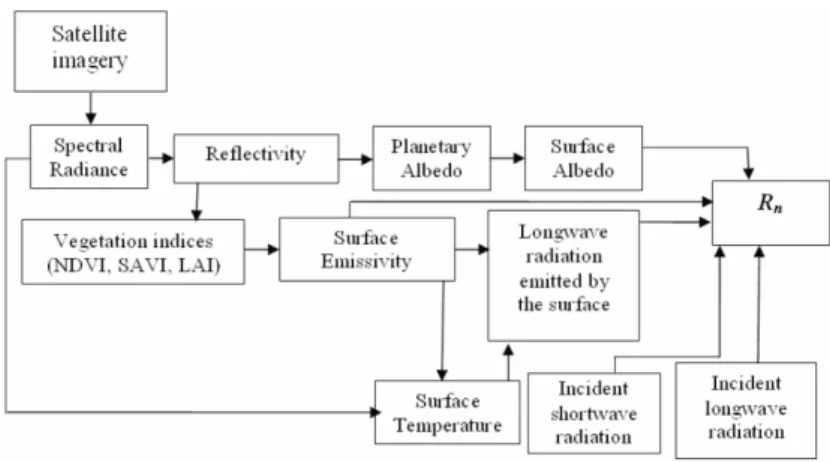
The quantiication of the ET losses on a regional scale and in high spatial resolution is an essential element for hydrological modeling, analysis of the water use on basin scale and adoption of correct irrigation management. Nowadays, with the increasing resolution of the satellite imagery, the remote sensing is an important technique for providing parameters at various temporal and spatial scales required to estimate ET. Surface Energy Balance Algorithm for Land (SEBAL) (Bastiaanssen et al., 1998a, and 1998b) uses spectral radiance recorded by satellite sensors and meteorological data to obtain the surface energy balance at regional scale. Another important algorithm is the Simpliied Surface Energy Balance Index (S-SEBI) (Roerink et al., 2000). The main difference between these algorithms is in the methodology to determine the sensible heat lux (H). SEBAL calculates the ET using the residual from the surface energy balance while the S-SEBI calculates it using the evaporative fraction (Λ) theory, that is obtained by the parameterizations based on surface albedo and land surface temperature (Roerink et al., 2000), and instantaneous available energy.
The extrapolation of instantaneous ET for daily values constitutes an important step in the remote sensing methods. In SEBAL (Bastiaanssen et al., 1998a and 1998b; Bastiaanssen, 2000) and S-SEBI (Roerink et al, 2000; Sobrino et al.,
2005, 2007) the daily ET is estimated based on daily luxes conservation (Brutsaert and Sugita, 1992) admitting that the relationship between the latent heat lux and available energy is kept relatively constant during the day. This methodology uses as input parameter the daily net radiation, which is usually calculated as a function of the daily solar radiation measured in meteorological station (Roerink et al., 2000; Bastiaanssen, 2000; Gomez et al., 2005, Sobrino et al., 2005; 2007).
The emphasis of this study is to evaluate the daily ET based on the energy balance obtained by SEBAL and S-SEBI algorithms. The estimates of these methods are compared with ield observations of a cotton crop using the Bowen ratio method. The studied area is located in a semi-arid region of Brazil, with few meteorological stations in operation. For this reason, the application of different remote sensing algorithms, to obtain the ET, are necessary and the analysis of accuracy is important to identify which algorithm is more appropriate.
2. MATERIALS AND METHODS 2.1 Study Area and Data
(4)
l
ET = R
n- H - G
(
−
)
↓+
↓−
↑−
(
−
)
↓=
S L L Ln
R
R
R
R
R
1
α
1
ε
0(5)
climate, according to Thornthwaite and Mather (1955) climatic classiication is ClA’wa’ dry sub humid with moderate water excess during the summer months. This climate type is created because the Apodi plateau inluences. Four TM Landsat – 5 images of DOY (day of the year) 272, 288, 304, 320 of 2005 were used with SEBAL and S-SEBI algorithms, covering the complete growth cycle of the cotton crop. The data used in the validation of remote sensing methods were collected in an experimental campaign accomplished on the herbaceous cotton crop, cultivar 200-brown BRS, using Bowen ratio technique.
The partition of energy at the surface between sensible and latent heat luxes is usually obtained by the Bowen ratio energy balance (BREB) method (Perez et al., 1999; Azevedo et al., 2007; Silva et al., 2007) using the average of the Bowen ratio (Perez et al., 2008). According to Perez et al. (2008) over an averaging period (in general 30 minutes) a relationship between luxes and vertical gradients can be formulated as:
where λE is the latent heat lux (W m-2), H is the sensible heat lux (W m-2), ρ
ais the mean air density at constant pressure (kg
m-3), cp is the speciic heat of air at constant pressure (J kg-1
ºC-1), γ is the psychometric constant (Pa/ºC), e is the actual vapour pressure of the air (Pa), T is the temperature (ºC), kh
is the turbulent heat transfer coeficient and kv is the turbulent
vapour transfer coeficient.
Assuming kh = kv (Verma et al., 1978) and taking
measurements between two levels within the adjusted surface layer, the Bowen ratio (β) is obtained as:
where ∆T and ∆e are temperature and vapour pressure differences at two measurement levels above the cotton crop canopy. According to Perez et al. (2008) this technique is used to obtain λE and H from equations 1 and 2 when available energy is accurately measured.
The air temperature difference between the dry and wet bulbs was measured using the thermocouples (type T copper-constantan) installed at two levels (0.5 and 1.5 m) above the crop canopy. The net radiation (Rn) was measured using a net
a p v
c
e
E
k
z
ρ
λ
γ
∂
= −
∂
a p h
T
H
c k
z
ρ
∂
=
∂
(1) (2)t z
T
e z
e
β γ
=
∂ ∂
=
γ
∆
∂ ∂
∆
(3)
radiometer (NR-LITE; Kipp & Zonen, Delft, The Netherlands). Incoming solar radiation (Rg) and outgoing solar radiation (Rg)
were obtained with a solar (or shortwave) radiometer (CM3; Kipp & Zonen, Delft, The Netherlands), all radiation instruments were installed at 1.0 m above crop canopy, and soil heat lux (G) was measured with two soil heat lux plates (model HFP01SC-L, Campbell Scientiic, Inc., Logan, UT) at 0.05 m soil depth.
The actual ET was obtained using the surface energy balance equation:
where λET is the latent heat lux in the atmosphere boundary
layer (W m-2), Rn is the net radiation (W m-2), H is the sensible
heat lux (W m-2) and G is the soil heat lux (W m-2).
2.2 Algorithm Descriptions I) SEBAL
The Rn obtained by SEBAL and S-SEBI algorithms, was
calculated using the following equation:
where α is the surface albedo, RL is the longwave radiation
(thermal) emitted by the surface, εo is the surface emissivity obtained through Leaf Area Index (LAI),
1
R
RSS↓ is theshort-wave incoming solar radiation,
R
RLL↑ is the longwave incomingradiation, estimated from the Stefan-Boltzmann equation based on the air temperature at the satellite overpass (Bastiaanssen et al., 1998a). Figure 2 shows the lowchart of the computational steps used to obtain the Rn at the surface.
The following equation was developed by Bastiaanssen (2000) to obtain G and it is used in the SEBAL and S-SEBI algorithms:
where α is the surface albedo, TS is the surface temperature, and
NDVI is the Normalized Difference Vegetation Index, obtained based on the relectance in channels 3 and 4 of Landsat 5-TM.
The dificult task in SEBAL is the method to obtain H
that is computed using the following heat transport equation:
(6)
Figure 2 - Flowchart of computational steps used to obtain Rn at the land surface.
ET=ETr.FETy(24)
(9)
(11)
(
)
α
α
λ
λE H E
H H H
b
b
a
a
T
s
b
a
−
+
−
−
+
=
Λ
Tsl
ET
= L (
R
n-G
)
(13)
where ρ is the air density (kg m-3), cP is the air speciic
heat at constant pressure (J kg-1 K-1), dT is the temperature
difference (T1 – T2) between two heights (z1 and z2), and rah
is the aerodynamic resistance to heat transport (s m-1). This calculation is developed as a function of the temperature gradient, surface roughness and wind speed. Nevertheless, the Equation 7 is dificult to solve, because dT and rah terms are
diicult to measure. However, by using the “anchor” pixels, called hot and cold pixels, to solve this problem representing maximum conditions of temperature and humidity from the known values of H and dT. The acquisition of the rah and dT
values from the images is computed admitting initial neutral atmospheric conditions. The Monin-Obukhov similarity theory (Bastiaanssen et al., 1998a) is applied in order to correct u∗ and rah iteratively until the stabilization is achieved.
Allen et al. (2002), Trezza (2002) and Tasumi (2003) showed that the reference ET Fraction (ETrF) is similar to the crop coeficient (Kc) (Allen et al., 1998) and can be obtained by:
where ETris the hourly reference evapotranspiration, calculated
using the FAO-Penman-Monteith method and data originating from a weather station. Considering, ETrF equal to Kc (Allen et al, 2002; Trezza, 2002), and maintaining constant during the daytime, the daily actual ET was calculated by the classic FAO-Penman-Monteith method (Allen et al., 1998):
where ETr(24)is the daily reference evapotranspiration, which
is also calculated using weather station data and FAO-Penman-Monteith method (Allen et al., 1998).
(8)
II) S-SEBI
S-SEBI algorithm uses the evaporative fraction
( )
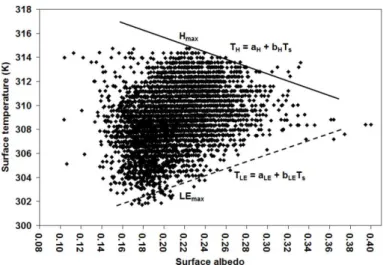
Λ theory to solve the surface energy balance through a parameterization proposed by Roerink et al. (2000):where Tsis the land surface temperature, TH is the temperature
of maximum sensible heat flux pixels, obtained by linear relationship between the surface temperature (dependent variable) and albedo (independent variable), TλE is temperature
of the maximum latent heat lux pixels which is also obtained using linear relationship between temperature and albedo. Figure 3 shows the schematic representation of obtaining TH andTλE.
Thus, substituting the linear regression of TH and TλE in
Equation 10, Λ was calculated as:
The H and λE are obtained using the available energy and Λ, according to:
and
Finally, the daily ET estimation by S-SEBI is based on the theory that the instantaneous evaporative fraction
( )
i
Λ is equal to the daily evaporative fraction
( )
d
Λ :
(
)(
R G)
H = 1−Λ n−
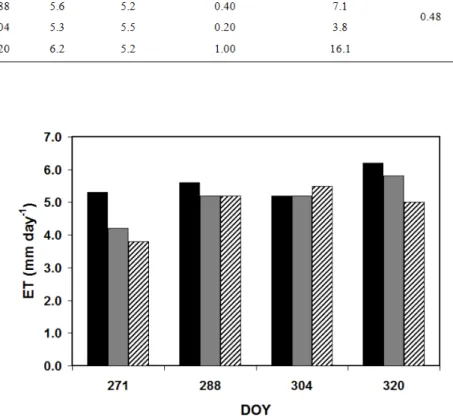
between the estimated values by remote sensing algorithms and the ground measurements showed satisfactory accuracy, in comparison with the analyses obtained by Weligepolage (2005). The values presented in Figure 5, Tables 1 and 2, evidence the best performance of the SEBAL algorithm, with differences between the methods lesser than 0.5 mm day-1, daily errors less than 7.1% and Mean Absolute Difference (MAD) of 0.30 mm day-1. SEBAL results observed by Wilegepolage (2005) presented differences above 0.4 mm day-1 on seven studied dates in Hupselse Beek, The Netherlands, when compared with scintilometer measurements with a MAD of 0.98 mm day-1. However, The Netherlands is a region which presents different climate conditions in comparison with the study area in Brazil and the scintilometry is a technique to provide direct measurements of luxes contrasting with the Bowen ratio technique used in this study.
The results obtained using the S-SEBI algorithm presented a maximum difference of 1.0 mm day-1 and maximum error of 16.1% for the DOY 320. For the other dates, the differences were inferior to 0.5 mm day-1 and errors less than 10%, with MAD less than 0.5 mm day-1 as shown in Table 2. Gómez et al. (2005) and Sobrino et al. (2005) also obtained differences between estimated values by S-SEBI and measured value lower than 1.0 mm day-1. Wilegepolage (2005) obtained differences varied between 0.7 and 1.6 mm day-1 in comparison with values obtained using scintilometer measurements.
Table 3 presents the r values at a statistical signiicance level of 5% (p<0.05), Mean Bias Error (MBE) and Root Mean Square Error (RMSE), between the daily ET values of 6,000 pixels extracted from the images obtained by SEBAL and S-SEBI algorithms. In general, the correlations between them presented values greater than 0.85, evidencing a stronger agreement between these algorithms. The MBE presented a Figure 3 - Schematic representation of the relationship between land surface temperature and surface albedo.
(14)
(
) (
nd d)
d i i n i d i G R E T G R ET − = − = Λ =
Λ l
λ
ET lλ
ET(15)
of the maximum latent heat lux pixels which is also obtained
Equation 10, Λ was calculated as:
and Λ, according to:
Considering that the integrated daily soil heat lux is approximately equal to zero (Allen et al., 1998), the daily ET was calculated by:
where Rniis instantaneous net radiation at the time of satellite
overpass, calculated using Equations 5 and 6, respectively, and
Rnd is the daily net radiation. The calculation of Rnd in S-SEBI
applications has been made using the procedure proposed by Seguin and Itier (1983). They showed that the ratio between instantaneous and daily values of net radiation is constant during the daytime.
3. RESULTS AND DISCUSSION
Figure 5 - Comparison between measured and estimated values of ET.
Table 1 - Observed daily evapotranspiration in the cotton crop ield using the Bowen ratio method and the estimated value by SEBAL algorithm using Landsat 5 – TM images.
aAbsolute difference = /observed – estimated /; bPercentual Error = (Absolute
difference / observed)x100 and
cMAD =
∑
=
−
n
i
estimated observed
n 1
1
Table 3 - Correlation coeficients, MBE and RMSE to ET values of the 6,000 pixels obtained by SEBAL and S-SEBI algorithms.
a Statistically signiicant at 5% level (p<0.05)
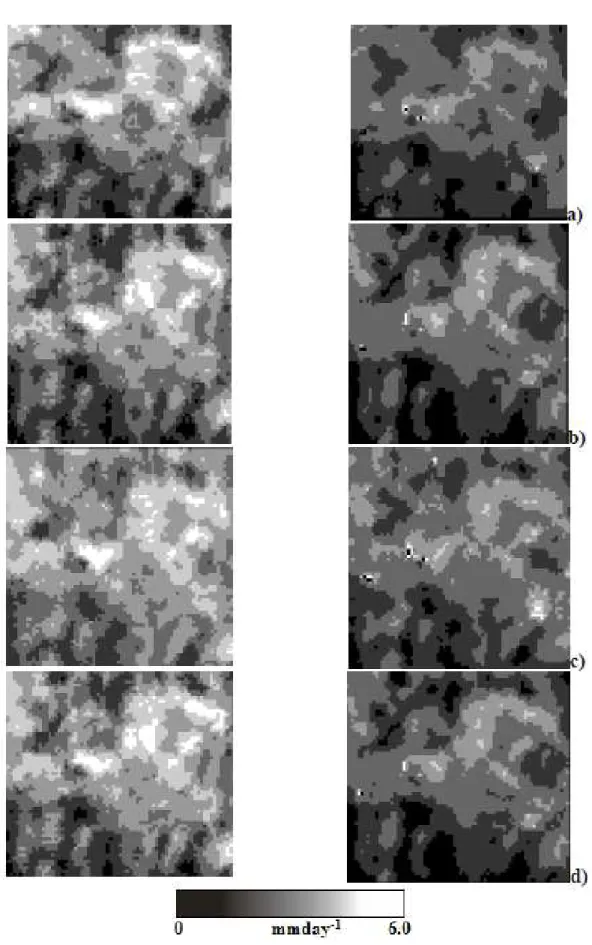
Figure 6 - Correlation between the daily ET values to DOY 272(a), 288(b), 304(c) and 320(d) obtained by SEBAL and S-SEBI algorithms.
maximum value of 0.04 mm day-1 and a minimum value of 0.02 mm day-1, with RMSE of 0.56 mm day-1 and 0.38 mm day-1 (maximum and minimum values, respectively).
In Figure 6, it is possible to observe the behavior of the correlation between the ET estimated by SEBAL and S-SEBI to different images. In general, it is possible to identify pixels presenting the same values to both algorithms, however, the minimum ET values obtained by S-SEBI algorithm were
underestimated (see the equations in the igure 6) in comparison with the SEBAL algorithm values.
can be present in the same pixel due to the spatial cover presenting estimates of inaccuracy. The SEBAL algorithm shows better results in obtaining ET, but needs the determination of dificult parameters.
4. CONCLUSIONS
In this paper the methods suggested by Bastiaanssen et al. (1998a, 1998b) (SEBAL) and Roerink et al. (2000) (S-SEBI) for ET retrieval from high spatial resolution data (30 m) have been applied. The comparison between the estimated values by remote sensing algorithms and ield observations showed the satisfactory accuracy of the methods with mean absolute difference between SEBAL and Bowen ratio of 0.30 mm day-1 and between S-SEBI and Bowen ratio of 0.48 mm day-1. The SEBAL algorithm performance has been better than S-SEBI algorithm. Analyses of the correlation between daily ET values obtained by SEBAL and S-SEBI algorithms, presented correlation coeficients greater than 0.85, evidencing a better agreement between these algorithms. The results presented in this study evidence that the S-SEBI algorithm as a promising tool to be applied in semi-arid and arid regions, especially in Brazilian semi-arid region that has few weather stations in operation. Such a situation represents limitations for SEBAL applications and other remote sensing algorithms.
5. ACKNOWLEDGEMENTS
The authors are grateful for the PhD scholarship provided by National Council for Scientiic and Technological Development (CNPq) to the irst and second authors and the EMBRAPA that has provided the cotton ield data. The authors thank the anonymous reviewers whose suggestions were helpful for improving the quality of this paper.
6. REFERENCES
ALLEN, R. G., PEREIRA, L. S., RAES, D., SMITH, M. Crop evapotranspiration - Guidelines for computing crop water requirements – FAO Irrigation and drainage paper 56. Rome-Italy, 1998.
ALLEN, R. G., TASUMI, M., TREZZA, R. SEBAL (Surface Energy Balance Algorithms for Land) – Advanced Training and Users Manual – Idaho Implementation, version 1.0, 2002.
AZEVEDO, P. V., SOUZA, C. B., SILVA, B. B., SILVA, V. P. R. Water requirements of pineapple crop grown in a tropical environment, Brazil. Agricultural Water Management, v. 88, p. 201-208, 2007.
BASTIAANSSEN, W. G. M. SEBAL-based sensible and latent heat luxes in the irrigated Gediz Basin, Turkey. Journal of Hydrology. V. 229, p. 87-100. 2000.
BASTIAANSSEN, W. G. M., MENENTI, M., FEDDES, R. A., HOLTSLAG, A. A. M. A remote sensing surface energy balance algorithm for land (SEBAL) 1. Formulation. Journal of Hydrology, v. 212–213, p.198–212. 1998a. BASTIAANSSEN, W. G. M., PELGRUM, H., WANG, J., MA,
Y., MORENO, J. F., ROENRINK, G. J., VAN DER WAL, T. A remote sensing surface energy balance algorithm for land (SEBAL) 2. Validation. Journal of Hydrology, v. 212–213, p.213-229. 1998b.
BOUWER, L. M., BIGGS, T. W., AERTS, C. J. H. Estimates of spatial variation in evaporation using satellite-derived surface temperature and a water balance model. Hydrological Processes, v. 22, p. 670 – 682, 2008.
BRUTSAERT, W., SUGITA, M. Application of self-preservation in the diurnal evolution of the surface energy budget to determine daily evaporation. Journal of Geophysical Research v.97, n.18, p.377-382, 1992.
BUDYKO, M. I. Climate and Life. Academic Press: Orlando, 1974. GAO, Y., LONG, D., LI, Z. Estimation of daily evapotranspiration
from remotely sensed data under complex terrain over the upper Chao river basin in North China. International Journal of Remote Sensing, v. 29, n. 11, p. 3295 – 3315, 2008.
GÓMEZ, M., OLIOSO, A., SOBRINO, J. A., JACOB, F. Retrieval of evapotranspiration over the Alpilles/ReSeDA experimental site using airborne POLDER sensor and a thermal camera. Remote Sensing of Environment, n.96, p.399 – 408, 2005.
GORDON, L., DUNLOP, M., FORAN, B. Land cover change and water vapour lows: learning from Australia. Philosophical Transactions of the Royal Society of London, Series B: Biological Sciences, v. 358, p. 1973– 1984, 2003.
MILLY, P. C. D., DUNNE, K. A. Trends in evaporation and surface cooling in the Mississippi River basin. Geophysical Research Letters, v.28, p. 1219–1222, 2001.
PEREZ, P. J., CASTELLVI, F., IBAÑEZ, M., ROSELL, J. I. Assessment of reliability of Bowen ratio method for partitioning luxes. Agricultural and Forest Meteorology, v. 97, p. 141 – 150, 1999.
PEREZ, P. J., CASTELLVI, F., MARTINEZ-COB, A. A simple model for estimating the Bowen ratio from climatic factors for determining latent and sensible heat luxes. Agricultural and Forest Meteorology, v. 148, n. 1, p. 27 – 37, 2008. ROERINK, G. J.; SU, Z.; MENENTI, M. S-SEBI: A Simple
SEGUIN, B., ITIER, B. Using midday surface temperature to estimate daily evaporation from satellite thermal IR data. International Journal of Remote Sensing, v. 4, n. 2, p. 371−383, 1983.
SILVA, V. P. R., SILVA, B. B., AZEVEDO, P. V. Surface Energy Fluxes and Evapotranspiration of a Mango Orchard Grown in a Semiarid Environment. Agronomy Journal, v. 99, p. 1391-1396, 2007.
SOBRINO, J. A., GÓMEZ, M., JIMÉNEZ-MOÑOZ, J. C., OLIOSO, A., CHEHBOUNI, G. A simple algorithm to estimate evapotranspiration from DAIS data: Application to the DAISEX campaigns. Journal of Hydrology, v.315, p.117-125, 2005.
SOBRINO, J. A., GÓMEZ, M., JIMÉNEZ-MUÑOZ, J. C., OLIOSO, A. Application of a simple algorithm to estimate daily evapotranspiration from NOAA-AVHRR images for the Iberian Peninsula. Remote Sensing of Environment, v.110, n.2, p.139-148, 2007.
TASUMI, M. Progress in operational estimation of regional evapotranspiration using satellite imagery. PhD thesis,
Dept. Biological and Agricultural Engineering, University of Idaho. Idaho, 2003.
THORNTHWAITE, C. W., MATHER, J. R. The Water Balance: Publication in climatology. New Jersey: Drextel Institute of Technology, 1955, 104p.
TREZZA, R. Evapotranspiration using a satellite-based Surface energy balance with standardized ground control. 247f. Thesis (Doctor of Philosophy in Biological and Agricultural Engineering). Utah State University. Logan, Utah, 2002. VERMA, S. B., ROSENBERG, N. J., BLAD, B. L. Turbulent
exchange coeficients for sensible heat and water vapor under advective conditions. Journal of Applied Meteorology, v. 17, p. 330–338, 1978.