RESEARCH NOTE
GerminaQuant: a new tool for germination measurements
1Felipe Rafael Ferreira Marques
2, Marcos Vinicius Meiado
3, Natália Maria Corte
Real de Castro
4, Mariana Lins de Oliveira Campos
4, Keila Rêgo Mendes
4,
Orlando de Oliveira dos Santos
4, Marcelo Francisco Pompelli
4*ABSTRACT - The seed technologies related with germination and seed research has provided unprecedented opportunities for the biologic research community. Researchers require such information to rapidly determine the speed of seedling emergence. However, an immense amount of data must be analyzed to achieve this goal. In this paper, we introduce a computer software designed for broad use to facilitate the understanding of germination processes and their analysis. GerminaQuant 1.0 was written
in the C++ programming language and presents a user-friendly interface. The accuracy of the software was tested using fifty
different matrices, whose output values were compared with other spreadsheets available on the web. With data analysis, we showed that the GerminaQuant is capable of generating mathematical calculations with extreme accuracy, besides have a good performance and wide ease of use in any kind of computer. In addition, the new software has been tested by at least eighty users, which compared functionality, designer and accuracy of the output data. In all variables, the GerminaQuant was evaluated as superior compared to other spreadsheets available on the web. The full GerminaQuant package (for Windows®, Macintosh® and
Linux®) is freely available to the scientific community and can be easily downloaded from the website (http://www.ufpe.br/lev).
Index terms: mean germination time, seed germination, software, spreadsheet, synchrony and uncertainty of germination.
GerminaQuant: uma nova ferramenta para cálculos de germinação
RESUMO -A avaliação da velocidade e intensidade de germinação de lotes de sementes têm providenciado oportunidades sem
precedentes para a comunidade científica. Pesquisadores requerem tais informações para rapidamente determinar a velocidade
de emergência da plântula. Entretanto, uma quantidade extensa de dados é analisada para se alcançar este propósito. Neste artigo, introduzimos um software desenhado para facilitar o entendimento dos processos de germinação e a análise dos dados. O GerminaQuant 1.0 foi escrito em linguagem de programação C++ e apresenta uma interface amigável. A precisão do software foi testada a partir de cinquenta diferentes matrizes, cujos valores de saída foram comparados com outras planilhas de cálculo disponíveis na web. Com a análise dos dados foi mostrado que o GerminaQuant é capaz de gerar cálculos matemáticos com extrema precisão, além de apresentar uma performance amigável, com ampla facilidade de uso em qualquer computador. Ademais, o novo software foi testado para oitenta usuários, os quais compararam a sua funcionalidade design e precisão. Em todas as variáveis, o GerminaQuant foi avaliado como sendo superior quando comparado às demais planilhas disponíveis na web. O GerminaQuant (disponível para Windows®, Macintosh® e Linux®) está disponível gratuitamente para download por toda a comunidade científica, através do endereço http://www.ufpe.br/lev.
Temos para indexação: tempo médio de germinação, germinação de sementes, software, planilhas eletrônicas, sincronia e incerteza na germinação.
1Submitted on 03/02/2015. Accepted for publication on 09/03/2015. 2Departamento de Computação, Universidade Federal de Pernambuco,
50670-901- Recife, PE, Brasil.
3Departamento de Biociências, Universidade Federal de Sergipe, 49500-000-
Itabaiana, SE, Brasil.
4Departamento de Botânica, Universidade Federal de Pernambuco, 50670-901-
Recife, PE, Brasil
Introduction
Seeds are the most sophisticated means of propagation created by plant evolution. They are indispensable for human society as food sources and as starting materials for new crops (Joosen et al. 2010). Seed physiology and technology have provided valuable tools for the production of high-quality seeds, seed treatments and optimal storage conditions. In fundamental research, seeds are studied exhaustively and systems biology approaches are undertaken to fully explore
dormancy and germination (Penfield and King, 2009). The
increasing demand for total quality from seed companies has required the implementation of testing that is increasingly
safe, with the goal of ensuring the quality of the final product
(Sinício et al., 2009). For instance, seed dormancy has been found to be a crucial mechanism to avoid fatal germination, thus assuring seedling survival under highly unpredictable climatic environments (Baskin and Baskin, 1998). The percentage of germination, although very often used, is not very explanatory. Currently, there is a lack of information about the start time, rate, and uniformity of germination, which are essentially important for normally distributed seed population and for seed companies. This feature could be solved by the introduction of the mean germination time (MGT), uncertainty (U), and synchrony (Z) of germination (Miranda et al., 2014; Ranal and Santana, 2006). However, in this type of experiment the number of germination assays required is immense, which can lead to human error or misjudgment of seed treatments. Thus, accuracy of germination and data processing necessitate the development of a comprehensive software program using a computer language to exclude all the time-consuming manual operations involved in formulating and calculating seed germination features.
In the last two decades, the advent of computer processing
has allowed for the quantification of several seed germination
features. In fact, a variety of computational techniques have been proposed to improve the visualization of seed germination data. These techniques include the capture of seed digital images (Dell’Aquila, 2009; Hoffmaster et al. 2005; Wagner et al. 2011) and their processing (Sako et al., 2001); Sinício et al. 2009. Moreover, the cost of such software ranges from zero (i.e., freeware families) to thousands of dollars. The high cost of germinating software and the hardware necessary to run it means that only private companies or well-funded organizations are able to afford these softwares. Furthermore, with the availability of inexpensive, high-powered desktop computers and several advances both in the accessibility and maturation of freeware and open-source software, there is little need for customized computing platforms running proprietary
and expensive office and bioinformatics software. Although
many low-cost software programs are now available, we are unaware of any software allowing calculations of germination and that is also easy to use, can be run on different operating systems and does not require in-depth help systems or on-line help system or the need for powerful machines to run. It should be noted that to date, there is no free software that allows the calculation of germination and the degree of synchronization of this process. There are, however, some freely spreadsheets which in stricto sensu are not really a software but a set of spreadsheets developed on Microsoft® Excel package. On this
category are included the spreadsheets developed by Ranal et al. (2009), Joosen et al. (2010) and Miranda et al. (2014). The major limitation of the spreadsheets proposed by Miranda et al. (2014) and Ranal et al. (2009) is the impossibility of working
with different treatments in the same file at the same time;
each treatment or situation must be interpreted in different spreadsheets which are time consuming in addition to being tedious. The spreadsheets proposed by Joosen et al. (2010) would be the only, therefore allowing the calculation of two or more treatments at the same time. However, this “software” is not a tool of universal domain, it requires the user to deeply understand the functioning of these spreadsheets to better explore the tool and its features. Therefore, the scope of this paper is focused on describing GerminaQuant 1.0 as a new software program for measuring seed germination data.
Material and Methods
Problem to solve
Overall, GerminaQuant 1.0 is a well-designed germination calculator. GerminaQuant 1.0 integrates a variety of formula and equations for measuring germination percentage, mean germination time (MGT), uncertainty (U), and synchrony (Z). MGT is calculated by equation 1, where ti is time from the start of the experiment to the ith observation; n
i is the number of
seeds germinated in ith time (not the accumulated number but
the number corresponding to the ith observation), and k is the
last time of germination. The uncertainty of the germination process is calculated by equations 2 and 3, where ni is the number of seeds germinated in ith time and k is the last day
of observation. The synchrony of germination is calculated by equations 4 and 5, where ,2
i
n
C is the combination of the seeds germinated in ith time, two by two, and n
i is the number
of seeds germinated in ith time.
= Equation 1
k
i i k
i i i
n t n MGT
= Equation 2
= Equation 3
= Equation 4
= Equation 5
Software description
GerminaQuant 1.0 is written in C++ programming code plus a Qt framework for the graph interface. C++ is one of the most popular programming languages TiobeSoftware, 2014 because it is a general-purpose programming language that is free-form and compiled. It provides imperative, object-oriented and generic programming features. Various entities provide both open-source and proprietary C++ compiler software, including FSF, LLVM, Microsoft® and Intel®
Schildt, 1998. Qt is a cross-platform application framework that is widely used for developing application software with a graphical user interface (GUI) (in which cases Qt is
classified as a widget toolkit) and is also used for developing
non-GUI programs such as command-line tools and consoles for servers Ezust and Ezust (2006). Qt uses standard C++ but makes extensive use of a special code generator (called the Meta Object Compiler, or MOC) together with several macros to enrich the language. Qt can also be used in several other programming languages via language bindings. It runs on the major desktop platforms and some of the mobile platforms
(Blanchette and Summerfield, 2006).
Both 32- and 64-bit versions of GerminaQuant 1.0 are freely available for Windows® XP and higher, Linux and
Mac platforms. The system, with high processor power and physical memory able to quickly process a large number of data points, requires a Pentium PC with a minimum of 120 MB free hard disk space and 16 MB RAM. Overall, the design of the software allows the user to quickly adapt to it.
Test software and survey with users
To evaluate the efficiency of the developed software, fifty simulations of matrices of germination obtained with
empirical data were performed using the GerminaQuant 1.0 software. The output results were compared with those generated by the spreadsheet described by Miranda et al. (2014), Ranal et al. (2009) and Joosen et al. (2010). Feedback
from users is welcome and will be used to improve the
program and to correct unforeseen flaws. To collect initial
user feedback, both software and a form on which the user answered questions regarding the functionality were made available on the web. On this form, the user was to evaluate the user interaction, processing speed, and graphical interface and compare between GerminaQuant 1.0 and the spreadsheets developed by Miranda et al. (2014), Ranal et al. (2009) and Joosen et al. (2010). To cope it, a Likert scale was used in which the user assigned a value of 5 to 1, in descending order
of satisfaction. In this scale, 5 denote completely satisfied, 4 denotes partially satisfied, 3 denotes satisfied but needs strong adjustments, 2 denotes partially unsatisfied, and 1 denotes completely unsatisfied (Likert, 1932). After completing the
form, all users signed a waiver, starting that they understood the research goals and that no personal information would be disclosed. The relative importance of the advantages and disadvantages of GerminaQuant 1.0 versus the spreadsheets were calculated as the arithmetic average of the scores given to each of the variables evaluated, which were later ranked by category, and new calculations were performed.
Results and Discussion
Software description
The software presented here represents a novel and efficient
analysis tool for computing seed germination. It is designed to be up-to-date, convenient, and reliable tool for experts in
different fields (e.g., botany, agronomy, animal husbandry),
allowing for the calculation of germination features after any seed treatment. GerminaQuant 1.0 is copyrighted by the
authors and registered at the Brazilian Patent Office (Instituto
Nacional de Propriedade Industrial, INPI) under number BR5120140006301, and 907877630 for software trademark. GerminaQuant 1.0 has a simple interface to allow researchers with little training in mathematics to engage in computations with a seed germination calculator and easily obtain results. GerminaQuant 1.0 for Windows®, Macintosh®, and Linux®
platforms, is freely available but is not an open-source programming code. With a small source code of only 1.63 Mb, GerminaQuant 1.0 shows good performance, taking only 1-2 s to run all sequences of calculations.
At Windows Vista and upper, the GerminaQuant 1.0 should be installed by clicking on the germinaquant_eng_windows. msi. The user should select the destination location where the software is to be installed. If the user does not change the original folder, GerminaQuant 1.0 must be installed in C:\Program Files\ GerminaQuant. The user is asked “where should Setup place the program’s shortcuts?” and whether a start menu folder should
k i i i f f U 1 2 log
k i i i n n fi 1 2 , 1 2 ,
i i n k i n C C Z 2 ) 1 ( 2, i i n
be created. We advise that the original information remain
unchanged. The user can then select more configuration option
during the setup, such as “Create a desktop icon” and “Create a Quick Launch icon”, which may facilitate starting the software. Once the software is installed and started, a splash screen appears. On this screen, information about the software version, the coordinator, and developer are presented. A Welcome screen then appears on which the user should select “New Spreadsheet” or “Open Spreadsheet”. Clicking the ‘New Spreadsheet’ button
allows the creation of the file into which all the subsequent
details will be stored. A window then appears that provides
information explaining the steps that need to be taken to finish
creating the matrix, such as ‘Nº of days’, ‘Nº of replications’, and Nº of seeds by ‘replications’. In this step, empty cells are not allowed; the system then sends an error message asking the user to review the input data. After inputting the data, the appropriate parameters are put into the matrix, allowing the user to directly enter germination data, either by typing or by cutting-and-pasting from other sources. It is worth noting that when the germination is zero, the user can leave the cell blank because the software understands an empty cell as a zero value. Caution should be taken when entering data because it is necessary to enter the number of seeds germinated at the ith observation (not
the accumulated values). Another way to enter data are sequence File | New or clicking New Spreadsheet from the Menu button.
After filling the matrix with seed germination data, the user
can proceed to the calculations of germination parameters. This issue should be accessed by the sequence Calculation | Calculate or using command “Ctrl + K” or by clicking Calc in the Menu Button. Special attention should be given to the synchrony, a quotient between the sum of the partial combinations of the number of seeds germinated in each ti, two by two. The reason is that in a situation in which no seed germinated, synchrony is not allowed, and the software sends the message ‘nan’, meaning no synchrony of germination (more details on this function can be found in Ranal et al. (2009).
The results of calculations together with the matrix can be
saved as a GQ or PDF file through the option File | Salve As. Pre-existing GQ files can be entered using the Open button
or Open Spreadsheet. This tool may seem trivial but can be handy at times because it allows the loading of previously saved data. The menu bar also provides links for printing the
file generated by the software, sequence File | Print, and the
menu Edit provides the user links for coping and pasting data from other sources, such as Microsoft® Excel.
Software reliability and user evaluation
We tested the reliability of GerminaQuant 1.0 using 50 different matrices for which the output values were compared with the
values measured using previously described worksheets (Joosen et al., 2010; Miranda et al., 2014; Ranal et al., 2009). When we assessed the reliability of the data generated by GerminaQuant 1.0,
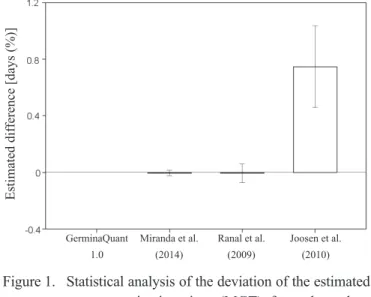
we verified that this software can estimate germination percentage
and MGT with high reliability because the output values were 100% identical to those estimated by the spreadsheets described by Mirandaet al. (2014) and partially identical to those estimated by Ranal et al. (2009) (Figure 1). With respect of output values generated by worksheets described by Miranda et al. (2014) we
verified that values were identical to the sixth decimal. However, we, also verified that output values estimated by Germinator
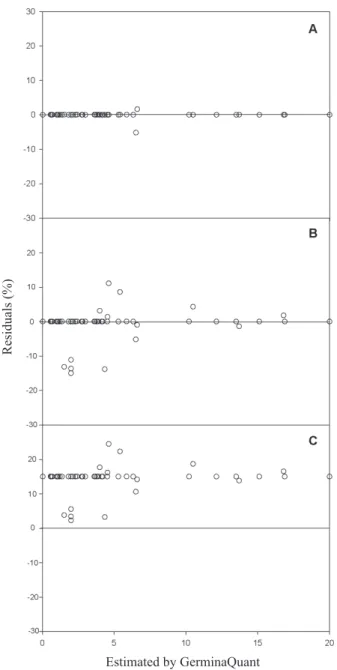
Joosen et al. (2010) are biased and underestimate the MGT in high magnitude when compared of output values generated by GerminaQuant 1.0, or even the output values generated by Miranda et al. (2014) or Ranal et al. (2009) (Figure 1). Moreover, the MGT output data generated by worksheets described by Miranda et al. (2014) and Ranalet al. (2009) present a homoscedastic behavior (Figures 2a and 2b). However, when we compare the MGT output data generated by Germinator, we noted that the dispersion pattern of residuals did not follow a normal distribution of residual scatter plot (i.e., a heteroscedastic behavior) (Figure 2c). These features can invalidate the calculated MGT because these values
are significantly different of those estimated by other worksheets
(Mirandaet al., 2014; Ranalet al., 2009) or those values estimated by GerminaQuant 1.0 (Table 1).
Figure 1. Statistical analysis of the deviation of the estimated mean germination time (MGT) from the values obtained by GerminaQuant 1.0 and worksheets previously published. Estimated differences was estimated using residuals differences between output values generated by GerminaQuant 1.0 and other worksheets, in which b0 and b1 are coefficients. Vertical bars denote means and spreads denote 99%
confidence intervals of the difference.
Estimated dif
ference [days (%)]
GerminaQuant 1.0
Miranda et al. (2014)
Ranal et al. (2009)
Table 1. One-wayANOVA summary table and Tukey’s test of mean germination time.
Source of variance d.f.
Sum of Squares
Mean
Squares P Treatments 3 21.08573 7.02858 0.00038* Residual 196 4310.30392 21.99135
Total 199 4331.38965
Source Means Significance GerminaQuant 1.0 5.00751 a Miranda et al. (2014) 5.01214 a Ranal et al. (2009) 5.01299 a Joosen et al. (2010) 4.26104 b * significant at p ≤ 0.001
The worksheets described by Joosen et al. (2010) do not allow the calculation of some features, as synchrony and uncertainty, as do GerminaQuant 1.0 which did not allow us to compare the values estimated by Germinator (Joosen et al. 2010). However, when output values generated by GerminaQuant 1.0 was compared with the spreadsheets described by Miranda et al. (2014), we
verified that the uncertainty could only be estimated reliably
ns not significant
Table 2. One-wayANOVA summary table and Tukey’s test of uncertainty.
Source of
variance d.f.
Sum of Squares
Mean
Squares P Treatments 2 0.00159 0.00079 0.9324ns Residual 147 131.45824 0.89427
Total 149 131.45983
Source Means Significance GerminaQuant 1.0 2.07032 a Miranda et al. (2014) 2.07672 a Ranal et al. (2009) 2.06942 a
when the matrices contained at least 15 columns. This is due to the addition of the correction factor created by Miranda et al. (2014). When analyzed independently, this ‘error’ does not result in any problem; however, this factor may overestimate the values of uncertainty in longer spreadsheets. Nevertheless, we
verified that the uncertainty values estimated by GerminaQuant
1.0 or those estimated by spreadsheets developed by Miranda et al. (2014); Ranal et al. (2009) were not distinct from each other by Tukey post hoc test (Table 2).
Figure 2. Dispersion pattern of residuals of values generated by worksheet proposed by Miranda etal. (2014) (A), worksheet proposed by Ranal et al. (2009) (B) and worksheet proposed by Joosen et al. (2010). In A and B the dispersion patterns presents a homoscedastic distribution and in C the residuals present a heterocedastic behavior.
GerminaQuant 1.0 was then made available for testing by
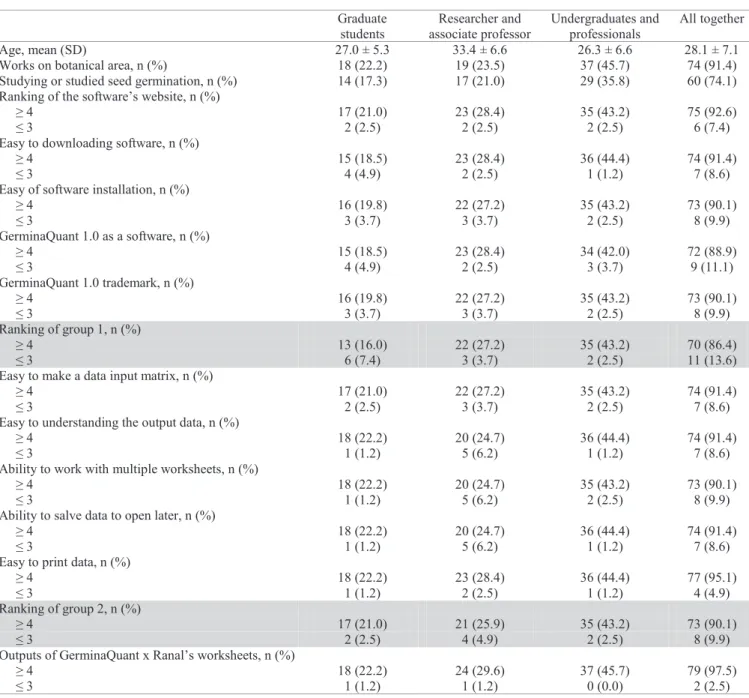
the scientific community. Eighty-one completed forms were
returned for the following analysis. Of the evaluators, 31% were researcher or associate professors and another 23% and 46% were, respectively, graduate students or undergraduates and professionals (Table 3).
Analyzing the answers to group 1 questions – First impressions of the software, 9.9% of the users reported
difficulty with the installation of the software, which was
because some of the users did not have appropriate unzip
Residuals (%)
Journal of Seed Science, v.37, n.3, p.248-255, 2015
software or unzip experience. We solved this problem by
introducing of the .MSI extension to self-installing file. The
Windows Installer (.MSI), previously known as Microsoft®
Installer, is a special type of setup package that includes
information related to the installation, fixing, or removal
of an application on modern Microsoft® Windows systems.
The GerminaQuant 1.0 as a software was considered good or very good by 88.9% of the users, and the trademark was considered excellent by 90% of the users. Thus, the mean of this group was 4.6 ± 0.6.
Table 3. Survey responses. The forms were applied to 81 volunteers, categorized as graduate students, researcher and associate
professor or undergraduates and professionals, distributed in at least five Brazilian regions. To rank the scores of
questions we used the Likert scale, where the user assigned a value of 5 to 1, in descending order of satisfaction. In this
scale, 5 denotes completely satisfied, 4 denotes partially satisfied, 3 denotes satisfied but needs strong adjustments, 2 denotes partially unsatisfied, and 1 denotes completely unsatisfied.
Graduate students
Researcher and associate professor
Undergraduates and professionals
All together
Age, mean (SD) 27.0 ± 5.3 33.4 ± 6.6 26.3 ± 6.6 28.1 ± 7.1
Works on botanical area, n (%) 18 (22.2) 19 (23.5) 37 (45.7) 74 (91.4) Studying or studied seed germination, n (%) 14 (17.3) 17 (21.0) 29 (35.8) 60 (74.1)
Ranking of the software’s website, n (%)
≥ 4 17 (21.0) 23 (28.4) 35 (43.2) 75 (92.6)
≤ 3 2 (2.5) 2 (2.5) 2 (2.5) 6 (7.4)
Easy to downloading software, n (%)
≥ 4 15 (18.5) 23 (28.4) 36 (44.4) 74 (91.4)
≤ 3 4 (4.9) 2 (2.5) 1 (1.2) 7 (8.6)
Easy of software installation, n (%)
≥ 4 16 (19.8) 22 (27.2) 35 (43.2) 73 (90.1)
≤ 3 3 (3.7) 3 (3.7) 2 (2.5) 8 (9.9)
GerminaQuant 1.0 as a software, n (%)
≥ 4 15 (18.5) 23 (28.4) 34 (42.0) 72 (88.9)
≤ 3 4 (4.9) 2 (2.5) 3 (3.7) 9 (11.1)
GerminaQuant 1.0 trademark, n (%)
≥ 4 16 (19.8) 22 (27.2) 35 (43.2) 73 (90.1)
≤ 3 3 (3.7) 3 (3.7) 2 (2.5) 8 (9.9)
Ranking of group 1, n (%)
≥ 4 13 (16.0) 22 (27.2) 35 (43.2) 70 (86.4)
≤ 3 6 (7.4) 3 (3.7) 2 (2.5) 11 (13.6)
Easy to make a data input matrix, n (%)
≥ 4 17 (21.0) 22 (27.2) 35 (43.2) 74 (91.4)
≤ 3 2 (2.5) 3 (3.7) 2 (2.5) 7 (8.6)
Easy to understanding the output data, n (%)
≥ 4 18 (22.2) 20 (24.7) 36 (44.4) 74 (91.4)
≤ 3 1 (1.2) 5 (6.2) 1 (1.2) 7 (8.6)
Ability to work with multiple worksheets, n (%)
≥ 4 18 (22.2) 20 (24.7) 35 (43.2) 73 (90.1)
≤ 3 1 (1.2) 5 (6.2) 2 (2.5) 8 (9.9)
Ability to salve data to open later, n (%)
≥ 4 18 (22.2) 20 (24.7) 36 (44.4) 74 (91.4)
≤ 3 1 (1.2) 5 (6.2) 1 (1.2) 7 (8.6)
Easy to print data, n (%)
≥ 4 18 (22.2) 23 (28.4) 36 (44.4) 77 (95.1)
≤ 3 1 (1.2) 2 (2.5) 1 (1.2) 4 (4.9)
Ranking of group 2, n (%)
≥ 4 17 (21.0) 21 (25.9) 35 (43.2) 73 (90.1)
≤ 3 2 (2.5) 4 (4.9) 2 (2.5) 8 (9.9)
Outputs of GerminaQuant x Ranal’s worksheets, n (%)
≥ 4 18 (22.2) 24 (29.6) 37 (45.7) 79 (97.5)
≤ 3 1 (1.2) 1 (1.2) 0 (0.0) 2 (2.5)
Outputs of GerminaQuant x Miranda’s worksheets, n
≥ 4 8)
≤ 3 2)
≥ 4 6)
≤ 3 4)
≥ 4 0.0)
≤ 3 0)
≥ 4 4)
When group 2, Software Functions, was analyzed, we
found that 8.6% of the users reported difficulty with data enter
using TAB on the keyboard, and another 8.6% reported some
difficulty in understanding the output data. The difficulty of
data entry using the keyboard was solved by the introduction of alternative data entry methods using a mouse or arrows
on the keyboard. The difficulty in understanding the output
data was resolved by a Help Section, with main questions about the software and its operation. However, only 8.6% of
the users reported difficulty in generating and understanding
a matrix. Therefore, the mean of this group was 4.6 ± 0.6, ranked by 90.1% of the users.
A comparison of GerminaQuant 1.0 with similar software and spreadsheets showed that GerminaQuant 1.0 offers the broadest set of capabilities, including the ability to generate secure output that is reliably, rapidly and highly practical. The simplicity of the graphical interface of GerminaQuant 1.0 was indicated by 67% of the users, demonstrating the ease of understanding the output of GerminaQuant 1.0 compared to other spreadsheets available. All users (100%) reported that this type of software offers an enormous potential for implementation in germination laboratories and seed companies to easily quantify germination parameters (Table 3). Some 97.5%, 93.8% and 92.6% of the users reported that the GerminaQuant 1.0 output was easier to understand than the spreadsheets described by Ranal et al. (2009), Miranda et al. (2014) and Joosen et al. (2010), respectively. Therefore, the mean of this group were 4.7 ± 0.6 ranked by 91.4% of the users. Moreover, 96% of the users reported that GerminaQuant 1.0 could result in time saved for training new laboratory members and those beginners could have more autonomy for studying and organizing their data with having the instructions on hand.
Overall, the users evaluated GerminaQuant 1.0 as very good software, with 97% reporting completely satisfaction with this software. The mean score of GerminaQuant was 4.7 ± 0.6 on the Likert scale. Of the respondents, ~95% reported that GerminaQuant 1.0 is excellent or very good software but should be freely available on the web.
Altogether, the feedback provided a channel for receiving questions, suggestions, or even comments on the software, allowing us to improve the software and making it friendlier to the user. This section was including in Help Section on Send Comments form.
Conclusions
In this article, we describe a PC system, GerminaQuant 1.0, developed to manage and process germination data obtained from distinct experimental designs. GerminaQuant 1.0 features a simple interface to allow researchers who are unfamiliar with computation and statistics to easily obtain the results of germination parameters. One of the most important tasks of GerminaQuant 1.0 is to securely and reliably compute a data set. GerminaQuant 1.0 distinguishes itself from its counterparts by providing more friendly and easy-to-use features for germination measurements. In addition, GerminaQuant 1.0 has proved to be more useful for horticultural crop seeds with a long germination time than for those with rapid germination because the former generate a longer mathematical matrix; thus, GerminaQuant 1.0 can likely produce a more precise germination assessment. Indeed, we believe that GerminaQuant 1.0 is an important research tool and will be an important medium for establishing computational approaches within the community
Graduate students
Researcher and associate professor
Undergraduates and professionals
All together
Outputs of GerminaQuant x Miranda’s worksheets, n
(%)
≥ 4 17 (21.0) 24 (29.6) 35 (43.2) 76 (93.8)
≤ 3 2 (2.5) 1 (1.2) 2 (2.5) 5 (6.2)
Outputs of GerminaQuant x Joosen’s worksheets, n
(%)
≥ 4 19 (23.5) 22 (27.2) 34 (42.0) 75 (92.6)
≤ 3 0 (0.0) 3 (3.7) 2 (3.7) 6 (7.4)
Potential for implementation of software, n (%)
≥ 4 19 (23.5) 25 (30.9) 37 (45.7) 81 (100.0)
≤ 3 0 (0.0) 0 (0.0) 0 (0.0) 0 (0.0)
Ranking of group 3, n (%)
≥ 4 17 (21.0) 22 (27.2) 35 (43.2) 74 (91.4)
≤ 3 2 (2.5) 3 (3.7) 2 (2.5) 7 (8.6)
Note: Percentage that do not add to 100 are the results of missing values.
of experimental seed biologists. An appropriate integration between automated germination counts with GerminaQuant 1.0 could contribute to more detailed information on the vigor of seed lots. The full GerminaQuant package (for Windows®,
Macintosh®, and Linux® systems) is freely available for the scientific community and can be easily downloaded from the
website (http://www.ufpe.br/lev).
Moreover, a more interactive interface can be created in the future versions of GerminaQuant, and it can be made
into a more efficient executable application. In the future
versions, the software could be expanded by the addition of new parameters, such as the capability of calculating
cumulative germination over time and automatically fitting
the germination parameters on graphs. The increasing power and availability of inexpensive, hand-held devices, including smartphones and tablets, may lead to a number of applications for this software if a mobile version is created in the future.
Acknowledgement
The authors would like thanks to National Council for
Scientific and Technological Development, CNPq (Grants
470476/2011-7) and Foundation for Science and Technology
of Pernambuco (Grants BIC-0139-2.03/13) for financial supporting this research and scholarship to the first author.
References
BASKIN, C.C. ;BASKIN, J.M. Seeds: Ecology, biogeography and evolution of dormancy and germination. San Diego, California: Academic Press, 1998.666p.
BLANCHETTE, J.; SUMMERFIELD, M. C++ GUI Programming with Qt 4. Summerfield: Prentice Hall, 2006.576p.
DELL’AQUILA, A. New perspectives for seed germination testing through digital imaging technology. The Open Agriculture Journal, v.3, n.3, p.37-42, 2009. http://benthamopen.com/contents/pdf/TOASJ/TOASJ-3-37.pdf
EZUST, A.; EZUST, P. An Introduction to Design Patterns in C++ with Qt 4. Upper Saddle River, NJ: Pearson Education, Inc, 2006.656p.
HOFFMASTER, A.L., XU, L., FUJIMURA, K., MCDONALD, M.B., BENNET, M.A. ;EVANS, A.F. The OSU seed vigor imaging system (SVIS) for soybean and corn seedlings. Seed Technology, v.27, n.1, p.7-24, 2005. http://europepmc. org/abstract/AGR/IND43733850;jsessionid=VJTfPxZ8CBOUNhn40tKt.12
JOOSEN, R.V.L.; KODDE, J.; WILLEMS, L.A.J.; LIGTERINK, W.; VAN DER PLAS, L.H.W.; HILHORST, H.W.M. Germinator: a software package for high-throughput scoring and curve fitting of Arabidopsis seed germination. Plant Journal, v.62, n.1, p.148-159, 2010. http://onlinelibrary. wiley.com/doi/10.1111/j.1365-313X.2009.04116.x/pdf
LIKERT, R. A technique for the measurement of attitudes. Archives of Psychology, v.140, n.1, p.44-53, 1932.
MIRANDA, R.Q.; CORREIA, R.M.; ALMEIDA-CORTEZ, J.S.; POMPELLI, M.F. Germination of Prosopis juliflora (Sw.) D.C seeds at different osmotic potentials and temperatures. Plant Species Biology, v.29, n.3, p. 9-20, 2014. http://onlinelibrary.wiley.com/doi/10.1111/1442-1984.12025/epdf
PENFIELD, S.; KING, J. Towards a systems biology approach to understanding seed dormancy and germination. Proceedings Biological Science, v.276, n.1673, p.3561-3569, 2009. http://rspb.royalsocietypublishing. org/content/276/1673/3561
RANAL, M.A.; SANTANA, D.G. How and why to measure the germination process? Revista Brasileira de Botânica, v.29, n., p.1-11, 2006. http://www. scielo.br/pdf/rbb/v29n1/a02v29n1.pdf
RANAL, M.A.; SANTANA, D.G.; FERREIRA, W.R.; MENDES-RODRIGUES, C. Calculating germination measurements and organizing spreadsheets. Revista Brasileira de Botânica, v.32, n.4, p.849-855, 2009. http://www.scielo.br/pdf/rbb/v32n4/a22v32n4.pdf
SAKO, Y.; MCDONALD, M.B.; FUJIMURA, K.; EVANS, A.F. ; BENNET, M.A. A system of automated seed vigour assessment. Seed Science & Technology, v.29, n.3, p.625-636, 2001. http://cat.inist.fr/?aModele=afficheN&cpsidt=14110910
SCHILDT, H. C++ The Complete Reference, 3 ed. Berkeley: Osborne McGraw-Hill, 1998. 1008p.
SINÍCIO, R.; BHERING, M.C.; VIDIGAL, D.S.; DIAS, D.C.F.S. Validação do aplicativo computacional SeedSolve para previsão das perdas de germinação e vigor de sementes armazenadas. Revista Brasileira de Sementes, v.31, n.2, p.9-18, 2009. http://www.scielo.br/pdf/rbs/v31n2/ v31n2a01
TIOBESOFTWARE (2014) TIOBE Index for March 2014. March Headline: F# on its way to the top 10. Eindhoven. The Netherlands, TIOBE Software. The software quality company. 14p. Available: http://www.tiobe.com/index. php/content/paperinfo/tpci/index.html Accessed on: August 25th, 2015.