Imaging Assessment of Visceral Adipose Tissue Area and Its
Correlations with Metabolic Alterations
Anna Karla Carneiro Roriz, Adriana Lima Mello, Juliana Fontes Guimarães, Fabiana Cajuhy dos Santos, Jairza
Maria Barreto Medeiros, Lílian Ramos Sampaio
Escola de Nutrição da Universidade Federal da Bahia (UFBA), Salvador, BA - Brazil
Mailing address: Anna Karla Carneiro Roriz •
Avenida Araújo Pinho, 32 - Canela - 40110-150 - Salvador, BA - Brazil E-mail: [email protected], [email protected]
Manuscript received December 07, 2009; revised manuscript received June 18, 2010; accepted July 16, 2010.
Abstract
Background: Androgenic obesity is associated with a higher risk of metabolic disorders, thus favoring the occurrence of cardiovascular diseases and other morbidities.
Objective: To verify the influence of the visceral adipose tissue (VAT) area, measured by computed tomography (CT), on the metabolic alterations in adult and elderly individuals.
Methods: CT results and lipoprotein levels, total cholesterol and fractions, triglycerides, glycemia and uric acid levels, were obtained from 194 individuals stratified by sex, age group and body mass and analyzed using the tests of correlation and means.
Results: The elderly individuals presented higher VAT area, glycemia, uric acid and total cholesterol levels. The most important correlations were observed between VAT area, triglycerides (TG) and VLDL-c (r > 0.5; p < 0.01), in both age groups. The mean VAT area was always higher when TG and glycemia levels were altered, in both age groups.
Conclusion: Most tests showed a strong correlation with VAT area, which was considered as risk for metabolic alterations. In elderly individuals, the risk VAT area seems to be higher than that of adult individuals. (Arq Bras Cardiol 2010;95(6):698-704)
Keywords: Abdominal fat; lipoproteins; blood glucose; uric acid; computed tomography.
Introduction
Androgenic obesity, represented by the excess deposition of visceral abdominal adipose tissue, is associated with a higher risk of metabolic and hemodynamic disorders and favors the occurrence of events, such as arterial hypertension, atherogenic cardiovascular disease, diabetes mellitus, gout and coronary disease1-3, increasing the need for medication
use and interfering with the quality of life.
The literature has pointed out several physiopathological mechanisms to explain such association, although they are yet to be elucidated2,4-6. A large number of endocrine alterations
is more frequent in the presence of visceral obesity, when compared to the peripheral obesity, due to the differentiation in the metabolic and endocrine activity, more active in the visceral adipose tissue (VAT)5,7,8.
Among the physiological characteristics of visceral adipocytes is such differentiation, as the VAT presents: more cells per mass unit; higher blood flow; more glucocorticoid receptors (cortisol); more androgen receptors (testosterone);
higher catecholamine-induced lipolysis. Moreover, the VAT presents lower insulin sensitivity and contribution to lipolysis, by showing a faster insulin-receptor dissociation7,8.
According to several authors2,9,10, the metabolic alterations,
which include dyslipidemia, insulin resistance and morbidities such as hypertension and cardiovascular disease, are independent from the degree of obesity and are of equal magnitude for both sexes, with the visceral tissue being the probable mediator of this association.
The most accurate methods used in the characterization of this visceral fat are high-cost and difficult to perform. To directly quantify this compartment, the imaging technique, such as computed tomography (CT), is used, which is considered the “gold-standard”, with high reproducibility11, albeit with little
applicability in clinical and epidemiological practice. The cutoff
of the visceral adipose tissue (VAT) area ≥ 130 cm² is the one
considered in most studies as excess of visceral adipose tissue and establishing the risk for the development of metabolic alterations, cardiovascular diseases and other morbidities12-14.
Materials and methods
Patients
The present was a cross-sectional study carried out at the Escola de Nutrição da Universidade Federal da Bahia (UFBA), during the first trimester of 2009. A total of 194 individuals, aged > 20 years volunteered for the study, from the outpatient clinic and the community. They were stratified by sex, age and body mass determined by the BMI (body mass index = kg/m²).
Individuals with BMI > 40 kg/m², those presenting severe malnutrition and severe disorders (neural sequelae, dystrophy), as well as pregnant and nursing women, individuals who had recently undergone abdominal surgery or presented tumors, hepatomegaly, splenomegaly or ascites or any problem that could compromise the recommended technique to measure the visceral fat by CT were excluded from the study.
All volunteers were submitted to a blood sample collection in a private laboratory and CT. They had fasted for 12 hours. The blood samples were used to measure serum lipoprotein levels: total cholesterol (TC), high-density lipoprotein cholesterol (HDL-c), low-density lipoprotein cholesterol (LDL-c), very-low density lipoprotein cholesterol (VLDL-c), triglycerides (TG), as well as glycemia and uric acid levels. All results were returned to the participants for follow-up and/or treatment and they were also referred to nutritional consultation given by professionals from one of the Ambulatories of Nutrition at Professor Francisco Magalhães Netto Ward of Hospital Universitário Professor Edgar Santos (HUPES).
Biochemical analyses
Glycemia, TC and fractions, TG and uric acid were quantified in sera, using a colorimetric system, dry chemistry method, with kits manufactured by Ortho-Clinical Diagnostics™, Rochester, NY and the values considered normal were the ones described in Table 1.
The LDL and VLDL values were calculated using the following formulas: LDL = CT – (HDL – VLDL); VLDL = Triglycerides/5, with CT = total cholesterol, HDL = high-density lipoprotein cholesterol, VLDL = very-low high-density lipoprotein cholesterol. All TG values > 400 mg/dl were excluded from the sample, as they prevented the calculation of the LDL-c and VLDL-c levels and also could interfere with the other assessments.
Computed tomography to evaluate the VAT area
The computedtomographies were obtained using a Spirit Siemens CT scanner from the Service of Radiology of Hospital Universitário and they were analyzed by a same observer. The examination was initiated under complete 4-hour fasting, with the patient on dorsal decubitus and the arms extended above the head. For the precise identification of the L4-L5, a lateral topogram was performed and then a single axial tomographic slice was performed on this site, with a thickness of 10 mm and exposure time of 3 seconds.
After the slice was obtained, using a free electronic cursor that contemplated the external borders that limit the abdominal circumference, the outer limits of the abdomen were delimitated and then, the total abdominal area was calculated. After the measurement of the total abdominal area, the visceral abdominal area was also delimitated, with a free cursor, which corresponded to the area of visceral fat. That was determined by the detection of the abdominal cavity, considering as limits the inner borders of the rectus abdominis, internal oblique and quadratus lumborum muscles, excluding the vertebral body and including the retroperitoneal, mesenteric and omental fat. The areas of fat were described in square centimeters. The subcutaneous abdominal area was calculated by subtracting the total abdominal area from the visceral abdominal area18.
No barium or organic iodinated contrast media were administered. The tomographer program was used to examine the abdomen with radiographic parameters of 140 kV and 45 mA. To identify the adipose tissue, a density of -50 and -150 Hounsfields units were used. An area of visceral tissue ≥ 130 cm² was considered as excess of visceral adipose tissue and a risk for the development of cardiovascular diseases12.
In this study, the selected individuals were associated or not to the Basic Health Units, in order to achieve a higher degree of group representativeness equivalently in terms of visceral fat, as the presence/absence of morbidities influences this amount of fat.
Statistical analysis
The statistical analysis was carried out using the software SPSS, release 11.5. The normality of the variables’ distribution was determined based on the Kolmogorov-Smirnov test. The variables with a normal distribution were expressed as means and standard deviations. The variables without a normal distribution are presented as medians and maximum and minimum values.
When comparing the two study groups, the normal numerical variables were analyzed using the Student’s t test and the non-normal ones, by Mann-Whitney U-test. Pearson’s
Table 1 - Reference values for the performed laboratory tests
Biochemical data Reference value
Glycemia(I) < 100 mg/dl
Triglycerides(II) < 150 mg/dl
Total Cholesterol (II) < 200 mg/dl
LDL-c(II) < 160 mg/dl
HDL-c(II)
Male sex > 40 mg/dl
Female sex > 50 mg/dl
VLDL-c(II) < 50 mg/dl
Uric acid (III)
Male sex 3.5 - 8.5 mg/dl
Female sex 2.5 - 6.2 mg/dl
Sources: I - Guideline of the Brazilian Society of Diabetes, 200815; II – IV
Brazilian Guidelines on Dyslipidemias and Atherosclerosis Prevention, 200716;
correlations were carried out for a normal distribution and Spearman’s correlations for a non-normal distribution between the area of visceral fat and the biochemical tests. The mean test was carried out to verify differences between the measurement of the visceral area at the CT, according to the cutoffs of the lipid profile, glycemia and uric acid. Differences between the
variables were considered significant when p ≤ 0.05.
The study was approved by the Research Ethics Committee of Escola de Nutrição da UFBA (protocol # 01/09) and all subjects signed the Free and Informed Consent Form before enrollment.
Results
Of the 194 participants, 97 were adults with a mean age of 39.53 years and 97 were elderly individuals with a mean age of 72.97 years. Table 2 presents the descriptive values of the studied variables.
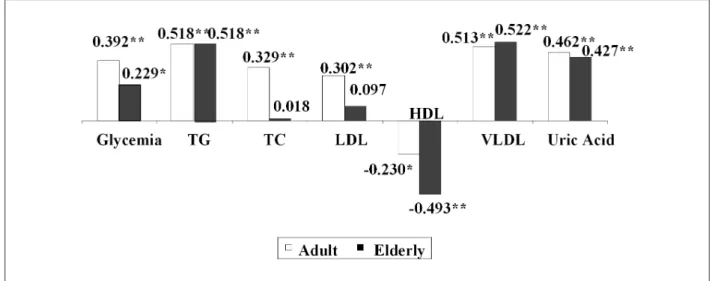
In the male sex, there was a statistically significant difference in the means of VAT area, glycemia, LDL-c and uric acid between adult and elderly individuals. In this study, only 08 individuals were identified with glycemia levels > 126 mg/dl, with the elderly presenting a higher median value when compared to the adult individuals. Only 19 individuals presented TG levels > 200 mg/dl. It was verified that the highest mean values of VAT area were observed in the elderly individuals of both sexes. There was no difference between the mean values of HDL in both men and women. Except for the HDL levels, elderly women presented higher levels of all biochemical parameters when compared to the adult women. The analyses of the correlations between the biochemical assessments and VAT area considered to be excessive identified by the CT, according to the age groups, are shown in Figure 1. Most of the biochemical variables presented a strong correlation with the VAT area and, among them, the serum levels of TG and VLDL-c (both with r > 0.51; p < 0.01) and uric acid (r > 0.42; p< 0.01) presented the highest correlations with this area in both age groups, followed by a good correlation between the glycemia, TC, LDL-c and VAT area in adult individuals. Total cholesterol and LDL-c were the variables that presented the lowest correlations,
especially among the elderly individuals, and were not statistically significant. An inverse correlation was observed between the serum levels of HDL-c and VAT area, mainly in elderly individuals.
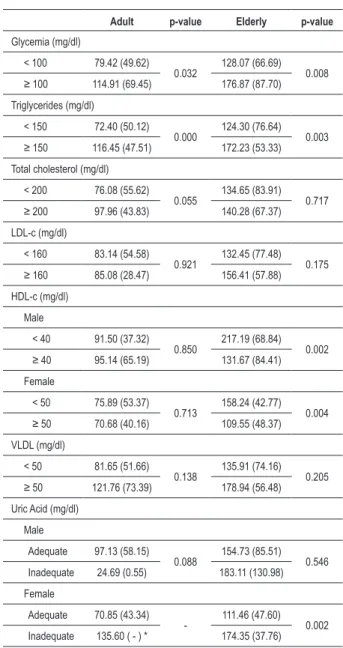
Table 3 presents the mean area of visceral adipose tissue in adult and elderly individuals according to the cutoffs recommended as normal and abnormal values (Table 1) for glycemia, triglycerides, total cholesterol, LDL-c , HDL-c , VLDL-c and uric acid. The mean VAT area showed to be always higher when the TG and glycemia levels were altered in both age groups, as well as for uric acid, only in elderly women, being statistically significant. The mean VAT area did not present difference between the normal and elevated values of LDL-c and VLDL-c in the two studied groups. The inverse association between the VAT area mean and the HDL-c levels was observed only in elderly individuals of both sexes (p < 0.05).
Discussion
The present is a pioneer study in Brazil, mainly because it assesses the association between biochemical assessments and the area of visceral adipose tissue, identified by CT in different age groups. In other studies on visceral fat measured by CT 1,19-23, the same biochemical tests were used only to characterize
the population, categorize risk factors for a certain morbidity or correlate with other indicators, limiting the comparison of such results with those presented in this study.
Moreover, the absence of analysis according to age range in other studies, as well as categorizations by body mass and sex, which was not performed in most of the studies and the variations in the methodology used can be responsible for the different results obtained.
Currently, the computed tomography (CT) is considered the method that best identifies the area of visceral fat. Among the several cutoffs for the identification of the excess of this
fat by CT, most studies indicate an area ≥ 130 cm² as the
cutoff associated with the development of cardiovascular diseases and other morbidities12-14. According to Rankinen
et al24, values from 150 to 200 cm2 have been considered as
representing very high levels of visceral adipose tissue. Bouza et al25, when assessing 108 patients aged 18 to 78 years,
Table 2 - Descriptive values of the analyses of biochemical tests and visceral fat tissue area in adult and elderly individuals, according to the sex - Salvador, 2009
Variables (n = 194) Male p-value Female p-valor
Adult (n = 49) Elderly (n = 47) Adult (n = 48) Elderly (n = 50)
VAT area 94.18 (± 58.74) 157.14 (± 88.65) 0.000 72.20 (± 43.88) 120.26 (± 51.02) 0,000
Glycemia 87.00 (71 - 253) 92.00 (69 - 198) 0.020 82.00 (69 - 116) 88.50 (76 - 117) 0,000
TG 123.00 (43 - 349) 116.00 (49 - 300) 0.575 83.50 (35 - 261) 113.0 (40 - 363) 0,011
TC 187.22 (± 39.90) 202.30 (± 35.02) 0.052 192.85 (± 40.19) 228.54 (± 52.09) 0,000
LDL-c 114.65 (± 31.50) 128.46 (± 32.92) 0.038 114.45 (± 36.92) 143.40 (± 52.06) 0,002
HDL-c 47.80 (± 10.31) 48.38 (± 12.62) 0.803 57.54 (± 12.77) 58.42 (± 15.79) 0,763
VLDL-c 24.00 (8 - 69) 23.0 (1.6 - 66) 0.679 16.00 (7 - 52) 22.0 (8 - 72) 0,016
Uric acid 5.29 (± 1.09) 5.94 (± 1.36) 0.010 4.15 (± 0.98) 4.84 (± 1.30) 0,004
Figure 1 -Coeficient of correlation between the biochemical tests and the VAT area according to the age range - Salvador, 2009. TG - triglycerides; TC - total cholesterol;
LDL-c - low-density lipoprotein ; HDL-c - high-density lipoprotein; VLDL-c - very-low density lipoprotein. * p < 0.05; ** p < 0.01.
observed a mean that was markedly higher (197.5 cm²) than this cutoff; however, they did not stratify the participants by sex. Sampaio et al26, evaluating adult and elderly Brazilians,
identified a mean VAT area of 102.5 cm² for the male sex and 84.1 cm² for the female sex.
In the present study, the mean VAT area values were higher in the elderly group and a mean > 130 cm2 was observed only
in male elderly individuals. There is scientific evidence that, in both sexes, an increase in the amount of visceral adipose tissue occurs with age and that regardless of the body mass, the accumulation of visceral fat is more predominant in men than in women27, although abdominal obesity is common in
post-menopausal women28.
The visceral adiposity associates with hypertriglyceridemia, decrease in HDL-c, adequate levels of LDL-c and increase in small and dense LDL-c2, which increases the atherogenic risk
in these individuals3,29, characterizing a dyslipidemia with
considerable risk of cardiovascular morbimortality30, 31.
It is known that the visceral fat is highly lipolytic8,27 and
that one of the best known mechanisms is the direct draining to the liver through the portal system, leading to an excess flow of non-esterified fatty acids. Such phenomenon triggers a series of alterations, such as for instance, the overproduction of VLDL-c and, indirectly, of LDL-c, which can result in hypertriglyceridemia and hypercholesterolemia28.
According to Wajchenberg27, the visceral adipose tissue
would have a limited capacity to prevent the fatty acids from reaching the hepatocytes, which can contribute to the metabolic abnormalities observed in the presence of visceral obesity.
The results of the present study showed that elderly women presented higher mean values of all biochemical tests, except HDL-c, when compared to the adult women. This result is expected, as this age group is more affected by factors that promote these metabolic alterations. The natural aging process associated to life habits, such as poor nutritional habits and sedentary lifestyle collaborates to the development of alterations in body composition and the metabolism of
lipids and carbohydrates32. In addition to the aforementioned
mechanisms, it is evident that the presence of diseases and stress can influence the levels of these tests, which are frequent conditions in elderly individuals33.
Therefore, the interpretation of the biochemical assessments, especially the lipid profile, must be associated with complementary information on the aforementioned conditions. Among these, we highlight the use of medications, where, in this study, 56.8% of the individuals reported the use of some type of medication (data not shown), which might have influenced the observed results. However, although important, this variable was not considered due to the great difficulty to control it, especially among the elderly.
The strong correlation between the VAT area and the TG, VLDL-c and uric acid levels in adult and elderly individuals indicates a direct association between them; however, the specific mechanisms involved in this association are yet to be clarified. However, it is noteworthy the fact that TG represent 99.0% of the circulating fat and are substrates for the formation of VLDL. Thus, the increase in their levels is almost always accompanied by hypercholesterolemia16.
On the other hand, an inverse correlation was observed between VAT area and HDL-c, which characterizes the most important cardioprotective factor, especially in elderly individuals, demonstrating its reverse effect for a VAT area considered as being of risk. Several studies have demonstrated the association between the serum levels of high-density lipoproteins (HDL-c) and cardiovascular disease. Decreased HDL-c levels are present in approximately 10.0% of the population and these individuals could be incapable of effectively eliminating the cholesterol excess from the vascular walls, contributing to the inflammatory process and characterizing the pathogenesis of atherosclerosis in its initial phases, in addition to having anti-atherogenic effects, such as anti-oxidant effects and others34.
Table 3 - Means and standard deviation of VAT area, in relation to biochemical tests, according to the age range - Salvador, 2009
Adult p-value Elderly p-value
Glycemia (mg/dl)
< 100 79.42 (49.62)
0.032 128.07 (66.69) 0.008 ≥ 100 114.91 (69.45) 176.87 (87.70)
Triglycerides (mg/dl)
< 150 72.40 (50.12)
0.000 124.30 (76.64) 0.003 ≥ 150 116.45 (47.51) 172.23 (53.33)
Total cholesterol (mg/dl)
< 200 76.08 (55.62)
0.055 134.65 (83.91) 0.717
≥ 200 97.96 (43.83) 140.28 (67.37)
LDL-c (mg/dl)
< 160 83.14 (54.58)
0.921 132.45 (77.48) 0.175
≥ 160 85.08 (28.47) 156.41 (57.88)
HDL-c (mg/dl)
Male
< 40 91.50 (37.32)
0.850 217.19 (68.84) 0.002
≥ 40 95.14 (65.19) 131.67 (84.41)
Female
< 50 75.89 (53.37)
0.713 158.24 (42.77) 0.004
≥ 50 70.68 (40.16) 109.55 (48.37)
VLDL (mg/dl)
< 50 81.65 (51.66)
0.138 135.91 (74.16) 0.205
≥ 50 121.76 (73.39) 178.94 (56.48)
Uric Acid (mg/dl)
Male
Adequate 97.13 (58.15)
0.088 154.73 (85.51) 0.546 Inadequate 24.69 (0.55) 183.11 (130.98)
Female
Adequate 70.85 (43.34)
- 111.46 (47.60) 0.002 Inadequate 135.60 ( - ) * 174.35 (37.76)
VAT - visceral adipose tissue; LDL-c - low-density lipoprotein; HDL-c - high-density lipoprotein; VLDL-c - very-low high-density lipoprotein. (p < 0.05). *Only one case found.
literature about the correlation between this biochemical variable and the visceral fat measured by CT, in addition to the fact that its mechanism is yet to be fully elucidated23,35.
A hypothesis has been formulated, being that uric acid is related to hypertension, dyslipidemia and glucose metabolism impairment, being capable of having a causal function in the pathogenesis of cardiovascular disease and therefore, representing a risk marker for these diseases36,37.
The present study showed that TC and LDL-c presented a low correlation with VAT areain elderly individuals; however, the analysis was statistically significant. Nevertheless, there are no data in the literature that can explain such observation. On the other hand, there are studies that suggest assessing
the cholesterol as an index and not separately, such as the TC/HDL-c ratio, considered a potent predictive indicator for coronary disease38,39 due to the probability of high
atherogenic effect29.
Further studies are necessary to evaluate the correlation between the cholesterol levels and VAT area.
The mean VAT area levels were markedly higher than the value of 130 cm², when the cutoffs of TG and glycemia, in both adult and elderly individuals, and of uric acid, only in elderly women, were above those recommended as normal values12-14.
In elderly individuals, when the cutoff values of HDL-c were < 40 mg/dl for men and < 50 mg/dl for women, the mean VAT area was also much higher than 130 cm². Nilsson et al40 concluded that there is a significant association
between decreased serum levels of HDL-c and cardiovascular morbimortality in men, but not in women and that elderly men with levels of HDL-c < 40 mg/dl deserve particular attention regarding the prevention of cardiovascular diseases.
When verifying that the VAT area mean was higher in elderly individuals of both sexes, the results suggest that the VAT area considered of risk for the onset of metabolic alterations in elderly individuals perhaps should be considered from a cutoff higher than that recommended for adult individuals, i.e., > 130 cm².
In conclusion, the present study confirms the importance of investigating the visceral adipose tissue, demonstrating that most of the biochemical parameters analyzed presented a strong correlation with the VAT area identified by CT in adult and elderly individuals and, among them, especially TG, VLDL-c and uric acid, which presented better correlations.
Considering that the VAT area and the values of this area related to metabolic alterations were higher in elderly individuals, it correct to affirm that a VAT area that establishes risk in these individuals seems to be higher than that in adults. Thus, new investigations are necessary on this subject, including other age groups and different cutoffs for VAT area, to allow a better strategy for risk assessment and health-complication prevention.
However, it is necessary to acknowledge that the biochemical tests performed in the present study are indicators of risk for cardiovascular diseases and not of diagnosis. Hence, other variables must be considered in these assessments, such as the use of medications, pathologies, lifestyle,socioeconomic status and diet, as they are strongly associated with metabolic alterations.
Acknowledgements
The authors would like to thank Conselho Nacional de Desenvolvimento Científico e Tecnológico (CNPq) for the financial support, Coordenação de Aperfeiçoamento de Pessoal de Nível Superior (CAPES) for the Master’s Degree grant and HUPES for the scientific partnership.
Potential Conflict of Interest
Sources of Funding
This study was funded by CNPq.
Study Association
This article is part of the thesis of master submitted by Anna Karla Carneiro Roriz, from Universidade Federal da Bahia.
References
1. Silva EA, Flexa F, Zanella MT. Impact of abdominal fat and insulin resistance on arterial hypertension in non-obese women. Arq Bras Endocrinol Metab. 2009; 53 (3): 340-3.
2. Barroso SG, Abreu VG, Francischetti EA. A participação do tecido adiposo visceral na gênese da hipertensão e doença cardiovascular aterogênica: um conceito emergente. Arq Bras Cardiol. 2002; 78 (6): 18-30.
3. Lima AL, Glaner MF. Principais fatores de risco relacionados às doenças cardiovasculares. Rev Bras Cineantropom Desempenho Hum. 2006; 8 (1): 96-104.
4. Ribeiro Filho FF, Mariosa LS, Ferreira SRG, Zanella MT. Gordura visceral e síndrome metabólica: mais que uma simples associação. Arq Bras Endocrinol Metab. 2006; 50 (2): 230-8.
5. Hermsdorff HHM, Monteiro JBR. Gordura visceral, subcutânea ou intramuscular: onde está o problema? Arq Bras Endocrinol Metab. 2004; 48 (6): 803-11.
6. Eckel RH, Barouch WW, Ershow AG. Report of the national heart, lung, and blood institute-national institute of diabetes and digestive and kidney diseases working group on the pathophysiology of obesity-associated cardiovascular disease. Circulation. 2002; 105 (24): 2923-8.
7. Arner P. The adipocyte in insulin resistance: key molecules and the impact of the thiazolidinediones. Trends Endocrinol Metab. 2003;14 (3): 137-45.
8. Kelley DE, Thaete FL, Troost F, Huwe T, Goodpaster BH. Subdivisions of subcutaneous abdominal adipose tissue and insulin resistance. Am J Physiol Endocrinol Metab. 2000; 278 (5): 941-8.
9. Jensen MD. Role of body fat distribution and the metabolic complications of obesity. Supplement review. J Clin Endocrinol Metab. 2008; 93 (11): 57-63.
10. Zanella MT. Obesidade e fatores de risco. In: Mion Jr D, Nobre F. Risco cardiovascular global: a teoria aplicada à prática. São Paulo: Lemos Editorial; 2000. p. 109-24.
11. Svendsen OL, Hassager C, Bergmann I, Christiansen C. Measurement of abdominal and intra-abdominal fat in postmenopausal women by dual energy X-ray absorptiometry and anthropometry: comparison with computerized tomography. Int J Obes. 1993; 17 (1): 45-51.
12. Despres JP, Lamarche B. Effects of diet and physical activity on adiposity and body fat distribution: implications for the prevention of cardiovascular disease. Nutr Res Rev. 1993; 6 (1): 137-59.
13. Lemieux S, Prud’homme D, Bouchard C, Tremblay A, Després JP. A single threshold of waist girth identifies normal weight and overweight subjects with excess visceral adipose tissue. Am J Clin Nut. 1996; 64 (5): 685-93.
14. Hunter GR, Snyder SW, Kekes-Szabo T, Nicholson C, Berland L. Intra-abdominal adipose tissue values associated with risk of possessing elevated blood lipids and blood pressure. Obes Res. 1994; 2 (6): 563-8.
15. Milech A, Costa e Forti A, Golhert A, Ramalho AC, Lerario AD, Pires AC, et al. Sociedade Brasileira de Diabetes. Diretrizes sobre tratamento e acompanhamento do Diabetes Mellitus. [Acesso em 2009 dez 10]. Disponível em http://www.diabetes.org.br/educacao/docs/diretrizes.pdf.
16. Sposito A, Caramelli B, Fonseca FAH, Bertoz MC. Sociedade Brasileira de Cardiologia. IV Diretrizes brasileiras sobre dislipidemias e prevenção da aterosclerose. Arq Bras Cardiol. 2007; 88 (supl I): 1-19.
17. Tietz NW. Clinical guide to laboratory tests. 3rd ed. Philadelphia: WB Saunders; 1995.
18. Seidell JC, Oosterlee A, Thijssen MA, Burema J, Deurenberg P, Hautvast JG, et al. Assessment of intra-abdominal and subcutaneous abdominal fat:
relation between anthropometry and computed tomography. Am J Clin Nutr. 1987; 45 (1): 7-13.
19. Fox CS, Massaro JM, Hoffmann U, Pou KM, Maurovich-Horvat P, Liu C-Y, et al. Abdominal visceral and subcutaneous adipose tissue compartments: association with metabolic risk factors in the framingham heart study. Circulation. 2007; 116: 39-48.
20. Kuk JL, Katzmarzyk PT, Nichaman MZ, Church TS, Blair SN, Ross R. Visceral fat is an independent predictor of all-cause mortality in men. Obesity. 2006; 14 (2): 336-41.
21. Onat A, Avc G, Barlan MM, Uyarel H, Uzunlar B, Sansoy V. Measures of abdominal obesity assessed for visceral adiposity and relation to coronary risk. Int J Obes. 2004; 28 (8): 1018–25.
22. Nicklas BJ, Penninx BW, Cesari M, Kritchevsky SB, Newman AB, Kanaya AM, et al. Association of visceral adipose tissue with incident myocardial infarction in older men and women. Am J Epidemiol. 2004; 160 (8): 741-9.
23. Fang J, Alderman MH. Serum uric acid and cardiovascular mortality: the NHANES I epidemiologic follow-up study, 1971-1992. JAMA. 2000; 283 (18); 2404-10.
24. Rankinen T, Kim SY, Pérusse L, Després JP, Bouchard C. The prediction of abdominal visceral fat level from body composition and anthropometry: ROC analysis. Int J Obes. 1999; 23 (8): 801-9.
25. Bouza A, Bellido D, Rodríguez B, Pita S, Carreira J. Estimacíon de la grasa abdominal visceral y subcutánea en pacientes obesos a través de ecuaciones de regressíon antropométricas. Rev Esp Obes. 2008; 6 (3): 153-62.
26. Sampaio LR, Simões EJ, Assis AMO, Ramos LR. Validity and reliability of the sagittal abdominal diameter as a predictor of visceral abdominal fat. Arq Bras Endocrinol Metab. 2007; 51 (6): 980-6.
27. Wajchenberg BL. Subcutaneous and visceral adipose tissue: their relation to the metabolic syndrome. Endocr Rev. 2000; 21 (6): 697-738.
28. França AP, Aldrighi JM, Marucci MFN. Fatores associados à obesidade global e à obesidade abdominal em mulheres na pós-menopausa. Rev Bras Saude Mater Infant. 2008; 8 (1): 65-73.
29. Després JP, Lemieux I, Prud’homme D. Treatment of obesity: need to focus on high risk abdominally obese patients. Br Med J. 2001; 322 (7288): 716-20.
30. Clarke R, Emberson JR, Parish S, Palmer A, Shipley M, Linksted P, et al. Cholesterol fractions and apolipoproteins as risk factors for heart disease mortality in older men. Arch Intern Med. 2007; 167 (13): 1373-8.
31. Schatz IJ, Masaki K, Yano K, Chen R, Rodriguez BR, Curb JD. Cholesterol and all-cause mortality in elderly people from the Honolulu Heart Program: a cohort study. Lancet. 2001; 358 (9279): 351-5.
32. Silva DA, Felisbino-Mendes MS, Pimenta AM, Grazzinelli A, Kac G, Velásquez-Meléndez G. Distúrbios metabólicos e adiposidade em uma população rural. Arq Bras Endocrinol Metab. 2008; 52 (3): 489-98.
33. Sampaio LR. Avaliação nutricional e envelhecimento. Rev Nutr. 2004; 17 (4): 507-14.
34. Lima ES, Couto RD. Estrutura, metabolismo e funções fisiológicas da lipoproteína de alta densidade. J Bras Patol Med Lab. 2006; 42 (3): 169-78.
35. Lehto S, Niskanen L, Ronnemaa T, Laakso M. Serum uric acid is a strong predictor of stroke in patients with non-insulin-dependent diabetes mellitus. Stroke. 1998; 29 (3): 635-9.
Metab. 2006; 50 (2): 360-7.
37. Culleton BF, Larson MG, Kannel WB, Levy D. Serum uric acid and risk for cardiovascular disease and death: the Framingham Heart Study. Ann Intern Med. 1999; 131 (1): 7-13.
38. Scarsella C, Després JP. Tratamiento de la obesidad: necesidad de centrar la atención en los pacientes de alto riesgo caracterizados por la obesidad abdominal. Cad Saude Publica. 2003; 19 (1): 7-19.
39. Lemieux I, Pascot A, Couillard C, Lamarche B, Tchernof A, Alme´ras N, et al. Hypertriglyceridemic waist: a marker of the atherogenic metabolic triad (hyperinsulinemia, hyperapolipoprotein B, small, dense LDL) in men? Circulation. 2000; 102 (2): 179-84.