Gilson da Silva*
National Industrial Property Institute Rio de Janeiro – Brazil [email protected]
Koshum Iha
Technological Institute of Aeronautics São José dos Campos – Brazil
Andreza M. Cardoso
Institute of Aeronautics and Space São José dos Campos – Brazil [email protected]
Elizabeth C. Mattos
Institute of Aeronautics and Space São José dos Campos – Brazil [email protected]
Rita de Cássia L.Dutra
Institute of Aeronautics and Space São José dos Campos – Brazil [email protected]
* author for correspondence
Study of the thermal
decomposition of
2,2’,4,4’,6,6’- hexanitrostilbene
Abstract: 2,2’, 4,4’, 6,6’- hexanitrostilbene (HNS) is an energetic material, a nitroaromatic compound, with thermal and chemical stabilities, which is employed in the aerospace industry. In this work, the Arrhenius parameters (activation energy and pre-exponential factor) of thermal decomposition reaction were studied and the results were compared with the values reported in the literature. The Kissinger method, applied to DSC’s non-isothermal data of the decomposition temperature was chosen for this study. The activation energy determined for the thermal decomposition of HNS revealed values from 428 kJ.mol-1 to 477 kJ.mol-1, under the experimental
conditions employed.
Keywords: Explosives, HNS, DSC, FT-IR.
Received: 19/09/09
LIST OF SYMBOLS
T Absolute temperature Ea Activation energy
da Among variation of the sample
m Angular coeficient
f Heating rate
k Kinetic constant
f(a) Kinetic function of the thermal decomposition
A Pre-exponential factor dt Time’s variation
R Universal constant of gases
INTRODUCTION
2,2’, 4,4’, 6,6’- hexanitrostilbene (HNS) is a nitroaromatic compound which has high chemical stability, melting point at 318°C and friction and impact sensitivity, 5 Nm and 240 N respectively, (Silva and Iha, 2004). These are the determinant factors for its use in the manufacture of blasting caps, detonation cords and boosters (Harris and Klassen, 2003; Rogers, 1996).
Among the main methods to obtain HNS, we can assert that the process starting from 2,4,6-trinitrotoluene (TNT), by different routes, is the most widely used on
laboratory-scale (Silva, 2007 ) and industrial too, such as the Shipp’s process (Shipp and Spring, 1970).
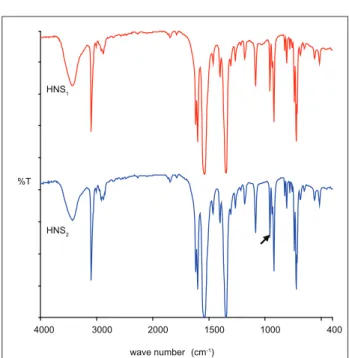
The identiication of HNS obtained from a process using TNT can be easily performed using infrared spectroscopy by means of the analytical band near 957 cm-1, deformation by vibration (wedding) of
wCH=CHtrans. Other small displacements of bands and
changes in the intensity of the bands can also be observed when comparing the HNS and TNT spectra. However, the band near 957 cm-1 is even suficiently resolved to
permit quantitative studies of HNS in the presence of TNT, as described by Silva et al. (2008).
Different thermal analysis techniques such as Differential Scanning Calorimetry (DSC) and Thermogravimetric Analysis (TG) have been widely used in the study of thermal decomposition of energetic materials. In recent work, Silva, Nakamura and Iha (2008) used DSC to study the kinetics of thermal decomposition of pentaerythritol tetranitrate (PETN), the a polymorph of octahydro-1,3,5,7-tetranitro-1,3,5,7-tetrazocine (HMX) (Silva et al., 2003) and to study the kinetics of transition a→dHMX
(Silva and Iha, 2004). Andrade et al. (2007) used DSC and TG in the study of thermal decomposition of composite solid smokeless propellant. Rocco (2004) studied, also using DSC and TG, the aging of formulations of composite solid propellant based on polyurethane binders used in rockets.
Thermogravimetric analysis can also be applied in quantitative determination of different energetic compounds in explosive compositions, as reported by Silva et al. (2008) in a work that compares results of the quantitative determination of TNT and HNS by TG and Fourier Transform Infrared Spectroscopy (FT-IR). The use of thermal analysis techniques is therefore widespread in the study of energetic materials for both aerospace propulsion systems and as suitable material for the manufacture of military warheads. The knowledge of the thermal behavior of an energetic material is essential to guarantee safety during its production, storage and handling.
In general, the kinetic models developed to study the kinetics of solid materials thermal decomposition are in principle based on consideration of the variation in the mass amount of the material in a time function, or the conversion rate of the sample (da/dt), as it is also called, in a process of decomposition due to a thermal stimulation, which can be expressed by Equation 1:
da
dt =kf(a) (1)
where:
da: among variation of the sample;
dt: time variation; k: kinetic constant;
f(a): kinetic function of the thermal decomposition.
The kinetic parameters can be obtained by substituting Arrhenius’s equation, Equation 2, in Equation 1, as shown in Equation 3:
k=
Ae
−Ea RT (2)da
dt =
−Ea RT
Ae
f(a) (3)A: pre-exponential factor; Ea: activation energy;
R: universal constant of gases; T: absolute temperature.
Equation 3 can be written in its integral form as Equation 4:
da
f(a)=
−Ea RT
Ae
0
T
∫
0
a
∫
(4)Replacing the integral of da/f(a) for g(a) and, for a non-isothermic process, considering the temporal variation, f
= dT/dt, we have Equation 5:
g(a)= A ϕ
−Ea RT
e
0
T
∫
dT (5)The Equation 5 was the basis for the development of many models used in the study of thermal kinetic decomposition in solid materials (e.g. Kissinger, Ozawa, Friedman, among others). Since the treatment given to them by Kissinger and Ozawa in the development of their methods was similar, calculating the activation energy by these methods leads to numerical results of the same magnitude.
Kissinger’s method was chosen for use in the present study. It consists basically of Equation 6 (Lee, Hsu and Chang, 2002).
ln ϕ
p
2
T
ln ARp
T
−
E
ap
RT
(6)where:
f is the heating rate (K.s-1);
Tp is the Absolute Temperature of the peak in each heating
rate (K);
A is the pre-exponential factor of Arrhenius (s-1);
R is the gas constant (8,3145 J.mol-1 .K-1);
Ea is the activation energy of the reaction (J.mol-1).
The activation energy may be obtained by means of Differential Scanning Calorimetry data using different heating rates, where displacements occur at the peak of the reaction temperature.
The association of Kissinger’s equation with the line’s equation (y = mx + b), i.e.: y = ln (f / TP2), m =-Ea / R, x
= 1/Tp, b = ln (AR/Tp) enables the determination of Ea’s
value, graphically, as a function of ln (f/TP2) versus 1/Tp,
resulting in a straight line, the slope of which is -Ea/R, and
the linear coeficient ln(AR/Tp).
EXPERIMENTAL
The study was conducted with two samples of HNS: a commercial sample, identiied as HNS1, and a sample produced at the Chemical Laboratory of the Systems of Defense Division (ASD) of the Institute of Aeronautics and Space (IAE) identiied as HNS2. The HNS2 sample was produced by a procedure based on Shipp’s process (Shipp and Spring, 1970). Both samples were previously analyzed by High Performance Liquid Chromatography (HPLC) and showed a close to 100% purity level.
Spectrometric characterization was performed on a FT-IR spectrometer Spectrum 2000 PerkinElmer, region from 4000 to 400 cm-1, resolution of the 4 cm-1, gain 1 and 40 scans.
The samples were analyzed according to the transmission technique, KBr pellets in the proportion 0.8:400 mg.
The DSC analyses were obtained using PERKINELMER (Model DSC-8) equipment. The equipment was calibrated on the heating rates used (f), i.e., 5, 7, 10, 12 and 15ºC/
min, with zinc and indium. The mass of the samples was approximately 1.0 mg. The analyses were performed in a temperature between 50 and 400ºC. The tests were performed under low of nitrogen gas (40 mL/min) and in atmospheric pressure, i.e., the lids of the DSC pans were perforated in order not to conine the explosive.
RESULTS AND DISCUSSION
Analysis by FT-IR
Figure 1 shows the FT-IR spectra of both samples studied in this work. There is, in the HNS2 spectrum, the indication of the characteristic band of 957 cm-1 which, as
mentioned earlier, is one of the main analytical bands of this compound, wCH=CHtrans. It can be seen in Figure
1 that the spectra are very similar, indicating that it is the same organic compound.
Analysis by DSC
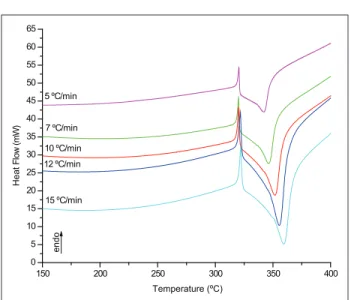
Figures 2 and 3 present the DSC curves of samples HNS1 and HNS2, respectively.
The proile of the thermal curves HNS was similar in both samples. Importantly, with all heating rates used in the experiment, both samples started the decomposition process from the molten state, or possibly in a coexistent state of solid and liquid phases for the same material, since in all DSC curves, we observed an endothermic peak around 318ºC, or immediately prior to the
4000 3000 2000 1500 1000 400
%T
HNS2
HNS1
wave number (cm-1)
Figure 1: FT-IR spectra of HNS samples obtained by trans-mission technique in KBr pellets, in the proportion of sample 0.8 mg to 400 mg KBr
150 200 250 300 350 400
0 5 10 15 20 25 30 35 40 45 50 55 60 65
endo
15oC/min 12oC/min 10oC/min 7oC/min
5oC/min
Heat
Fl
ow
(m
W
)
Temperature (ºC )
Figure 2: DSC curves of thermal decomposition of HNS1 in
an atmosphere of N2
expected behavior for both samples, the DSC data showed that the maximum of the decomposition temperature (Tp)
of the material was altered together with the increase in heating rate (f). The data obtained from the DSC curves
are presented in Table 1.
Lee, Hsu and Chang (2002) studied the decomposition of HNS by DSC technique and heating rates ranging between 5 and 20ºC/min. The peaks of thermal decomposition reported by them ranged between 325 and 343ºC, according to the heating rate used. The activation energy was also determined based on the Kissinger method, and the reported value was 197 kJ.mol-1.
Comparison between the values reported by Lee, Hsu and Chang (2002) and the data presented in this work shows that the peaks of the decomposition temperature were between 10 and 18ºC higher for the commercial sample (HNS1), and between 16 and 22ºC higher for the synthesized sample (HNS2). In line with such variations, the activation energy was also substantially different, in the order of 231 kJ.mol-1, HNS
1, and 280 kJ.mol-1, HNS2.
However, the variation of activation energy between the HNS1 and HNS2 was approximately 50 kJ.mol-1.
In previous studies (Silva, 2004), the activation energy for another energetic material, HMX, was calculated at low
f (ºC/min)
HNS1 HNS2
Temp. decomp. peak (ºC)
Decomp enthalpy (J.g-1)
Temp. of decomp. peak (ºC)
Decomp. enthalpy
(J.g-1)
5 335.7±1.8 4424±59 341.8±1.1 4021±258 7 338.0±2.9 4316±425 347.6±1.0 4016±112
10 349.4±0.4 4409±193 351.9±0.3 4284±249
12 347.4±3.4 4109±267 355.4±0.5 4471±408
15 351.5±2.5 3893±247 359.2±0.2 4029±286
Table 1: Data obtained from the DSC curves of thermal decomposition of HNS
Arrhenius parameters calculation using the Kissinger method
m* R2 E
a (kJ.mol-1) A (s-1)
HNS1 -0.0515 0.8759 428 1.12 . 1036
HNS2 -0.0574 0.9938 477 1.12 . 1040 Table 2: Kinetic parameters of thermal decomposition of HNS
*Angular coeficient Figure 3: DSC curves of thermal decomposition of HNS2 in
an atmosphere of N2
150 200 250 300 350 400
0 5 10 15 20 25 30 35 40 45 50 55 60 65
15 ºC/min 12 ºC/min 10 ºC/min 7 ºC/min 5 ºC/min
endo
Heat
Fl
ow
(m
W
)
Temperature (ºC)
3,00E-06 3,50E-06 4,00E-06 4,50E-06 5,00E-06 5,50E-06 6,00E-06 6,50E-06 7,00E-06 7,50E-06
1,59E-03 1,60E-03 1,61E-03 1,62E-03 1,63E-03 1,64E-03 1,65E-03 1/T p
ln(
φ)
/Tp
2
Figure 4: Kissinger method graph for the determination of activation energy by the thermal decomposition of HNS1
Figure 5: Kissinger method graph for the determination of activation energy by the thermal decomposition of HNS2
3,00E-06 3,50E-06 4,00E-06 4,50E-06 5,00E-06 5,50E-06 6,00E-06 6,50E-06 7,00E-06 7,50E-06
1,57E-03 1,58E-03 1,59E-03 1,60E-03 1,61E-03 1,62E-03 1,63E-03 1/T p
ln(
φ)
/T
p
2
Table 2 shows the values of angular coeficients obtained by linear regression of the points (Figures 4 and 5), the correlation coeficient (R2) for each linear regression,
heating rates (1, 2, 5, 7, 10ºC/min) and high heating rates (10, 12, 15, 17 and 20 ºC/min). Thus, it was observed that for the same energetic material, with the same particle size, granulometric distribution and crystalline structure (a), it is possible to get a variation of 58 kJ.mol-1 due solely to
the heating rates adopted in the experiment. This fact may be justiied by a change in the reaction’s mechanism of thermal decomposition. Also in that study (Silva, 2004), it was found that for the same energetic material, a same organic compound - HMX, in different crystalline forms,
a and b, the activation energy can show a variation of 133
kJ.mol-1, even under the same analytical conditions.
Silva, Nakamura and Iha (2008), in another study conducted with PETN, observed that under different crystalline forms or due to the acidity occluded in the crystals of the same energetic material, the activation energy may change at about 12 kJ.mol-1 through the
thermal decomposition of the material.
Since the particle size, granulometric distribution or cluster formation can change the heat conduction inside the capsule carrier and in the sample itself (Silva, 2007), the values of activation energy for samples of HNS1 and
HNS2, when compared to each other, were satisfactory,
because the samples clearly have different characteristics. HNS1 presents a fuzzy physical structure while HNS2
is a crystalline material with irregular granulometric distribution.
The variation of the activation energy in relation to that described in the literature (Lee, Hsu and Chang, 2002) may be linked to many factors discussed above (particle size, granulometric distribution, cluster formation, changes in the heating rates used, acidity occluded in crystals, among others).
CONCLUSION
The activation energy determined for the thermal decomposition of HNS following the Kissinger method was, in the experimental conditions used, 428 kJ.mol-1 for
HNS1 and 477 kJ.mol-1 for HNS2. It can alter, depending
on the physical (particle size, granulometric distribution or clusters formation) or chemical characteristics (acidity occluded in the crystals) in the sample, and depending on the analytical conditions employed, particularly in relation to heating rate used.
Although the values determined are signiicantly higher than those reported in the literature (Lee, Hsu and Chang 2002), they were considered satisfactory, since the study was conducted using materials with high levels of purity,
as HNS and, especially, since the same analytical conditions were used.
ACKNOWLEDGMENTS
To Systems of Defense Division (ASD), Chemistry Division (AQI) and Materials Division (AMR) of the Institute of Aeronautics and Space (IAE) of the General Command of Aerospace Technology (CTA).
REFERENCES
Andrade, J., Iha, K., Rocco, J.A.F.F., Bezerra, E M., Iha, M.E.V.S., Pinheiro, G.F.M.P., 2007, “Análise térmica aplicada ao estudo de materiais energéticos”, Química Nova, Vol. 30, No. 4, pp. 952-956.
Harris, S.M., Klassen, S.E., 2003, “Development of an Ultraine HNS for Use in Modern Slapper Detonators”, AIAA 2003 00240, Proceedings of 41st Aerospace Sciences Meeting and Exhibit”, Reno, USA.
Lee, J.S., Hsu, C.K., Chang, C.L., 2002, “A Study on the Thermal Decomposition Behaviors of PETN, RDX, HNS and HMX”, Thermochimica Acta, Vol. 392-393, pp. 173-176.
Rocco, J.A.F.F., 2004, “Estudo Sobre o Envelhecimento de Formulações de Propelente Sólido Compósito Baseadas em Binders Poliuretânicos Empregados em Motores-Foguete”, Ph.D. Thesis, Instituto Tecnológico de Aeronáutica, São José dos Campos, S.P., 190f.
Rogers, T.E., Orpington, K., 1996, “Flexible Detonating Cord”, European Patent Ofice EP 712822.
Shipp, K.G., Spring, S., 1970, “Hexanitrostilbene”, U.S. Patents 3,505,413.
Silva, G. et al., 2003, “Estudo cinético da decomposição térmica do alfa HMX por calorimetria exploratória diferencial”, Anais da Associação Brasileira de Química, Vol. 52, No. 2, pp. 81-83, 2003.
Silva, G. et al., 2004, “Aplicação da Calorimetria Exploratória Diferencial no Estudo da Cinética de Transição Alfa - Delta HMX”, Química Nova, Vol. 27, No.
6, pp. 889-891. doi: 10.1590/S0100-40422004000600009.
Silva, G., Iha, K., 2004, “Caracterização de Material Altamente Energético (HNS) Via Análises Instrumentais”, Proceedings of 6th Simpósio de Guerra Eletrônica, São José dos Campos, S.P., Brazil.
Silva, G., 2007, “Síntese, Caracterização e Quantiicação de 2,2’,4,4’,6,6’-Hexanitroestilbeno”, Ph.D. Thesis, Instituto Tecnológico de Aeronáutica, São José dos Campos, S.P., Brazil. 118f.
Silva G. et al, 2008, “Determinação Quantitativa de TNT e HNS por TG e FT-IR”, Química Nova, Vol. 31, No. 6, pp.
1431-1436. doi: 10.1590/S0100-40422008000600029.
Silva, G., Nakamura, N.M., Iha, K., 2008, “Estudo Cinético da Decomposição Térmica do Pentaeretritol-Tetranitrado (PETN)”, Química Nova, Vol. 31, No. 8, pp.