Safety evaluation of circular concrete-illed steel columns
designed according to Brazilian building code NBR 8800:2008
Avaliação da segurança de pilares mistos preenchidos de
seção circular projetados segundo a norma NBR 8800:2008
W.L.A. de OLiveiRAa
A.T. Beckb
A.L.H.c. eL deBSc
a Doutor, Departamento de Engenharia de Estruturas, Escola de Engenharia de São Carlos, USP, [email protected], Av. Trabalhador São-Carlense nº 400, 13566-590, São Carlos, Brasil.
b Professor Doutor, Departamento de Engenharia de Estruturas, Escola de Engenharia de São Carlos, USP, [email protected], Av. Trabalhador São-Carlense nº 400, 13566-590, São Carlos, Brasil.
c Professora Doutora, Departamento de Engenharia de Estruturas, Escola de Engenharia de São Carlos, USP, [email protected], Av. Trabalhador São-Carlense nº 400, 13566-590, São Carlos, Brasil.
Abstract
Resumo
This paper presents an investigation of the safety of circular concrete-illed steel columns designed according to Brazilian building code NBR 8800:2008. The investigation is based on a comparison of code provisions to column strength obtained in 32 experimental tests, and on a comparison to provisions of the equivalent American and European codes. The modeling error of theoretical code resistance models is evaluated. An analysis of covariance is performed in order to identify tendencies of these models. The study reveals that the resistance model used in the Brazilian code is compatible with foreign codes, in terms of bias and variances. The study reveals an additional safety margin of the order of 10% for the NBR8800 code, when partial safety factors are removed. Reliability analysis is performed for 3888 col
-umn conigurations, resulting in reliability indexes that cover the building codes application spectrum. The study shows that the Brazilian code presents reliability indexes which are compatible with foreign codes.
Keywords: Concrete-illed columns, experimental analysis, safety, reliability.
Este artigo apresenta uma investigação da segurança de pilares mistos preenchidos de seção circular, dimensionados segundo a norma brasileira NBR 8800:2008. Esta investigação é feita com base na comparação de previsões normativas com a resistência obtida em 32 ensaios experimentais, bem como na comparação com as normas americana e européia correspondentes. O erro de modelo das equações teóricas de resistência destas normas é determinado. Uma análise de covariância é realizada para veriicar tendências das equações de resistência. O estudo mostra que o modelo de resistência utilizado na norma brasileira é compatível com as normas estran
-geiras, em termos de tendenciosidade e variância. O estudo revela uma margem de segurança adicional da ordem de 10% na NBR8800, quando removidos os coeicientes parciais de segurança. Uma análise de coniabilidade é realizada para 3888 conigurações de pilar, resultando em índices de coniabilidade que reletem a segurança do universo de pilares cobertos pelas normas. O estudo mostra que a norma brasileira apresenta índices de coniabilidade compatíveis com as normas estrangeiras.
1. introdution
This paper presents an evaluation of the safety of circular
con-crete illed columns, designed according to Brazilian design code (NBR 8800:2008 [1, 2]). The investigation is based on 32 experimen
-tal results and on a comparison to the corresponding North-American and European design codes (ANSI/AISC 360:2005 [3] e EN 1994-1-1:4:2004 [4]). This research is part of an extensive experimental pro
-gram about steel-concrete composite structures developed at the São Carlos School of Engineering, University of São Paulo.
In recent years, steel-concrete composite design has been expe
-riencing increasing applications worldwide. In some countries of Asia and Oceania, in particular, the choice for concrete-illed steel is based on the excellent resistance of this composite to seismic loading. This property is credited to the coninement effect of con
-crete illing by steel tube, to the ductility provided by outer steel and to the great energy absorption capacity of the composite [5]. In addition to the sound mechanical properties, concrete-illed steel does not require formwork during construction and allows for a reduction of cross-sections when compared with reinforced con
-crete. Due to these advantages and increasing usage worldwide,
steel concrete composites have been subject of intense research
in recent years [6 to 14].
2. experimental analysis
The present study is based on experimental results obtained for 32 circular concrete-illed steel tube columns of different conigurations. The main parameter varied in these tests was the length-to-diameter
ratio L/D. Slenderness ratios of L/D = {3, 5, 7 and 10} where tested.
The columns where composed of steel tubes of D = 114.3 mm (ex
-ternal diameter) with wall thickness of t= {3.35 and 6.0} mm.
The columns where illed with concretes of mean compressive
strengths of fcmean = {32.68, 58.68, 88.78 and 105.45} MPa. These
concretes were produced with commonly encountered materials and usual techniques of mixture and cure. Compressive strengths were obtained by testing cylindrical specimens (100 × 200) mm, 28 days after production. The Young modulus was evaluated by
means of the normative prescriptions.
Yield strength of the tubes was also evaluated by testing, follow
-ing ref. [15]. For the tube with wall thickness t= 3.35 mm, a mean
strength of 287 MPa was found, with a c.o.v. of 5.6%. For the
t= 6.0 mm wall thickness tube, mean strength was 343 MPa and
the c.o.v. was found to be 3.36%.
Testing of the columns was performed at the Structures Laborato
-ry, São Carlos School of Engineering, University of São Paulo. An Instron 8506 testing machine was used for this purpose. This elec
-tronically controlled equipment allows static tests of up to 2500 kN nominal load in structural elements of reasonable proportions. The tested columns were instrumented with four linear variable dif
-ferential transducers (LVDT), which were placed outside the col
-umns with help of metal collars. Longitudinal displacements where measured as the mean of four transducers. Additionally, two strain gauges were placed outside each column, and two were placed in a steel bar inside the concrete, allowing one to measure strains in both steel and concrete components of the composite column. Centered axial loading was applied to the concrete and steel sec
-tion of the columns and tests were conducted until failure. The fail
-ure of short columns was characterized by shear fract-ure of the concrete core, which was still conined by the steel tube. Slender columns failed due to global plastic buckling with no signs of local
buckling of the steel tube.
Experimental results of ultimate load obtained for the 32 speci
-mens are presented in Tables 1 and 2, second column. The irst column in these tables identiies the specimens. Code P1-80-5D-E, for example, identiies tube wall thickness (P1 for t = 3.35 mm,
P2 for t = 6mm), 80 identiies resistance class of the concrete, 5D
is the length (with respect to diameter), and E means that the axial load was applied simultaneously on both concrete and steel sec
-tions (all cases presented in this paper).
3. design code resistance models
In this section, a brief description of the main design equations for steel-concrete composite columns is presented, according to the Brazilian, North-American and European design codes. Detailed description of the design procedures can be found in the corre
-sponding code documents [1, 3, 4] or in ref. [16].
The design codes considered in this study provide different ex -pressions for the evaluation of a columns compressive resistance.
However, they are all based on a sum of the contributions of steel and concrete to the resisting capacity of the columns.
The design strength o columns subject to axial compressive loads, according to NBR 8800:2008, is given by equation (1). Since, in this investigation, no reinforcement bars where used inside the columns, the corresponding contribution terms were removed from design equations presented herein.
In eq. (1), χNBR is a resistance reduction factor to account for col
-umn instability, and NRd,pℓ is the cross-section resistance, given by
eq. (2).
In eq. (2), Ac is the concrete cross-section area; fck is the characteristic
compressive strength of concrete; γc is a partial safety factor for concrete
resistance (equal to 1.40), γa is a partial safety factor for steel (equal to
Samples of this random variable were obtained from the 32 avail
-able experimental results, for each of the design code provisions, as shown in Tables 1 and 2. Histograms of these results are pre
-sented in Figure 1. A probability distribution it to the cumulative histograms was performed, resulting in the distributions and pa
-rameters shown in Table 4 and in Fig. 1. The lognormal distribu
-tion is appropriate to describe resistance model error, since it pre
-serves log-normality of material strength distributions [17]. Other probability distributions, such as translated Rayleigh, translated lognormal and triangular were actually found to provide better its to the available data, but where discarded as the lower and/or up
-per limits where not justiiable.
The mean of a model error random variable (Me mean) is known as
bias factor. Ideally, this mean should be unitary, relecting an un
-biased resistance model. Moreover, a perfect resistance model would result in zero variance. Clearly, this is not the case of the data shown in Table 4. Results show that the ANSI and NBR de
-sign codes provide resistances that are smaller than the experi
-mental (Me mean>1), resulting in conservative bias. The European
code has a tendency for over-predicting column resistance, result
-ing in unconservative model bias Me mean<1).
Ideally, the bias should be removed from the resistance model. This can be done by an investigation of the model, which identiies
bias sources. When this is not possible, a mean bias correction
can be adopted. A corrected resistance model is obtained as:
The corrected model error random variable,
M
corr.e , is alsoob-tained by dividing Me by Me mean. The mean Unitary (the corrected
model presents no bias) and the standard deviation becomes:
The standard deviation is related to the aleatory error of the model, that is, to the models incapacity of correctly predicting column re
-sistance in all design situations. This uncertainty is incorporated in
the reliability analysis to follow.
In order to identify possible sources of bias of the design code resis
-tance models, a covariance analysis was performed. In this analysis, the model error is studied in term of those parameters that where var
-ied in the experiments: fck, slenderness (L/D) and tube thickness t. The
analysis reveals tendencies of the theoretical model in terms of the variables considered. The correlation index, ρxy, is evaluated as:
where ηc is a concrete-coninement factor and ηa is a steel
resis-tance reduction factor. The design resisresis-tance is given by:
The resistance reduction factor χ for axially loaded columns is given by four design equations, based on experimental results (curves a, b, c or d). The type of cross-section and the instability axis deine the curve to be used in a given design.
In the North American (ANSI/AISC) design code, the resisting ca
-pacity of a column is given by:
where
φ
c is a partial safety factor applied to member resistance- LRFD – Load and Resistance Factor Design (equal to 0.75 for columns). Instability of slender columns is given by Pn , which is
evaluated from equation (6):
In equation (6), Pe is the Euler load for elastic instability, and P0 is
the elastic resistance of the cross-section, given by:
In equation (7), C2=0,95 for concrete-filled circular
cross-sections.
For all columns tested in the experimental part of the investi
-gation, the strength predicted by code resistance models was determined. Results are compared in Tables 1 and 2, columns 3, 4 and 5.
In the comparison to experimental results and in the reliability analysis to follow, equations (1) to (7) are used with unitary partial safety factors. In order to distinguish this situation from the design situation (where a safety margin is desired), the axial compressive strength for unitary safety margins will be referred to as N
Rs, with “s”
standing for “safety analysis”.
4. Model error
In order to compare theoretical design code provisions with experimental ultimate load results, a model error (Me) variable is
where σx and σy are the standard deviation of variables x and y, respec
-tively, and cov(x,y) is the covariance operator. A near zero correlation index indicates that there is no linear tendency between the variables.
Results are presented in Figure 2 and in Table 5. Figure 2 shows the correlation between model error and the studied variables for the 32 tested columns. Figure 2a reveals a negative correlation between model error and slenderness ratio, (L/D), for the Brazilian code. Since model error has a positive bias in this code, this covari
In terms of concrete strength, fck (Figure 2b), for NBR, there is no
strong linear tendency between fck and model error. Results, how
-ever, tend to become more conservative when fck is extrapolated.
Hence the Brazilian codes resistance model tends to become more
conservative for higher strength concretes. The covariance analysis
between Me and t (Figure 2c) reveals that model error tends to get
closer to the unitary mean for larger values of tube thickness.
5. Reliability analysis
A reliability analysis is performed, taking as reference the ex
-perimental results, and assuming that ex-perimental results are representative of the actual resistance of code-designed col
-umns. In this analysis, column strength is evaluated by code
Initially, the relevant resistance and action random variables
are identified.
5.1 Resistance variables
The uncorrected model error variables, Me, and the correspond
-ing moments, are presented in Table 4. The corrected model error variables, Me
corr., are presented in Table 6.
Other random variables that affect column resistance are yielding stress of steel and compressive strength of concrete. Moments and distributions are presented in Table 6. Parameters for steel yield strength were taken from literature [18]. Nominal values considered in the reliability analysis are: Syk = {250, 300, 350} MPa.
Parameters of concrete compressive strength were obtained by experimental testing. Figure 3 shows the histograms corre
{9, 11, 9 and 16} samples of concrete with characteristic resis
-tances of {28, 52, 78 and 97} MPa. Characteristic resis-tances are obtained from:
where Sd is the standard deviation obtained in testing of the con -crete coupons.
Other variables could also have been included in the reliability analysis, but are considered of lesser importance.
5.2 Load variables
In order to evaluate reliability of the columns in a service condition, the permanent action D and variable action L are incorporated in the analysis, as well as the corresponding
uncertainty. Nominal values of these actions, Dn and Ln, are
evaluated from the design resistance of the columns, follow
-ing each design code:
were
γ
D andγ
Lare partial safety factors for permanent and vari-able actions, respectively. Equation (13) is solved for the nominal
values Dn and Ln by ixing a ratio between these actions. In this pa
-per, six load ratios are investigated: Ln/Dn= {0.5; 1.0; 1.5; 2.0; 2.5;
3.0}. Parameters and distributions of random variables D and L are
taken fro the literature [18] and are presented in Table 6.
5.3 Other problem parameters
In order for the reliability analysis to relect the spectrum of design situations covered by a design code, it is important to consider a spectrum of variation for the design parameters. As shown in the paragraphs before, 3 values for steel yielding stress, 4 values for concrete resistance and 6 values for load ratio (Ln/Dn) are consid
-ered in this study. Besides these, 6 values of column slenderness are considered: L/D={3, 6, 10, 15, 20 and 25}; 3 steel tube thick
-nesses: t={4, 6, 8}mm and 3 values of external diameter: D={100,
150 and 200} mm. In total, 3888 column conigurations are consid
-ered in the reliability analysis.
5.4 Limit state equation
were:
X1 is the steel resistance;
X2 is the concrete strength;
X3 is the model error variable, corrected or not; X4 is the permanent action;
X5 is the variable action.
These variables change according to column coniguration and de
-sign code considered.
For each of the 3888 column conigurations and for each design code (3 codes), column strength is evaluated by design equations (equations 1, 4 and 5), actions are determined from equation (14) and the reliability index is evaluated. Three sets of results are ob
-tained: without model error, with model error and with model er
-ror and bias correction. In total, 34992 reliability analysis are per
-formed. Reliability indexes are evaluated via First Order Reliability Method [19, 20], using a computational program developed by Beck [21].
6. Results of reliability analysis
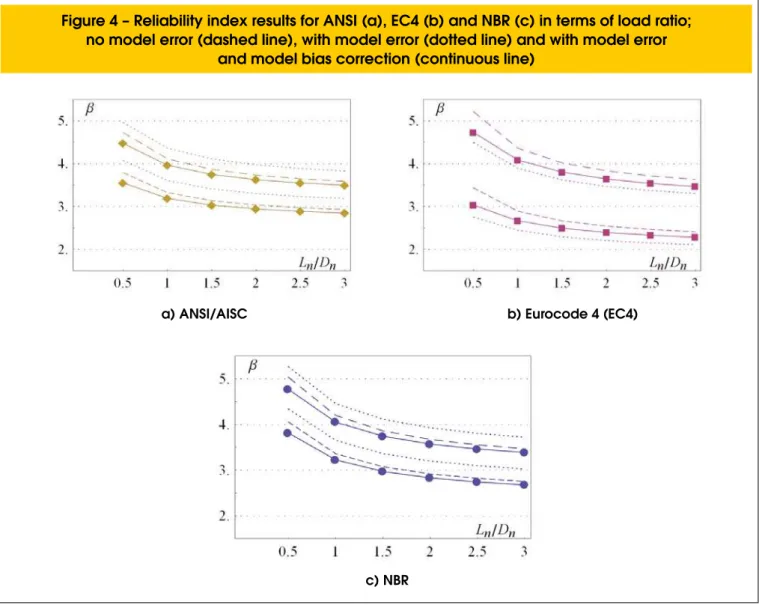
Reliability indexes of columns designed according to the design codes are shown in Figure 4. Three distinct result sets are present
-ed in the igure. The dash-ed line shows results without model error. The dotted line shows results when model error is included in the safety analysis, but not used in resistance model bias correction.
The continuous line shows results when model bias is corrected, and model error is included in the analysis.
Minimum and maximum reliability indexes (β) among the 3888 col
-umn conigurations are shown in Figure 4 and in the igures to follow. Hence, the distance between the upper and lower curves relects the variations of β in the spectrum of column conigurations analyzed. For the Brazilian (NBR) and American (ANSI/AISC) design codes, Figure 4 shows that considering model error in the analysis in
-creases reliability, because these design codes are conservative even when partial factors are set to unity. This additional safety margin only appears when model error is included in the analysis. Results also show that, for these design codes, the mean effect of model error (bias) is larger than the effect of model error variance, which always reduces reliability. Resistance model bias correction for these codes is detrimental to safety, since this removes the ad
-ditional safety margin.
For the European code (EC4), incorporation of model error in safe
-ty analysis leads to a signiicant reduction on reliabili-ty indexes. This reduction is due to model error mean (resistance model is unconservative with unitary partial factors) and due to model er
-ror variance. Resistance model bias correction leads to a partial
recovery of safety levels.
in section 4 is not ideal, since preferably the resistance models should be investigated for possible sources of bias, which could then be removed or reduced. Correlation coeficients presented in Table 5 could be useful in this purpose.
Use of a given design code should ideally result in uniform and suficient reliability indexes for the spectrum of structural elements covered by that design code [18]. Hence, the quality of a particular design code can be measured in terms of suficient and uniform
reliability requirements.
Results in Figure 4 show a clear dependency of reliability indexes with load ratio. This behavior is typical, and is known to be a con
-sequence of adopting constant partial factors γD and γL regardless
of load ratio. Since the coeficient of variation of the variable action (0.25) is much larger than the c.o.v. of permanent action (0.10), as the variable load increases (proportionally to permanent loads), reliability indexes are reduced.
Figure 5 shows reliability index results in terms of column slen
-derness, for a ixed load ratio (Ln/Dn=1). The same three sets of
results are presented. The igure shows some reduction of reli
-ability indexes for increasing slenderness. This is true for all de
-sign codes, although less noticeable for the Brazilian code. The igure also shows that reliability indexes are reasonably uniform over column slenderness, for the NBR code, and less so for the American and European codes. Slenderness ratios investigated in this study are well within the limits allowed by each design code. The EC4 and NBR codes allow columns with relative slenderness – λ0 – smaller or equal to 2. For the columns considered, the larg
-est slenderness L/D = 25, the maximum value is λ0=1.15. For the
ANSI/AISC code, slenderness limit is given by KL/rt<200. For the
columns considered, the maximum value is KL/rt= 80.
Figure 6 shows reliability index results in terms of concrete strength, steel yield stress, steel tube thickness and diameter, for the NBR code. Results show that the NBR design procedure leads to reliability indexes that are approximately constant with respect to these design parameters. Results for concrete strength also suggest that the limit imposed by the Brazilian code (fck≤ 50MPa)
could be revised.
-umn slenderness, steel and concrete strength, tube thickness and diameter. However, the joint variation of these parameters leads to the bands of reliability indexes seen in Figures 4 to 6.
In terms of suficient reliability requirement, reliability indexes ob
-tained in this study can be compared to target values used in cali
-bration of partial safety factors for the ANSI and EC4 codes. For the ANSI code and D+L load combination, βTARGET =3.0 [18]. Results
obtained herein for the NBR and ANSI codes show a conservative margin when compared to this target reliability value, being closer to it for large slenderness and large load ratios.
The European code presents a target reliability βTARGET =3.8 for 50
years and medium consequence class (residential and ofice build
-ings) [22]. Results show that this target is not met for the larger part of columns considered in this study. Results presented in ref. [23] conirm that Eurocode targets are hardly met in practice.
Finally, sensitivity coeficients (direction cosines) of the problems random variables are shown in Figure 7, in terms of load ratios. The igure shows bands of values, corresponding to the smaller and larger values obtained amongst the 3888 column conigura
-tions considered. Sensitivity coeficients show the relative con
-tribution of each random variable in failure probabilities. Load
variables appear with a negative sensitivity coeficient, whereas resistance variables have positive coeficients. The igure shows
that the uncertainty in the variable action has a role which is
in-creasingly dominant as load ratios (Ln/Dn) increase. The second
most important role is due to permanent loads. The third most con
-tributing random variables are concrete strength and model error, especially for small load ratios.
7. conclusions
This paper presented an investigation of the safety of steel-con
-crete composite columns designed according to design codes NBR8800:2008, ANSI/AISC 360:2005 and EN1994-1-1:4:2004. The investigation was based on 32 experimental results for circular concrete-illed steel columns.
Model error random variables were derived for these design codes, revealing the accuracy of design code provisions in terms of pre
-dicting column strength. Results reveal conservative bias of 9.2% and 9.4% for the ANSI/AISC and NBR desing equations, respec
5.7% for the ANSI/AISC and NBR codes and a maximum of 7.8% for the EC4. In a comparison to the foreign codes, the resistance model used in NBR8800 can be admitted to be well calibrated. The study presented a safety analysis for a wide range of column conigurations. This analysis revealed reliability indexes that are considered suficient for the ANSI and NBR codes, but which are not uniform over the range of design situations. The Eurocode (EC4) presented reliability indexes well below the own target of 3.8, and which in many cases are below the American target of 3.0. The study revealed that the Brazilian code is well balanced, with a con
-servative and acceptable bias of 9.4%, which represents an additional safety margin. Reliability indexes are acceptable and reasonably uniform over slenderness ratios, concrete and steel resistances, and steel tube thickness and diameter. Reliability indexes present some lack of unifor
-mity when all these parameters vary simultaneously, and a larger lack of uniformity in terms of the ratio between variable and permanent loads. Results also show that the admitted range of concrete resistances in the Brazilian design code can be ampliied in order to allow con -cretes of greater strength.
8. Acknowledgments
The authors kindly acknowledge CNPq (National Council for Research and Development) and FAPESP (São Paulo State
Foundation for Research) for the inancial support of this re -search project.
9. References
[01] Associação Brasileira de Normas Técnicas.
NBR 8800:2008. Projeto e execução de estruturas de aço e de estruturas mistas aço-concreto de edifícios:
Procedimento. Rio de Janeiro, 2008.
[02] Fakury, R.H. (2007). Sobre a revisão da norma brasileira de projeto de estruturas de aço e estruturas mistas de aço e concreto, a NBR 8800. Revista Escola de Minas – REM, Ouro Preto, v. 60, n. 02, p. 233-239. Abr. – Jun. 2007. [03] American Institute of Steel Construction. ANSI/AISC 360:
Speciication for Structural Steel Buildings. Chicago, Illinois. 2005.
[04] EN 1994-1-1:2004. Design of composite steel and concrete structures, Part 1-1:General rules and rules for buildings. EUROCODE 4, European Committee for Standardization, 2004. [05] Johansson, M.; Gylltoft, K.(2001). Structural behavior of
slender circular steel-concrete composite columns under various means of load application. Steel and Composite Structures, v.1, n.4, p.393-410.
behaviour of concrete-illed steel tubular columns. Structures and Buildings, v. 160, p. 13-22.
[07] De Nardin, S.; El Debs, A.L.H.C. (2004). An experimental study of connections between I-beams and concrete illed steel tubular columns. Steel and Composite Structures, v.04, n.04, p. 303-315.
[08] Roeder, C.W.; Cameron, B.; Brown, C.B. (1999). Composite action in concrete illed tubes. Journal of Structural Engineering, ASCE, v.125, n.5, p.477-484. May.
[09] Elremaily, A.; Azizinamini, A. (2002). Behavior and strength of circular concrete-illed tube columns. Journal of Constructional Steel Research. v.58, n.12, p.1567-1591. Dec. [10] Giakoumelis, G.; Lam, D. (2004). Axial capacity of circular
concrete-illed tube columns. Journal of Constructional Steel Research. v.60, n.7, p.1049-1068. July.
[11] Zeghiche, J.; Chaoui, K. (2005). An experimental behaviour of concrete-illed steel tubular columns. Journal of Constructional Steel Research. v.61, n.1, p.53-66. Jan. [12] Gupta, P.K.; Sarda, S.M.; Kumar, M.S. (2007). Experimental
and computacional study of concrete illed steel tubular columns under axial loads. Journal of Constructional Steel Research. v.63, n.2, p.182-193.
[13] Yu, Z.; Ding, F.; Cai, C.S. (2007). Experimental behavior of circular concrete-illed steel tube stub columns. Journal of Constructional Steel Research. v.63, n.2, p.165-174. Feb. [14] O’Shea, M.D.; Bridge, R.Q. (2000). Design of circular
thin-walled concrete illed steel tubes. Journal of Structural Engineering, ASCE, v.126, n.11, p.1295-1303.
[15] American Society for Testing and Materials. (1992).ASTM
A370: Standard test methods for tension testing of metallic materials. Philadelphia.
[16] Oliveira, W.L.A. (2008). Análise teórico-experimental de pilares mistos preenchidos de seção circular. Tese (Doutorado) – Escola de Engenharia de São Carlos, Universidade de São Paulo, São Carlos.
[17] Faber, M.H.(2006). Risk and Safety in Civil, Surveying and Environmental Engineering, Swiss Federal Institute of Technology, ETHZ, Switzerland.
[18] Ellingwood, B. and Galambos, T.V. (1982). Probability- based criteria for structural design, Structural Safety 1, pp. 15-26.
[19] Melchers, R.E. (1999). Structural Reliability Analysis and Prediction, 2nd edition, John Wiley and Sons, NY.
[20] Beck, A.T. and Rosa, E. (2006). Structural Reliability Analysis Using Deterministic Finite Element Programs”, Latin American Journal of Solids and Structures. v.3, p.197-222.
[21] Beck, A. T.(2007) Computer-aided teaching of
structural reliability. XXVIII Iberian Latin-American Congress on Computational Methods in Engineering,
Porto - Portugal.
[22] prEN 1990: Basis of Structural Design – Annex C: Basis for Partial Factor Design and Reliability Analysis”. European Committee for Standardization, Brussels, “Final Draft”, 2001. [23] Beck, A.T. and Doria, A.S. (2008). Reliability Analysis of