This paper presents a study of the strength (non)compliance of structural concretes produced in Brazil, and a study of the detrimental effects of non-compliance in reliability of short columns subject to axial compression. The investigation is based on experimental results of over ive thou -sand concrete samples from different parts of Brazil. Results show that a signiicant part of these concretes do not reach the characteristic strength speciied in design. As a consequence, these concretes should be considered non-compliant, and mitigation measures should be adopted (de -sign revision, further testing, structural reinforcement, load restrictions and demolition/reconstruction). The study also investigates the impact of concrete strength non-compliance on the reliability of short columns subject to axial compression, when mitigation measures are not adopted. In reinforced concrete, short columns are the structural elements whose resistance most directly depends on the compressive strength of concrete. One consequence of concrete strength non-compliance is that the theoretical equation relating mean concrete resistance to speciied concrete strength does not apply. Using an alternative expression, derived from the experimental results, a signiicant reduction in reliability of short col-umns is observed, due to the noncompliance of concretes produced in Brazil. These results testify to the importance of a rigorous control in the reception of concretes at construction sites, as well as in the control of the required mitigation measures, when noncompliant concrete is received.
Keywords: non-compliance of concrete strength, concrete structures, structural safety, structural reliability, short columns, axial compression.
Este artigo apresenta um estudo da (não-)conformidade dos concretos estruturais produzidos no Brasil, bem como do impacto da não-conformidade na redução da coniabilidade de pilares curtos submetidos a compressão simples. Esta investigação tem como base ensaios de resistência de mais de cinco mil corpos-de-prova de diferentes localidades do Brasil. Estes ensaios mostram que parte signiicativa dos concretos atualmente produzidos no Brasil não atingem a resistência característica (fck) especiicada em projeto. Como resultado, estes concretos deveriam ser considerados não-conformes, e medidas de mitigação deveriam ser aplicadas. O trabalho investiga ainda o impacto da não-conformidade dos concretos produzidos no Brasil na coniabilidade de pilares curtos de concreto armado submetidos a compressão simples, quando medidas de reforço e recuperação não são adotadas. Em concreto armado, pilares curtos são os elementos estruturais cuja resistência mais diretamente depende da resistência à compressão do concreto. Uma consequência da não-conformidade dos concretos é que a equação teórica de norma, que relaciona a resistência média com o valor característico especiicado em projeto, não pode ser utilizada na análise de coniabilidade. Utilizando equação equivalente, determinada a partir dos resultados experimentais, veriica-se uma redução signiicativa da coniabilidade dos pilares curtos em função da não-conformidade dos concretos. Estes resultados reforçam a necessidade de um controle rigoroso no recebimento do concreto, bem como na iscalização das medidas de mitigação no caso dos concretos não-conformes.
Palavras-chave: não-conformidade da resistência do concreto, estruturas de concreto, segurança das estruturas, coniabilidade das estruturas, pilares curtos, compressão simples.
A study of brazilian concrete strength (non-)compliance
and its effects on reliability of short columns
Estudo da (não-)conformidade de concretos produzidos no
Brasil e sua inluência na coniabilidade de pilares curtos
W. C. SAntiAgo a [email protected]
A. t. BeCk b [email protected]
a Mestrando, Departamento de Engenharia de Estruturas, Escola de Engenharia de São Carlos, USP, [email protected], Av. Trabalhador São-Carlense nº 400, 13566-590, São Carlos, Brasil.
b Professor Doutor, Departamento de Engenharia de Estruturas, Escola de Engenharia de São Carlos, USP, [email protected], Av. Trabalhador São-Carlense nº 400, 13566-590, São Carlos, Brasil.
Received: 05 Apr 2011 • Accepted: 24 May 2011 • Available Online: 07 Oct 2011
Abstract
1. introduction
This article presents a study of the strength of plant concretes pro-duced in Brazil, and of the (non)compliance to speciied strengths. The study also investigates how the non-compliance affects the re-liability of short columns subject to axial compression. The study is based on results of more than ive thousand specimens produced in loco at different construction sites in different parts of Brazil. Structural reliability theory is employed to analyze the impact of concrete strength non-compliance in the safety of reinforced con-crete structures produced in Brazil. The study consists in establish-ing reliability indexes for short columns designed followestablish-ing Brazil-ian codes, but produced using the concretes effectively delivered at Brazilian construction sites. The study shows that a signiicant part of these concretes does not comply with design-speciied strengths. The safety analysis considers different reinforcement ratios and different ratios of dead to live loads. The effect of con-crete coninement by reinforcing steel is not taken into account. The analysis is made for four characteristic values of concrete strength – C20, C30, C40 e C50.
This study is motivated by the long range goal of performing the reliability-based calibration of Brazilian design codes. Initiatives in this regard have already been taken in Beck and Doria [1], Beck et al. [2], Chaves et al. [3] and Beck and Souza Jr. [4].
2. Context and relevance
Plant concrete which is delivered today at construction sites in Brazil do not always reach the required strength as speciied in design [5]. Concrete strength noncompliance results, naturally, in structures whose reliability level is not the same as speciied in design codes.
The problem of concrete strength non-compliance permeates the whole civil construction production chain: structural design ofices and professionals, concrete plants, and technical quality control laboratories. The relevance of the subject can be evaluated from a recent round-table “concrete strength: is your facility safe?” pro-moted by SINDUSCON-BA on the 18th may 2010 in the city of
Sal-vador [6]. The theme importance can also be grasped from the creation of speciic study groups like the “technical committee on concrete strength compliance” from the Brazilian Association of Structural Engineering (ABECE) [7].
Concretes with non-compliant strengths result in economical losses, which include the necessity of design reevaluation, further testing, execution of reinforcements and also demolition and re-construction. Further, signiicant losses arise from the time lost and from the prejudice to the image of involved companies[5].
Brazilian code NBR 12655:2006 [8] speciies how the statistical control of concrete should be performed upon reception at a con-struction site. Brazilian code NBR 6118:2003 [9]
describes how to proceed in case a non-compliant concrete is de-tected. If the characteristic strength obtained in testing coupons molded in-loco (fckest) results less than the speciied strength (fck) - case of non-compliant concrete -, corrective actions must be ad-opted, as speciied in NBR 6118:2003 [9] as detailed in [10]: 1. revision of structural design, considering the characteristic
strength found in testing the coupons molded in-loco with the delivered concrete;
2. if non-compliance remains, extract coupons from the actual structure, following NBR 7680:2007 [11]; from these coupons, obtain a new estimate of fck and make a new veriication of the project; if necessary, specify load restrictions for the structure; 3. if the noncompliance persists, chose to:
a – provide reinforcement of the structural member produced with the noncompliant concrete; b – decide for the partial or complete demolition.
Results presented in this article do not refer to one particular con-structed facility, much to the contrary: this article illustrates the problem of non-compliance for general facilities produced with the concretes actually delivered at building sites in Brazil. Because the study doesn´t address particular facilities, the effect of adopting measures of reinforcement and recuperation cannot be consid-ered. Hence, the study investigates the impact of concrete strength non-compliance in general constructed facilities when mitigation measures are not adopted. Also, the study presented herein can -not be used to justify the non-adoption of mitigation measures when non-compliance is detected at a given facility: these mea-sures must follow guidelines of the technical codes [8] and must consider the actual value of characteristic strength obtained for the concrete delivered at the site and employed in the given facility.
3. Characteristic strength of concrete (f
ck)
in compression
Concrete strength is random by nature. Uncertainty and variability of concrete strength originates in the non-homogeneity of materi-als, in the variability on the properties of constituting materials and in mixture imprecision. Hence, n specimens of the same batch of concrete, when tested, will result in n different results for the con-crete strength. Variability within specimens of the same batch will generally be smaller than variability between specimens of differ-ent batches. but cannot be ignored.
Uncertainty in concrete resistance increases as the scope of con-cretes considered increases. It is understood that a coupon ex-tracted from a given location of a structure represents with good precision the resistance of that concrete (excluding possible tech-nical problems in coupon extraction). The concrete from one batch is delivered to a region of the structure, and has it´s resistance measured indirectly from coupons molded in loco upon recep-tion of the concrete. Concrete from a whole structure is delivered in different batches, hence will present a variability in properties which is larger than for a single batch. Concretes produced in dif-ferent plants will have even larger variability. Concretes mixed in loco have, generally speaking, larger variability than plant con -crete. Finally, concrete considered in a design code must relect the variability of all concretes (of the same class) produced in the country(ies) where the code applies. Herein, “design code con-crete” refers to models (equations) used in design codes to: 1. specify the reference strength for the mixture;
2. specify the procedures for reception and control of concretes in construction sites [8];
3. specify what the design code considers to be a compliant con-crete [8, 10].
3. establish the reference strength for the mixture (fcm), so that pro-duced concretes result compliant [8] when tested after 28 days. When used to specify the reference strength for the mixture [8], equation (1) is written as:
(2)
fcm
= fck
+ 1,65.
σd
where fck is the characteristic strength speciied by the designer, fcm is the mean resistance expected for testing at 28 days and sd is the design value of the standard deviation. sd is either code-speciied [8], or the value obtained by a given plant in previous deliveries of the same concrete. For a condition of best quality control (condi -tion A), Brazilian code [8] speciies sd=4 MPa. Hence, following Eq. (2), if plant history is not taken into account, reference resistance for the mixture should be at least 6,6 MPa larger than the charac-teristic resistance speciied by the designer.
Once the concrete is produced, it is delivered to the construction site and poured in the structure. Quality control, executed by molding in loco cylindrical specimens which are tested after 28 days, has the objective of verifying if the produced concrete effectively reached the characteristic strength speciied by the designer. The Brazilian code for reception and control of concrete [8] allows total or partial sampling controls. In total sampling control, two specimens are molded out of each batch of concrete. Resistance to be considered is the largest value between these two specimens. Preferably, the places where the concrete is poured in the structure should be tracked, in order to allow for design reevaluation is case the concrete is found to be non-com-pliant. In the control with partial sampling, at least 6 specimens are molded for each 50 to 100 m3 of concrete poured into the structure [8].
When quality control is by partial sampling, and when the num -ber of specimens is greater or equal to twenty, Eq. 1 is used to estimate the characteristic resistance [8]. In case of total sam -pling control and for more than twenty specimens, characteristic strength is estimated based on the 0.05 percentile of the samples. Testing results are ordered such that
f1
< f2
< f3
< ... < fn
, and characteristic strength is given by [8]:(3)
fckest
= fint [0.05n]
where int[] represents the integer part.
At the end of the quality control, a batch or batches of concrete are considered compliant when the estimates value of characteristic strength (fckest) satisies [8]:
(4)
f
ckest≥
f
ck4. objectives and experimental database
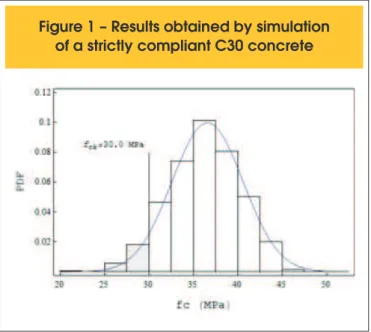
Results presented in this article are based on compression tests C30. Such concrete strength, as any other, can be characterized
by a mean strength (fcm), a standard deviation (�) and a probability distribution function. Well known international results [12, 13] show that a Normal distribution is appropriate to describe compressive strength of concrete. A Normal distribution, together with moments (or parameters) fcmand � describe concrete strength complete-ly. However, a probabilistic description is not viable for the daily professional practice of structural design. Hence, to simplify the practice of structural design, it is chosen to work with a reference value, which is the characteristic value of concrete strength (fck). By convention, the characteristic value is chosen such that 95% of the tested specimens, or 95% of a given volume of concrete, has strengths larger than the characteristic value. This convention, to-gether with the observation that concrete strength follows a Normal distribution, leads to the well-known design equation:
(1)
f
ck= f
cm- 1,65.
σ
In the histogram (Figure 1), concretes whose resistance is below the characteristic value appear shaded: these correspond to the 5% accepted by the codes. Design codes accept these 5% of concretes whose resistance is below fck because there is no other way around the random nature of concrete strength. If one consid-ers safety in structural design, 5% is too much, therefore a partial safety factor on concrete resistance is used. The design value of concrete strength, following Brazilian codes [9], is fcd= fck/1.4.
Equation (1) can be used for:
1. evaluation the characteristic strength of a batch of concrete, for a minimum number of 20 specimens [9] from which fcmand s
are evaluated;
2. evaluate the third parameter, when two are already known (ex-ample: to evaluate the reliability of a structure produced with compliant concrete, mean value can be evaluated from speci-ied fck and known s );
tained in nine Brazilian states – Alagoas, Bahia, Ceará, Distrito Federal, Maranhão, Minas Gerais, Paraíba, Rio de Janeiro and São Paulo – and was obtained from structural designers and of -ices, as follows: Antonio Nereu Cavalcanti Filho of TECNOCON, Cesar Pinto of CSP Projetos e Consultoria em Estruturas, Luiz Felipe Ferreira Mello of SILCO Engenharia, Renato Trindade of AJL Engenharia, Otávio Luiz do Nascimento of CONSULTARE, Egydio Herve Neto of Ventuscore Solucoes em Concreto and Marcos Carnaúba. This database does not cover all of Brazil, but a signiicant part of the country.
Certainly, the authors would like to dispose of results for other parts of Brazil, in order to increase representativeness of the database and reevaluate results presented herein. In order to achieve this objective, the authors call upon structural designers and consulting ofices to make their data available.
Given this observation about the limitations of database represen-tativity, an in order to simplify the discussion to follow, the present database is considered to be representative of the situation of con-cretes produced throughout the country.
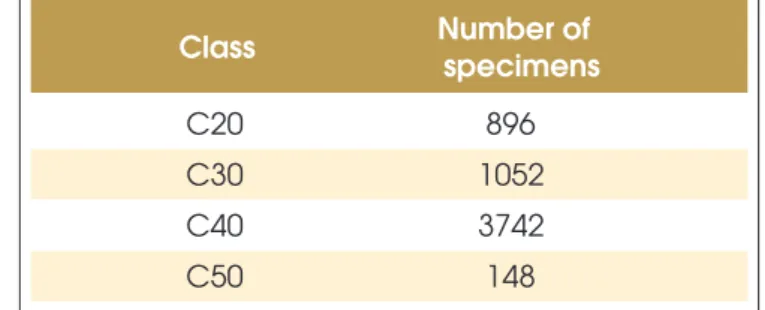
of over ive thousand specimens, molded in loco at different con-struction sites in different parts of Brazil, and tested after 28 days of molding. Table 1 describes the distribution of specimens in terms of concrete classes. The database contains results
ob-Table 1 – Quantification of speciments
forming the concrete strength database
Class
Number of
specimens
C20
896
C30
1052
C40
3742
C50
148
Figure 2 – Comparison of histograms (and distribution functions) for real concretes
a) Real
C20 concrete
b) Real C30 concrete
Objectives of the present study can be divided in:
1. Identify trends and eventual misconduct of plant concretes pro-duced in Brazil, which result in concrete non-compliance. In case of non-compliant concrete, Eqs. 1 and 2 don´t apply. 2. Establish equations equivalent to Eqs. 1 and 2, which relect
the reality of concretes actually produced in Brazil, and which may be used in reliability analyses.
3. Quantify the effect of concrete non-compliance in the safety (reliability) of structures produced in the country, when mitiga-tion measures are not adopted.
A (further) long range goal, which will be subsidized by results pre-sented herein, is to perform the reliability-based calibration of par-tial safety factors of Brazilian structural design codes (NBR8681 and NBR6118) [4].
Objectives 1 and 2 listed above differ signiicantly from the scope of the quality control code for concrete [8]. This code ad -dresses types of control (partial or total sampling), differentiates between mixing conditions (A, B or C), establishes minimum numbers of specimens and the conditions under which concrete compliance is evaluated for individual batches of concrete. The objective of this study is to obtain a probabilistic description which is representative of all plant concretes produced in the country. Hence, it is not important to know if batch A of plant B resulted non-compliant, because the following reliability anal-ysis refers to design codes which apply in the whole country (same partial safety factors are used everywhere). Moreover, the way specimens are molded and the testing procedure is the same for all concretes, regardless of type of quality control
or mixture condition. Therefore, data originated from different plants and batches can be grouped and analyzed in block, for a given geographical location. In this study, concrete data is categorized into regions (south, south-east, northeast) and local statistics are evaluated. National statistics are then evaluated as weighted means of local statistics, where the weight is given by the total numbers of samples of each concrete class in each geographical region.
5. Strength and (non-)compliance
of concretes produced in Brazil
Although statistical quality control is being performed upon recep-tion of concrete in Brazil, it is widely known that a signiicant part of these concretes presents non-conforming strengths [5, 6, 7]. Table 2 summarizes results obtained in this study, from the database described in Table 1. These results are presented graphically in Figures 2 and 3.
Figure 2 shows the histograms obtained from compression tests of cylindrical specimens molded in loco and tested after 28 days, with monotonic loading in standard velocity. The shaded portion of the histograms shows those samples whose resistances resulted less than the characteristic strength. The corresponding percen-tiles are shown in the last column of Table 2. The igure also shows the characteristic strength estimated from the experimental results using Eq. 1. The continuous line shows the Normal probability dis -tributions adjusted to the histogram data. The dotted line shows the hypothetical probability distributions that these results should follow, if the concretes where strictly compliant ().
Table 2 shows results in terms of fckest, fcm, s , coeficient of variation (s /fcm), ratio (fckest /fck) and the percentile of non-compliant concretes in each class. Figure 3 illustrates the change in these parameters as a function of concrete class. It can be observed that results are quite consistent, despite the in-homogeneity of the database in terms of concrete classes and geographical locations. It is also observed that, although the number of samples for C50 is quite small, curves of fckest /fck and fcm /fck follow the same tendency as for the other concretes.
In Table 2, fckest is evaluated from experimental results using Eqs. 1 and 3. As should be expected, there is large agreement between these results. Equations 1 and 3 are equivalent, but Eq. 1 assumes a Normal distribution, whereas Eq. (3) assumes an empirical distri -bution of the data (Fi=i/n). Evaluation of other parameters (like fckest /fck) follows results of Eq. 1.
It can be observed in Figure 2, as well as in Table 2, that fckest< fck for concretes of classes C30, C40 and C50. Hence, the
Table 2 – Results obtained from the statistical analysis of the concrete strength database
Class
f
ckest(MPa)
(Eq. 1)
f
ckest(Eq. 3)
(MPa)
f (MPa)
cms (MPa)
C.V.
f
ckest/f
ckPercentage on
non-compliant samples
C20
23,0
23,7
26,0
1,847
0,071
1,15
1
C30
27,9
28,0
33,8
3,554
0,105
0,93
9
C40
35,9
33,6
41,7
3,570
0,090
0,90
30
C50
42,4
41,1
47,2
2,910
0,062
0,85
84
set of experimental results for these concretes, as a whole, can be considered non-compliant. The order of non-compliance can be evaluated qualitatively from Figure 2, from the difference between dotted and continuous probability distribution lines. The order of non-compliance can be quantiied from the percentile of samples whose strength is below the speciied characteristic strength, in the last column of Table 2. By virtue of design code this percen-tile should be limited to 5%. However, much larger percenpercen-tiles are observed for C30, C40 and for C50 concretes. It becomes evident that the problem of concrete non-compliance is more signiicant for concretes of larger nominal resistance.
Results obtained for s show that the standard deviation speci-ied in the code to obtain the reference resistance for the mixture (sd=4 MPa for preparation condition A and best quality control [8])
is slightly conservative, which serves as a safety margin so that concretes mixed following Eq. (2) result compliant.
However, results presented herein show that the reference strength mixing equation is not being respected by (some) Brazil-ian plants: for C40 and C50 concretes, mean strength was found to be close to the characteristic strength speciied in design. This conirms observations by Grandiski (in the discussion which is part of reference [5]) that plants have been centering the reference mix -ing strength on the desired characteristic strength, and not on the mean (which is roughly 6,6 MPa larger, as commented). This result certainly has a negative impact on the reliability of reinforced struc-tures produced in Brazil. One measure of this impact is the ratio fckest /fck, which is around 0.9 for the C40 concrete (largest experi-mental dataset). Given this reality, not taking mitigation measures (by hypothesis) is equivalent to design reinforced concrete struc-tures with partial safety coeficient γc=1.4·0.9=1.26. Quantiication
of this impact, however, requires reliability analyses, as presented in the sequence.
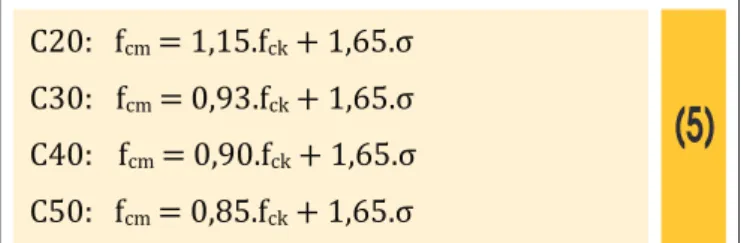
Results presented herein show that concretes of classes C30, C40 and C50 produced in Brazil are resulting non-compliant. Hence, Eqs. 1 and 2 cannot be used in reliability analyses. In this type
of analysis, it is common to reconstruct the statistics of concrete strength from the speciied characteristic strength. Hence, for the reliability analysis of a general structure produced in Brazil with the actual concretes delivered by the plants, Eq. (5) should be used, based on results presented in Table 2.
(5)
C20: fcm = 1,15.fck
+ 1,65.σ
C30:
fcm = 0,93.fck
+ 1,65.σ
C40:
fcm = 0,90.fck
+ 1,65.σ
C50: fcm = 0,85.fck
+ 1,65.σ
Use of Eq. 5, together with the experimental standard deviations presented in Table 2, allows the statistics of real strengths for con-cretes produced in Brazil to be reconstructed.
6. Structural reliability analysis
The non-compliance of concrete strengths, veriied through experi -mental results, negatively affects the safety of reinforced concrete structures produced in Brazil, if mitigation measures are not adopted. In this section, the effect of concrete non-compliance of the reliability of short columns is investigated, by comparing reliability results for compliant (design code) and non-compliant (real) concretes. Within all structural elements in reinforced concrete, resistance of short columns has the strongest dependence on concrete strength. Hence, in evaluation of the effect of concrete non-compliance, only short columns subject to centered normal loads are considered herein. Design speciications [9] require a minimum eccentricity to be considered in the design of short columns. Eccentricities cause second order moments which may lead to tensile stresses in por-tions of the columns cross-section. However, the largest effects of concrete strength non-compliance are observed when the whole
Table 3 – Random variables considered in reliability analysis
Variable
Distribution
Mean
C.V.
Reference
f
cCompliant
C20
normal
f + 1,65.
ckσ
0,080
This article
C30
0,099
C40
0,078
C50
0,053
real
(non-compliant)
C20
normal
Eq. (5)
0,072
This article
C30
0,105
C40
0,090
C50
0,062
C
normal
0,003.b (mm)
4mm + 0,006.b
0,003.b
[16]
f
slognormal
1,12.f
sk0,050
[16]
D
normal
1,05.D
n0,100
[12]
cross-section is under compressive stresses. Hence, no eccentrici-ties are considered herein.
Columns are linear elements, usually vertical, whose function is to receive actions acting on different levels of the structure and trans-mitting them to the foundations. Together with the foundations, col-umns are the most important structural elements in a construction, since the collapse of a single column can lead to global damage and even to overall progressive structural collapse [14, 15].
6.1 Resistance variables
Steel and concrete strengths are the most signiicant random variables affecting the resistance of short columns. Moments and probability distributions for these variables are presented in Table 3. Reinforcing steel of class CA-50 with characteristic yield stress of 500 MPa was considered. Parameters of steel resistance were obtained from the literature [16],
Concrete strengths were evaluated from Eq. (2), when the con-crete is assumed compliant (for comparison) and from experimen-tal results (Table 2 and Eq. 5) for real concretes. In both cases, the experimental standard deviations reported in Table 2 were used. Another source of uncertainty in column strength is cross-section dimensions, arising from imperfections in form work. Square cross-section columns are considered, with sides b=30 cm. Random variable C, which quantiies dimensional uncertainties from nomi -nal dimensions, is taken from the Probabilistic Model Code [16] and is presented in Table 3.
6.2 Design equations and load variables
In order to represent expected actions on a real structure, ran-dom variables dead load (D) and live load (L) are also considered. Nominal values of these actions, Dn and Ln, are evaluated following
the corresponding design code provisions [9, 17].
In evaluating reliability of a general short column (that is, without modeling a particular building), the conventional design order is in-verted. Instead of designing a column cross-section in order to sup-port a speciied loading, the cross-section is pre-deined and code rules are used to evaluate the maximum loading that could be im-posed on that column. Hence, once the characteristic strength of concrete (fck), cross-section dimensions (b x b) and reinforcement ratio ρ are selected, design strength of the short column is given by:
(6)
R
D=
0,85. [b
2
- A
s
]. f
ckγc
+ A
s. f
swhere coeficient 0.85 accounts for strength reduction due to the Rüsch effect, γc=1.4 is the concrete partial safety factor
(NBR6118:2003 [9]), fs is the steel stress corresponding to the limit
concrete deformation (2,0‰) and As is the steel area. Once the
design resistance is evaluated, it is made equal to the design load:
(7)
R
D= S
D=
γ
DD
n+
γ
LL
nwhere gD=1,4 and gL=1,4 are the partial safety factors on loads, given by NBR6118:2003 [9] and NBR8681:2003 [17]. These val-ues, hence the results that follow, correspond to the design of type 2 buildings (those for which live actions do not exceed 5kN/m2),
following NBR8681:2003 [17].
Dividing Eq. (7) by Dn and rearranging terms, one obtains:
(8)
D
n=
γ
R
DD
+
γ
LL
n/D
nFor a chosen load ratio (Ln/Dn), one inds the nominal value of the
dead load (Dn), and hence the nominal value of live load (Ln). From
these nominal values, and using known parameters and probabil -ity distributions [12] (Table 3), the random variable dead and live loads (D and L) are reconstructed.
Eight load ratios are considered herein: Ln/Dn={0,1; 0,4; 0,7; 1,0;
1,3; 1,6; 1,9; 2,2}. Following Ellingwood and Galambos [12], the typical range of load ratios for concrete structures is 0.5≤Ln/Dn≤1.5.
Following Szerzen and Nowak [18], the typical range of load ratios for reinforced concrete columns is 0.1≤Ln/Dn≤1.5. Hence, the range
of load ratios considered herein is slightly larger than typical val-ues. In the interpretation of results, one should remember that, for type 2 buildings, the load ratio is usually Ln/Dn≤1.0.
6.3 Reinforcement ratios
It is important that the reliability analyses cover the range of design conditions expected in practice. Hence, four classes of concrete resistance and eight load ratios (Ln/Dn) are considered. In addition,
three values of reinforcement ratios are considered: ρ={ρmin; 2,0%;
4,0%}. The minimum reinforcement ratio (ρmin) follows speciica
-tions for the design of short columns [9].
6.4 Limit state equation
For a short concrete column of square cross-section (nominal di-mensions b x b) and steel area As, the ultimate capacity limit state
equation is:
(9)
g = 0,85.[(
( (
X
C + b).(C + b) - A
s].f
c+
A
s.f
s- D - L
where:
Cis the random variable which quantiies dimensional variability from nominal dimensions () [16];
fc is (random variable) concrete strength;
fs is (random variable) steel stress corresponding to limit concrete deformation (2,0‰);
D is (random variable) dead load; L is (random variable) live load.
In order to study the effect of concrete non-compliance in the re-liability of short columns, two sets of results are obtained here-in: considering the theoretical equation (Eq. 2, which assumes compliant concretes) and the real relation (Eq. 5, which relects experimental results for actual concretes). Reliability indexes are
evaluated through the irst order reliability method [19, 20] using computational code StRAnD: Structural Reliability Analysis and Design developed by Beck [21].
7. Reliability analysis results
Reliability indexes obtained for short columns with different rein-forcement ratios and for four strength classes are presented in
Figure 4 – Reliability index results for real
concretes in terms of load
ratio L /D and concrete class
n na) Results for
ρ=
ρ
minb) Results for
ρ=2,0%
c) Results for
ρ=
ρ
máxFigure 5 – Reliability index results for real and
compliant C20 concretes in terms
of load ratio L /D
n nb) Results for
ρ
=2,0%
a) Results for
ρ
=
ρ
minFigure 4. Results show that reliability indexes decrease as load ratios are increased. This behavior is well-known, and is known to be a consequence of using constant partial safety factors for loads (gD and gL), regardless of load ratios. Since the coeficient of variation (c.v.) of live load (0,25) is much larger than the c.v. of dead load (0,10), as the live load increases proportionally to the dead load, contribution of live load increases and reliability indexes are reduced.
In Figure 4, the distance between curves relects the effect of con -crete strength class on reliability indexes. The Figure shows that, for load ratios Ln/Dn>0,4 reliability indexes decrease slightly as concrete strength increases, especially for lower reinforcement ra-tios. This result may appear contradictory, but it is a consequence of designing the admissible load for a predeined column cross-section, and also of the dominating role of live load L (as will be shown in the sequence). This is also a consequence of concrete strength non-compliancy, which is aggravated for concretes of greater nominal resistances. For load ratios Ln/Dn<0,4, concrete strength is the dominating random variable, and the observed be-havior is inverted: reliability indexes increase as concrete strength increases. Only the (real) C20 concrete does not follow this ten -dency, because it is “better than a strictly compliant concrete”, as seen in Table 2.
Figure 5 illustrates reliability indexes obtained for C20 concretes with different reinforcement ratios. Two sets of results are pre-sented in this Figure. The dotted line shows results for strictly compliant concretes, whereas the continuous line shows results for the real, “more than strictly compliant concretes”. The Figure makes evident that reliability of C20 concretes short columns is not affected by concrete non-compliancy. Actually, C20 concretes produced in Brazil are, following results of our database, better than strictly compliant. This increases reliability indexes for the real C20 concretes.
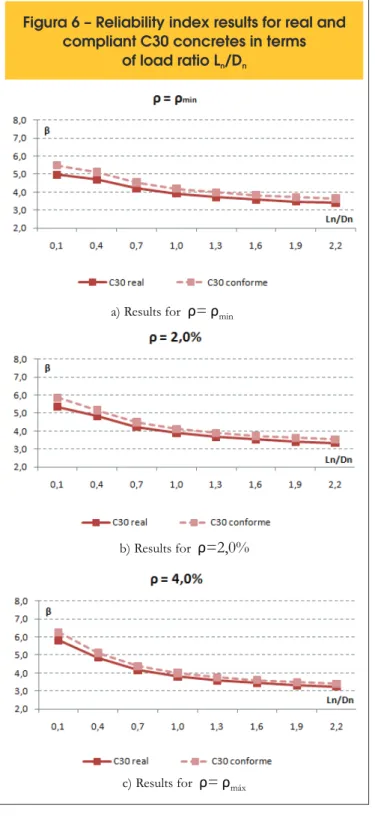
Reliability indexes for C30 concretes and different load ratios are shown in Figure 6. In this igure, it can be observed that concrete strength non-compliancy affects column reliability in a moderate way, As expected, effects of non-compliancy are larger for low load ratios, when concrete strength plays a more signiicant role in col-umn reliability.
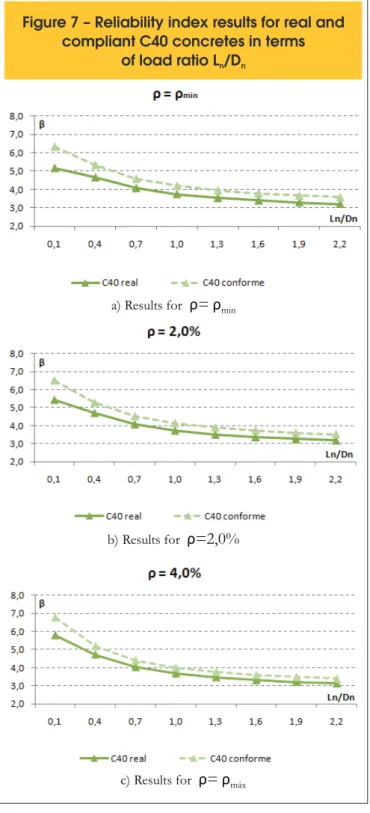
Reliability indexes obtained for C40 concretes and different load ratios can be observed in Figure 7. It is noted that for C40 con -cretes the problem of non-compliancy has a greater effect in the reduction of reliability indexes. The reduction is quite signiicant, as reliability indexes are dropped below target reliability levels. Following the EUROCODE, reliability index for columns should be at least β=3.8. In Figure 7 it can be observed that, for com-pliant concretes, this value is always achieved for Ln/Dn<1,0. However, for the non-compliant concretes delivered at Brazilian construction sites, reliability indexes drop below this target level. Hence, the effect of concrete non-compliancy is quite signiicant for C40 concretes.
Figure 8 illustrates similar results for C50 concretes. Non-compli-ancy affects reliability indexes in an even more signiicant way for these concretes.
In general terms, it is possible to note in Figures 6, 7 and 8 that, as concrete resistance increases, the distance between dotted and continuous lines increases, revealing the effect of non-compliancy increases as concrete class increases. This is a result of the increasing percentiles of non-compliant con-cretes observed in the studied database, as concrete char-acteristic strength increases. In a similar way, it is observed that as the reinforcement ratio is reduced, effects of non-compliancy increase, as the contribution of concrete strength to column strength increases. Finally, it is observed that the largest effects of non-compliancy occur for regions of small load ratios (Ln/Dn<0,4), where the importance of concrete strength is larger.
Figura 6 – Reliability index results for real and
compliant C30 concretes in terms
of load ratio L /D
n na) Results for
ρ
=
ρ
minb) Results for
ρ
=2,0%
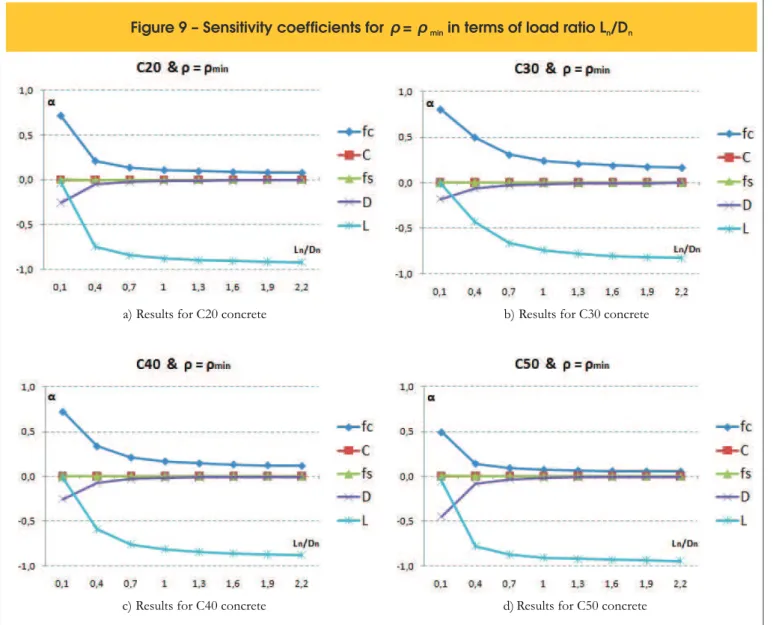
Sensitivity coeficients of the problems random variables are shown in Figures 9, 10 and 11, in terms of load ratios. Sensitivity coeficients are the direction cosines of the geometrical reliability index, and they show the relative contribution of each random variable towards the failure probability. Load variables (L and D) appear as negative coeficients, whereas resistance variables (fc, fy, C) appear as positive coeficients. Figures 9, 10 and 11 show that uncertainty in the live load plays an increasing dominating role as the load ratio Ln/Dn increases,
which should be expected. Less evident is the increasing impor-tance of live load when reinforcement ratios increase. Concrete strength, is the second most important random variable, especially for columns with low reinforcement ratio and executed with lower strength concretes. As reinforcement ratios increase, the contribu -tion of concrete strength is reduced, but the importance of live load increases. Concrete strength becomes the most important random variable when load ratios are small (Ln/Dn<0,4).
Figure 7 – Reliability index results for real and
compliant C40 concretes in terms
of load ratio L /D
n na) Results for
ρ=
ρ
minb) Results for
ρ=2,0%
c) Results for
ρ=
ρ
máxc) Results for
ρ=
ρmáx
b) Results forρ=2,0%
a) Results forρ=
ρmin
Figure 8 – Reliability index results for real and
compliant C50 concretes in terms
8. Concluding remarks
This article presented an investigation of the strength of plant con-crete produced in Brazil, covering classes C20, C30, C40 and C50, and based on a database of over ive thousand specimens molded in loco upon reception. It was veriied that a signiicant part of these concretes to not reach the characteristic strength speciied in de-sign, and hence should be considered non-compliant. Non-com-pliancy increases as the class of concrete resistance increases. For C40 concretes, mean resistance of over three thousand speci -mens was found to be slightly above the speciied characteristic strength (fck=40 MPa speciied; fcm=41,7 MPa and fckest=35,9 MPa, obtained experimentally). Results presented herein indicate that, for higher strength concretes, plants have been centering the refer-ence mixture strength on the characteristic strength, and not on the mean strength, as required [8]. Such a practice should be strongly opposed by constructors and designers, who pay the highest loss-es rloss-esulting from concrete non-compliance.
For the C40 concrete (largest experimental dataset), the ratio of
Figure 9 – Sensitivity coefficients for
ρ
=
ρ
minin terms of load ratio L /D
n na) Results for C20 concrete b) Results for C30 concrete
c) Results for C40 concrete d) Results for C50 concrete
delivered (fckest) to speciied fck was found to be around 0.9. In terms of design, in the absence of mitigation measures, this would be equivalent to designing reinforced concrete structures using a par-tial safety factor of γc=1.4·0.9=1.26.
The authors believe that there is ample space for improvements of structural design codes in Brazil. However, changes can only be pro-posed if the current codes of practice are strictly followed. In particular, the research group of the authors is working on a long range project whose objective is to perform the reliability-based calibration of partial safety factors for Brazilian structural design codes [4]. The study of con -crete strength compliance is fundamental to achieve this objective. Results presented herein illustrate aspects of the problem of con-crete strength non-compliancy in Brazil. Since the study has not addressed particular buildings, effects of reinforcement, load limita-tions and reconstruction could not be considered. The investigation showed that the safety of reinforced concrete structures in Brazil would be signiicantly affected if measures of reinforcement, load limitations or reconstruction where not adopted in a particular con-struction where non-compliancy of concrete strength is identiied.
9. Acknowledgment
The inancial support of this research project by CAPES, CNPq
and FAPESP are greatly acknowledged. The authors also thank the reviewers for the valuable comments which resulted in signii -cant improvements of the article.
Special acknowledgement is due to the designers who provided their experimental data on concrete strength, without which this study would not have been possible.
10. References
[01] Beck AT and Dória AS, 2008: Reliability analysis of I-section steel columns designed according to new Brazilian building codes. J. of the Braz. Soc. of Mech. Sci. & Eng. 30, 152-150.
[02] Beck, A. T., De Oliveira, W. L. A., De Nardim, S., ElDebs, A. L. H. C. Reliability-based Evaluation of Design Code Provisions for Circular Concrete-Filled Steel Columns. Engineering Structures, Elsevier, Vol.31, n.10, p. 2299-2308, October, 2009. [03] Chaves IA, Beck AT and Malite M, 2010: Reliability-
Figure 10 – Sensitivity coefficients for
ρ
= 2,0% in terms of load ratio L /D
n nd) Results for C50 concrete c) Results for C40 concrete
based Evaluation of Design Guidelines for Cold-Formed Steel-Concrete Composite Beams. J. of the Braz. Soc. of Mech. Sci. & Eng. 32, 442-449. [04] Beck, A.T. e Souza Jr., A.C. (2010) A First Attempt Towards Reliability-based Calibration of Brazilian Structural Design Codes, J. of the Braz. Soc. of Mech. Sci. & Eng., Vol. XXXII, No.2, 119-127.
[05] Faria, R., 2009: Concreto não conforme, Revista Téchne, Edição 152, Novembro 2009. Disponível online
(http://www.revistatechne.com.br/engenharia-civil/152/artigo156894-1.asp?o=r), acessado em 18/05/2011.
[06] http://www.sinduscon-ba.com.br/eventos/prg_eve_ det.cfm?eve=19, acessado em 18/05/2011. [07] http://www.abece.com.br/web/serv_comites.asp,
acessado em 18/05/2011.
[08] Associação Brasileira de Normas Técnicas. NBR 12655:2006. Concreto – Preparo, controle e recebimento. Rio de Janeiro, 2006.
Figure 11 – Sensitivity coefficients for
ρ
=
ρ
máxin terms of load ratio L /D
n nd) Results for C50 concrete c) Results for C40 concrete
b) Results for C30 concrete a) Results for C20 concrete
[09] Associação Brasileira de Normas Técnicas. NBR 6118:2003. Projeto de estruturas de concreto -Procedimento. Rio de Janeiro, 2003.
[10] Helene, P., 2010: Considerações sobre a conformidade da resistência à compressão do concreto em estruturas de ediicações, Ph.D. Engenharia, texto não-publicado, 04 de outubro
de 2010.
[11] Associação Brasileira de Normas Técnicas. NBR 7680:2007. Concreto - Extração, preparo e ensaio de testemunhos de concreto. Rio de Janeiro, 2007.
[12] Ellingwood, B. and Galambos, T.V. (1982). Probability-based criteria for structural design, Structural Safety 1, pp. 15-26.
[14] Melges, J. L. P. (2007). Dimensionamento de pilares com base na NBR 6118:2003. Ilha Solteira: FEIS – UNESP.
[15] Scadelai, M. A. (2004). Dimensionamento de pilares de acordo com a NBR 618:2003. Dissertação (Mestrado) – Escola de Engenharia de São Carlos, Universidade de São Paulo, São Carlos.
[16] JCSS - Joint Committee on Structural Safety, 2001: “Probabilistic Model Code”, disponível online http://www.jcss.byg.dtu.dk/Publications/Probabilistic_ Model_Code.aspx, acessado em 18/05/2011. [17] Associação Brasileira de Normas Técnicas.
NBR 8681:2003. Ações e segurança nas estruturas -Procedimento. Rio de Janeiro, 2003.
[18] Szerszen M.M. e Nowak A.S. (2003). Calibration of Design Code for Buildings (ACI 318): Part 2 - Reliability Analysis and Resistance Factors, ACI Structural Journal, V. 100, No. 3, 383-391.
[19] Melchers, R.E. (1999). Structural Reliability Analysis and Prediction, 2nd edition, John Wiley and Sons, NY. [20] Beck, A.T. and Rosa, E. (2006). Structural Reliability
Analysis Using Deterministic Finite Element Programs”, Latin American Journal of Solids and Structures. v.3, p.197-222.
[21] Beck, A. T. (2007) Computer-aided teaching of structural reliability. XXVIII Iberian Latin-American Congress on Computational Methods in Engineering, Porto - Portugal.
[22] Associação Brasileira de Normas Técnicas.