Volume 1, Number 3 (September, 2008) p. 261 - 284 • ISSN 1983-4195
Behaviour of contact and noncontact lap
compression splices
Comportamento de emenda por traspasse de barras
comprimidas em contato e separadas
C. B. Quintana a [email protected]
G. B. Guimarães b [email protected]
L. D. shehata c [email protected]
a Lecturer, Basic Industrial Course, Centro Universitário da Zona Oeste – UEZO. RJ. email: [email protected]
b Associate professor, Civil Engineering Department, Pontifícia Universidade Católica do Rio de Janeiro, PUC-Rio. email: [email protected] c Professor, Civil Engineering Department, Universidade Federal Fluminense, UFF. email: [email protected]
abstract
resumo
An experimental study on the behaviour of lap splices in concrete columns under uniaxial compression is summarized herein. The objec
-tive of the study was to investigate the inluence of the distance between the spliced bars on the behaviour of the lap splice. The study included tests of two columns with spliced longitudinal bars under uniaxial compression: one column with bars in contact with each other in the splice and the other with bars spaced at twice the longitudinal bar diameter φl. In the tested columns, it was observed that the dis
-tance between the spliced bars has an insigniicant inluence on the mean bond stress in the splice. At ultimate load, in both columns, the normal stress at the tip of the bars was much higher than the uniaxial concrete compressive strength.
Keywords:reinforced concrete columns, bond stress, space between spliced bars.
Neste trabalho é resumido um estudo experimental sobre o comportamento de emendas por traspasse de barras comprimidas em pila
-res de concreto armado, com o objetivo de investigar a inluência da distância entre as barras emendadas sobre o comportamento da emenda. O estudo englobou os ensaios à compressão centrada de dois pilares: um com emenda com barras em contato e outro com emenda com barras separadas a uma distância igual a duas vezes o diâmetro das barras da armadura longitudinal, φl. Nos pilares
ensaiados, constatou-se que a tensão média de aderência na emenda praticamente não depende da distância entre as barras. Para ambos os pilares, próximo à carga última, a tensão normal nas pontas das barras apresentou valores muito superiores à resistência uniaxial à compressão do concreto.
Behaviour of contact and noncontact lap compression splices
1. introduction
The force of one bar is transferred to the other, in a lap splice, through the surrounding concrete. These forces are trans -ferred along the splice from one bar to the concrete through
bonding. In the concrete, these forces may generate elevated
tangential stresses as well as radial stresses that cause the
cracking of the concrete along the splice. The integrity of a
splice depends on the development of an adequate bond along the surface of the bars and the capability of the concrete that involves them to transfer the tangential stresses.
Some experimental studies have been carried out to inves -tigate the behaviour of lap tension splices, with contact and
noncontact bars, in slabs (HAMAD and MANSOUR, 1996), in beams subjected to flexure (WALKER, 1951; CHAMBELIN, 1952; CHINN, FERGUSON and THOMPSON, 1955) and in pull-out tests in prisms (WALKER, 1951; CHAMBELIN, 1952). The results related to the influence of spacing of spliced bars
on the bonding found in literature are, as yet, inconclusive.
Most of the research on lap splices has been done on tension splices. Compared to compression splices, the tension ones
are more critical, as the concrete along the length of the splice
is cracked. In general, design recommendations for compres -sion splices have been set based on the results of tested ten-sion splices. However, as there is greater concrete integrity in compression splices (absence of cracks), as a result of the longitudinal compression of the element, and a large part of the compression force is transferred through the tip (the study
made by Pfister and Mattock, 1963, detected stresses at the tip of the bars equal to 5fc), there might be differences between the behaviour of the two types of splices.
The present work summarizes a part of the research carried out by Quintana (2005) on the behaviour of the bonding in a splice with contact bars and with noncontact bars (2φl spacing)
in rectangular cross-section reinforced concrete columns under concentric compression.
2. experimental Programme
The experimental programme consisted of tests on two short columns under concentric compression. The variable adopted
was the spacing between the lapped bars.
The columns had a 210 mm x 120 mm rectangular cross-sec
-tion and a length of 1.2 m. The longitudinal reinforcement con -sisted of four deformed bars with nominal diameter of 16 mm.
The splice length was 600 mm. The longitudinal reinforcement ratio in the region of the splice was 6.4%. Five millimetre stir -rups were used.
Stirrups spaced at 20 mm were placed at the ends of the columns (last 140 mm), in order to have a greater concrete
confinement and avoid failure in these regions. At the ends
of the splices, the stirrups had spacing smaller than that used in the rest of the splice due to the stress concentration in these regions.
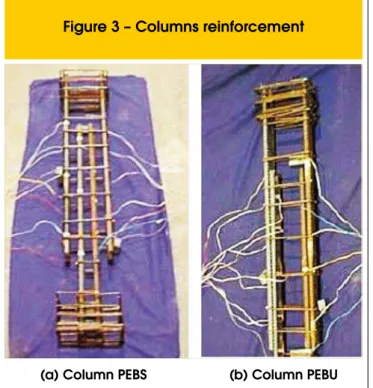
The nomenclature adopted for the columns was: PEBU and PEBS, where PE means column with splice, BU means column with con
-tact bars in the region of the splice and BS column with bars spaced
at twice the longitudinal bar diameter in the splice.
2.1 Materials and specimens casting
In order to obtain the stress-strain curve of the longitudinal re -inforcement bars and the compressive strength of the concrete,
specimens of these materials were tested. Figure 1 shows an example of the stress-strain curves obtained for the bars of the longitudinal reinforcement. The values of compressive strength of
the cylindrical concrete specimens on the day of the test of the
columns and their mean value are given in Table 1.
The columns were cast horizontally in wooden moulds. The con -crete was compacted with the aid of a poker vibrator and cured
with successive wettings for two days. The concrete had aggregate maximum size of 19 mm, 0.55 water-cement ratio, and a slump of
C. B. Quintana | G. B. Guimarães | L. D. shehata
measured with 6.7 cm electrical strain gauges on opposite faces
(Figure 5).
Steel plates were used at the bottom and top of the column and between them and the column a 10 mm thick compress-ible material was placed, to accommodate any irregularity, as
shown in Figure6. To ix the top of the column, a metallic device was placed around it, as shown in Figure 6a. This device was
attached to the reaction frame through threaded bars, ensuring
the positioning of the column. The system was designed so to allow the axial displacement of the top of the column during the test. The adjustment of the exact position of the column was
easily done with the aid of the bolts that connected the support to the columns and to the frame.
2.2 Column characteristics
Column characteristics are shown in Table 2 and in Figures 2 and 3.
2.3 Test instrumentation and procedure
Electrical resistance strain gauges with 10 mm length were used
on four bars of the longitudinal reinforcement, in the region of the
splices of the two columns. These bars were close to the corners diagonally opposite of the columns, as shown in Figure 4a. In both columns, some bars had three strain gauges and others ive, as shown in Figure 4b.
Behaviour of contact and noncontact lap compression splices
As shown in Figure 6, the symmetry axes of the jacks and of the plates were placed in line with the symmetry axes of the concrete
section, to provide a centred load transmission to the column.
In the column tests, carried out with load control, two jacks and a load cell with a 1000 kN load capacity were used (Figure 6a).
The load was applied to the column at an approximate rate of 40 kN per minute, in three uninterrupted cycles: in the irst one the column was loaded up to 400 kN and unloaded after that; in the second one the load reached 800 kN (approximately the service load of the element) and was again withdrawn; in the
third one, the load was applied up to the column failure. Strains were continuously monitored during the test, up to the failure of the column.
3. results
3.1 Failure Modes
The failure of both columns was sudden and occurred in a section
at 300mm from the top of the column, in the region coinciding with
the end of the splice, as shown in Figures 7 and 8.
Table 3 gives maximum load values (Nmax) and the corresponding
values of concrete strain (εc) at half the length of the column, and
maximum strain (εs max.) of the compressed steel bars in the
re-gion of the failure (end of the splice) related to this load, obtained in the tests.
The smaller failure load of the PEBS column can be explained
by the small distance between the longitudinal bars in the region
where the failure occurred (see Figure 2, section 2.2), which re -duced the contribution of these bars in the case of an eccentricity caused by imperfections.
3.2 Load-strain curves
C. B. Quintana | G. B. Guimarães | L. D. shehata
Figure 10 shows the concrete strain and Figure 11 the load-longitudinal bars strain for the PEBU column. The largest concrete
strain and the largest strain in bars 26 and 41, on the same
face of the PEBU column, show
that the largest stresses oc-curred on this face of the col-umn where the failure of the concrete took place.
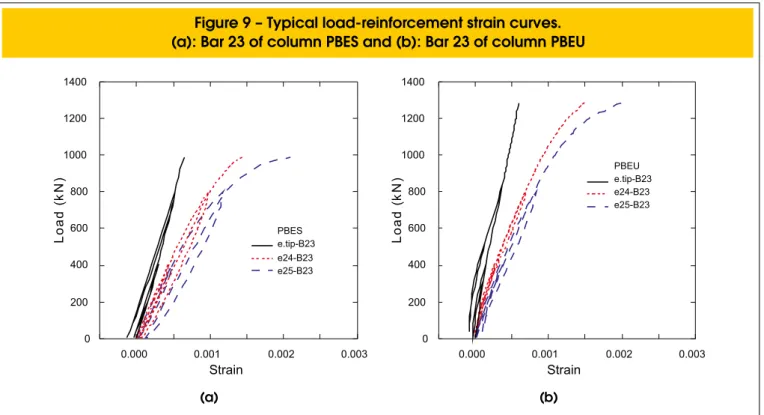
For bars 26 and 41 (with ive
strain gauges) of both columns, the relationships between load and strains measured by the strain gauges that coincided in
location with the strain gauges of bars 20 and 23 (with three strain gauges) were plotted, to allow the comparison of these strains.
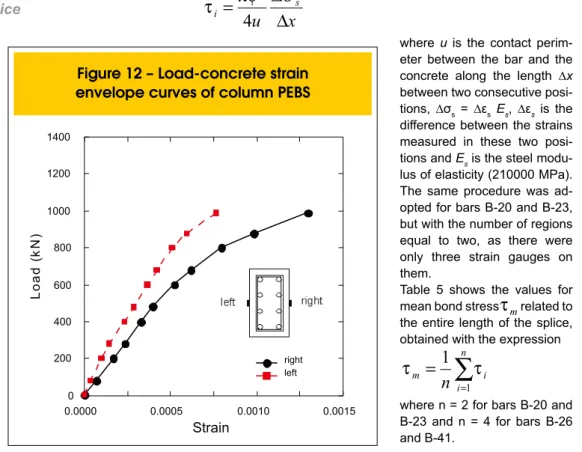
Figure 12 shows the
load-concrete strain curves and
Figure 13 the load-longi -tudinal bars strain of the
PEBS column. The largest concrete strain in the PEBS
Behaviour of contact and noncontact lap compression splices
of the column, show that the highest stresses took place on this face, where the failure of the concrete occurred.
3.3 Longitudinal bars normal stress curves
The normal stresses of the longitudinal reinforcement bars
were obtained from the mea-sured strains and the stress-strain curve of the bars given
in Figure 1.
Figures 14 and 15 show ex
-perimental values, joined by
straight lines, of the normal stress along the splice of the longitudinal bars for the
PEBU and PEBS columns,
respectively, for the loads of 400 kN, 800 kN and for the failure load of each column.
Generally, for any load value,
in both columns, the bar
nor-mal stress in the splice zone
increased as the instrumented point moved away from the end
of the bars, as shown in Figures 14 and 15. It is also possible to see in these two igures that
the end of the bars displayed a smaller increase of the normal stress with the increase of the load, in comparison to the other points of the bars.
Figures 14 and 15 also show that the kind of variation of nor
-mal stress along the splices in both columns is similar. This
gives evidence of the little influence of the spliced bars spac-ing on the global behaviour of a compression splice for the values of bars spacing adopted in this study.
3.4 Normal stress
at the ends of the
bars splice
In both columns, for the col -umn failure load, the end of the bars displayed a normal stress value between 66 and
158MPa, as shown in Table 4, values being 2 to 5 times the uniaxial compressive
strength of the concrete, fc. Similar values were found by
Pfister and Mattock (1963) and Scott et al. (1989) ob -served also that compres-sion concrete stresses at the
bars tips exceeded the uni
-axial compressive strength
of the concrete.
Table 4 shows the stresses
in the bars at the ends of the
splice: at the end of the bars (σp) and at the extremity of the splice opposite to it (σe), for
fail-C. B. Quintana | G. B. Guimarães | L. D. shehata
ure load. It is possible to see that, for all the bars, the σe/σp ratio increases with the increment of the load. For the failure load, σe/σp varies between 3 and 4.5.
3.5 Bond stress in the splice
Despite the fact that the load
applied to both columns was centred, the distribution of the strains in a given cross-section was not uniform due to small
imperfections. Consequently,
for a same value of an applied load, the stresses in a
particu-lar bar (bar 41, for example) of
both columns were different.
To better compare the distribu -tion of bond stresses along one same bar in both columns, the comparison is then made for a same strain value measured at the end of the splice opposite to the bar end.
Figure 16 shows the distribution
of the bond stress (
τ
i) in eachregion along the splice of bars
26 and 41, for strains of 0.0005,
0.0010 and 0.0013 at the end of the splice opposite to the bar
end in both columns. In bars B-26 and B-41, from the normal
stresses in the ive different positions where the strains were mea -sured, the bond stresses were obtained in each one of the four
regions between these ive positions, through the expression
where u is the contact perim-eter between the bar and the
concrete along the length ∆x
between two consecutive
posi-tions, ∆σs = ∆εs Es, ∆εs is the
difference between the strains measured in these two posi-tions and Es is the steel
modu-lus of elasticity (210000 MPa). The same procedure was ad
-opted for bars B-20 and B-23,
but with the number of regions equal to two, as there were only three strain gauges on them.
Table 5 shows the values for
mean bond stress
τ
mrelated tothe entire length of the splice,
obtained with the expression
Behaviour of contact and noncontact lap compression splices
In figure 16, the values of
τ
i are higher at the splice endsand the stress near the bar end tends to be higher. Scott et al.
(1989), when testing elements with compression spliced bars,
noted that the highest values of bond stress occurred at the
tips of the bars. In her turn, Quintana (2005), in 12 columns
with spliced bars submitted to eccentric compression, noted that generally the highest values of
τ
i occurred in the regionsnearest to the tip of the bars.
As shows Table 5, the mean bond stresses in both columns,
corresponding to the strains of 0.0010 and 0.0013 at the end of the splice opposite to the bar tip, do not present differences
higher than around 20%. Taking into account the possible im -perfections of the columns, one can say that the global
be-haviour of the splice in the two columns was similar. Tests of
beams with tension bars in contact or with spacing equal to
φ
land
2
φ
l (CHAMBERLIN, 1958) or to2
.
5
φ
l (CHINN, FERGU -SON and THOMP-SON, 1955) in the splices showed also norelevant difference between the strengths of these splices.
These results show that, in spite of the lack of concrete fully
involving the contact bars in the splice, with the transverse re-inforcement used, this splice was capable of developing bond stress of the same order as the splice with
2
φ
l bars spacing. According to Walker (1951), an adequate concrete vibrationduring casting can guarantee a good penetration of the mortar between the ribs of the contact bars and a good bond between the bars and the mortar, and there is no evidence that the mor-tar between these bars is of lower quality in relation to the concrete around the separated bars.
For the failure load, the values of
τ
min the two columns werearound2MPa.
4. Conclusions
This work made an experimental analysis of two columns subject
-ed to centr-ed compression, both with lapp-ed splices: one with the
bars in contact and another with the bars spacing equal to twice
the diameter of the bars. The results showed that:
• For both columns, at failure load, the tips of the bars had a normal stress value from 2 to 5 times the compressive strength of the concrete. For all the bars, the ratio between the normal stresses at the ends of the splice (σe/σp) increased with the
increase of the load.
• The values of bond stress (
τ
i) in both columns were higherat the ends of the splices, and the stress near the tip of the bars tended to be higher.
• The mean bond stresses in the splices of both columns were similar. This shows the little inluence of bars spacing on the
global behaviour of the compression splice.
It is advisable to extend this study to a larger number of tests of
columns with lap compression splices where the spacing between the bars covers a greater range of values.
5. acknowledgements
The authors acknowledge CNPq and CAPES for the inancial support.
6. references
C. B. Quintana | G. B. Guimarães | L. D. shehata
[02] CHAMBERLIN, S. J. Spacing of spliced bars in beams. ACI Journal, Proceedings, vol. 54, No. 8, p.689-691, Feb. 1958.
[03] CHINN, J., FERGUSON, P. and THOMPSON, J. Lapped splices in reinforced concrete beams. ACI Journal Proceedings, vol. 52, No. 2, Oct. 1955.
[04] HAMAD, B.S. and MANSOUR, M. Bond strength of
noncontact tension lap splices. ACI Structural Journal, vol.93, No. 3, p. 316-326, May-June 1996.
Behaviour of contact and noncontact lap compression splices
[06] QUINTANA, C.B. Inluência da Armadura Transversal e do Cobrimento da Armadura Longitudinal na Resistência de Pilares de Concreto. Tese de Doutorado, Departamento de Engenharia Civil, PUC-Rio, 174p. Rio de Janeiro, Setembro, 2005.
[07] SCOTT, R.H., GILL, P.A.T and JUDGE, R.C.B. Force transfer in compression lap joints in reinforced concrete. Magazine of Concrete Research, vol.41, No. 146, March 1989.