In Situ Measurement of Stress Losses in Unbonded
Tendons of Post Tensioned Flat Slabs
Avaliação “in loco” das perdas de protensão
de cordoalhas engraxadas em lajes planas
S. J. SOARES a [email protected]
J. M. CALIXTO b [email protected]
H. CHUMBINHO c [email protected]
© 2008 IBRACON
a Paranasa Engenharia e Comércio S. A., [email protected], Rua Professor Magalhães Drumond 218 – 30350-000.- Belo Horizonte, MG, Brazil. b Departamento de Estruturas, Escola de Engenharia, Universidade Federal de Minas Gerais, [email protected], Av. do Contorno 842 - 2° andar,
30110-060 - Belo Horizonte, MG, Brazil.
c Misa Engenharia de Estruturas Ltda., [email protected], Rua Roma 31 – 30360-680 - Belo Horizonte, MG, Brazil.
Abstract
Resumo
This paper presents the results of “in situ” measurements of stress losses in unbonded tendons of post tensioned lat slabs. These lats slabs have approximately 350 m2 in area and are 17 centimeter thick. They are part of a 16 story high hotel building. Load cells were
employed to measure the forces in the tendons; they were placed in the vicinity of the active and the passive anchorages. The forces in
the tendons were monitored from the time of their straining up to 170 days afterwards. The measurements reveal a frictional coeficient
μ equal to 0.0528, a very close value to the one prescribed by NBR 6118 of 0.05. The stress loss due to the anchorage of the tendons was of 5.17% of the initial stress. The results indicate also that the remaining force near the passive anchorage is larger in relation to the value measured in the vicinity of the active one. The total stress loss measured so far (170 days) corresponds to 14 % of the initial
post-tensioning stress.
Keywords: post-tensioning lat slabs, unbonded tendons, stress losses.
Este trabalho apresenta os resultados de um estudo sobre as perdas de protensão, medidas “in loco”, de cordoalhas engraxadas em
lajes planas. Essas lajes planas, com 17 centímetros de espessura e 350 m2 de área, fazem parte de um edifício para ins hoteleiros
de 16 pavimentos. As forças de protensão foram medidas por células de carga colocadas nas proximidades da ancoragem ativa e da ancoragem passiva. As medidas de forças foram feitas desde a protensão até idades de 170 dias após esse instante. Os resultados revelam um coeiciente de atrito μ igual a 0,0528 bastante próximo ao valor apresentado pela norma brasileira NBR 6118: 0,05. Nas perdas pela acomodação da ancoragem os valores apurados foram bastante similares e em termos médios, essa perda correspondeu a 5,17% da força inicial de protensão. Os valores de força medidos mostram também que a perda de tensão na cordoalha, próximo à ancoragem passiva, é menor em relação à perda na ancoragem ativa. Até a idade de 170 dias, veriicou-se uma perda média de 14% da força inicial de protensão.
238 IBRACON Structures and Materials Journal • 2008 • vol. 1 • nº 3
1. Introduction
Buildings with post-tensioning lat slabs with unbonded tendons are designed and built in the United States since 1950’s. Initially, the tendons were greased and wrapped up in paper. Afterwards it
was developed an anticorrosive protection formed by a polyethyl-ene tube of high-density and special grease involving the tendons.
In Brazil, according to Loureiro [1], the use of unbonded tendons in post-tensioning started in 1997, when Belgo Bekaert began to pro -duce these tendons. Since then, this new technology has become very popular. This post-tensioning system is most advantageous
in lat slabs without beams, or when the number of beams is a minimum. This type of design simpliies signiicantly the formwork as well as reduces material consumption and working force. It also
facilitates the placing of the reinforcing bars and casting the con-crete with respect to construction systems having beams which is more laborious due to the interferences of reinforcement at the
beam-column joints. These post-tensioning lat plates have smaller thickness and allow great lexibility in locating electrical ducts and
pipes as well as partitions. These facts explain the increasing use of these systems in commercial and residential buildings.
Unbonded tendons are commonly used with post-tensioning as in this study. The post-tensioning process promotes an early evalu-ation of the slab strength since the highest stresses the slab will be subjected to occur right after stretching the tendons. Generally this operation is executed when the concrete is still young and, therefore, has not reached the total strength it was designed for. Thus, the post-tensioning procedure constitutes a kind of load test for these slabs.
In this scenario, the main goal of this paper is to present the test results of a study, accomplished by Soares [2], of the post-tension
-ing stress losses, measured “in situ”, on unbonded tendons in lat
slabs. These slabs are part of a hotel building, under
construc-tion, in the metropolitan area of Belo Horizonte, Brazil. The forces
were measured in the tendons, at the proximities of the active and passive anchorages, from the time of post-tensioning to 170 days
afterwards. A comparative study of the measured stress losses to predicted values prescribed by the Brazilian code NBR 6118 [3]
and found in the literature is also included in the analysis.
It is worth mentioning that, in Brazil, there is no prescribed proce -dure and is not common to evaluate, “in situ” and along the time, stress losses in tendons. The contribution of this paper comes in this direction.
2. Materials and experimental procedures
2.1 Characteristics of the lat slabs
For the analysis of the stress losses in the tendons, a hotel building
under construction in the city of Belo Horizonte was chosen. The building is 16 stories high. The irst loor holds the hotel reception
and administrative area; the next three levels are for car parking.
The hotel rooms are located from the 5th to 15th loors (repetitive
loor plan) while the building technical facilities are placed on the top loor. Figure 1 shows the main façade of the building.
All slabs in the building are post-tensioned with unbonded tendons. The irst three are wafle slabs and are not analyzed herein. The other ones are 17 centimeter thick lat slabs. The investigated ten
-dons are located in loors 10 to 15. Figure 2 illustrate the repetitive loor plan (5th to 15th level). The external ceramic brick walls are 12
centimeter thick while the internal ones are dry walls.
The measurements were taken on same tendon (cable 2A) of loors 10 to 15. Load cells were installed in openings, 30 cm wide by 100 cm long, left in the lat slabs. These openings were located
in the proximities of the active and passive anchorages. Figure 3
presents the location of cable 2A as well as of the openings. The tendon proile is shown in igure 4.
Cable 2A designed post-tensioning force was equal to 140 kN. The
corresponded elongation, after anchoring the tendons, was set to 130 mm. During the post-tensioning procedure in each slab, cable
2A was always the last one stretched. This way no stress loss due
to consecutive tensioning occurred in this cable.
2.2 Concrete
The concrete mix was designed to reach 80% of the 28-day char -acteristic compressive strength at the time of post-tensioning. The
239
IBRACON Structures and Materials Journal • 2008 • vol. 1 • nº 3
type steel. The tendon complete stress-strain relationship was
deter-mined in laboratory. The load corresponded to 1% elongation aver
-aged 181 kN and the mean modulus of elasticity reached 204 GPa.
2.4 Tendon force measuring devices and procedures
Load cells, produced by ALPHA instruments, were used to measure
the forces in the tendons. These cells are commonly employed in scales for heavy loads as well as in elevator cables. They are easy
to install and to monitor. Figure 5 shows the load indicator con -nected to the cell already attached to the tendon inside an opening left in the slab.
a content of 356 kg/m3. The water/cement ratio was 0.46. For the
necessary workability, a plasticizer TEC MULT 44, produced by RHEOTEC, was used. The initial concrete compressive test results
indicated that the strength reached the expected values at the age of 7 days. This timing also matched well the construction schedule. Therefore, the chosen date for post-tensioning the tendons was, on average, 7 days after the concrete was cast.
2.3 Unbonded tendons
240 IBRACON Structures and Materials Journal • 2008 • vol. 1 • nº 3
The load indicator and cell came certiied by IMETRO, the Bra -zilian institute for standards. They were installed according to
the manufacturer’s instructions. Two different load cells were attached to the same tendon (cable 2A): one near the active
anchorage and the other in the proximities of the passive one.
Initially a pre-load stretching the tendon was applied by the hy -draulic jack and sized by the cells. The tendon was then elongat-ed to its initial post-tensioning force which was also measurelongat-ed
by the load cells. This load corresponded to the irst recorded
reading. Forces measurements were also taken at the anchor-ing the tendons right after the hydraulic jack removal as well as several times afterwards. The load recording dates were up to
14 days (366 hours) for cable 2A in loors 10 to 14 and up to 170 days (4086 hours) in the case of 15th loor.
3. Test results and analysis
3.1 Immediate stress losses due to friction
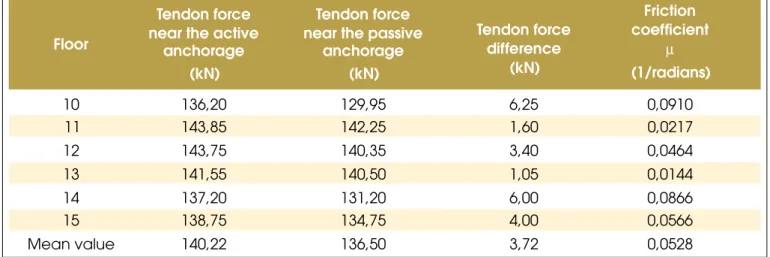
Immediate stress losses due to friction are developed along the
tendon during its stretching at the instant of post-tensioning. Table 1 shows the results of tendon forces measured in the proximities of the active and passive anchorages at that instant in each slab. The difference between these forces corresponds to the loss due to friction. The analysis of these results reveals very distinct values
for these force losses. Possible alterations in the tendon proile
241
242 IBRACON Structures and Materials Journal • 2008 • vol. 1 • nº 3
Brazilian code NBR 6118 [3] presents in chapter 9 an equation
for estimating the immediate loss due to friction in post-tensioning concrete structural elements. The equation is given by:
where,
Piis the initialpost-tensioning force;
xis the distance, in meters, between sections at which ∆P is determined;
Σα is the sum of the angles, in radians, due to intended curvatures in the cable proile between the measuring sections;
µ is the friction coeficient between the tendon and the high-density polyethylene sheathing (1/radians); and
kis the wobble coeficient due to unintended curvatures in the tendon.
In the lack of experimental data, NBR 6118 suggests using k = 0.01µ.
The tendon manufacture (Belgo [4]) speciies a value for the fric
-tion coeficient µ between 0.06 and 0.07. NBR 6118 [3], on the other hand, suggests 0.05 in the lack of experimental data. Table 1 also presents values for the friction coeficient calculated with equation 1. In this calculation, k was set equal to 0.01µ. The distance between the measuring points (load cells) was equal
to 14.07 meters and 0.3757 radians was the sum of the angles (Σα) due to intended curvatures in the tendon proile. The mean calculated value for the friction coeficient was smaller than the
one prescribed by the manufacture equal to 0.07. With respect
to the Brazilian code NBR 6118 there was no difference: 0.0528 versus 0.05.
A comparison between the design initial post-tensioning force (140
coef-243
IBRACON Structures and Materials Journal • 2008 • vol. 1 • nº 3
icient µ determined for each loor and k equal to 0.01µ. In this case
the distance between the measuring sections was of 4.15 meters and the sum of the angles (Σα) due to curvatures in the tendon of 0.1471 radians. The analysis of the results shown in table 2 reveals
good correlation between the average value for the estimated force at the hydraulic jack and design initial post-tensioning force.
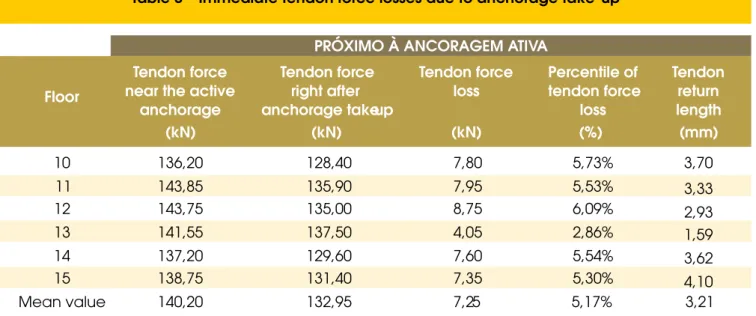
3.2 Immediate losses due to anchoring the tendons
Table 3 shows the results of measured forces near the active an-chorage at the instant of post-tensioning and right after anchoring
the tendons. The difference between these forces represents the immediate loss due to anchorage take up. The percentiles of this force loss as well as the return length of the tendons due to slip-page are also presented in the table. The tendon return length was
calculated as described in appendix A.
The analysis reveals similar results for the force losses with the
244 IBRACON Structures and Materials Journal • 2008 • vol. 1 • nº 3
than 7 mm prescribed by the tendon manufacturer (Cauduro [6]). Based on the estimated value for the initial straining force at the hy -draulic jack (table 2) and on the tendon tension loss shown in table 3, the remaining force at the active anchorage right after anchoring the tendons can be evaluated. This remaining force, whose value
for each loor is presented in table 4, is equal to the difference
between the other two. With this force the tendon total elongation can be determined. This elongation was calculated considering a tendon initial total length of 21.0 meters, a cross-sectional area of 1.01 cm2 and a value of 204 GPa for the steel modulus of elas
-ticity. Table 4 also shows a comparison between this determined
elongation with respect to the design estimated one and to the actual value measured “in situ” right after anchoring the tendons. The analysis of these results shows differences smaller than 10
% in the elongation values. According to Brazilian NBR 14931 [7],
there is no need to stretch once more tendons, whose elongations
are within the interval of ± 10 % of the predicted values.
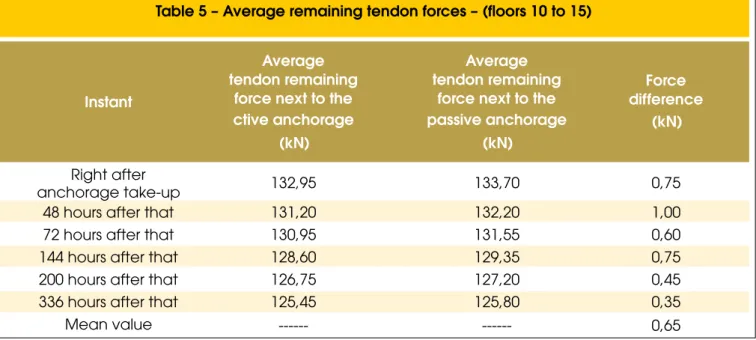
3.3 Time dependent losses
A comparative study of the remaining average force in tendons
along the time, near the active and passive anchorages,
consider-ing all slabs monitored (loors 10 to 15) can be seen in table 5 and igure 6. These results show larger remaining force values next to
the passive anchorage. The analysis also unveils that the differ-ence between the forces next to the passive and active
anchor-ages stayed constant up to 14 days (336 hours) with a mean value of 0.65 kN. At that time, the average remaining force in the tendons next to the active anchorage was equal to 125.45 KN, which cor
-responded to a total stress loss of 10,52 % in relation to the mean initial straining value of 140.20 KN. In the proximities of the passive anchorage the mean total loss was smaller 8.04 %.
Figure 7 presents the remaining forces, after anchorage take-up, in
cable 2A at the 15th loor 15 in the proximities of the active and pas
-sive anchorages. These results also show larger remaining force values next to the passive anchorage. The analysis unveils that
the difference between the forces next to the passive and active
anchorages decreased with time to a value of 0.45 kN after 170 days (4086 hours). At that time, the average remaining force in cable 2A next to the active anchorage was equal to 117.15 KN, which corresponds to a total stress loss of 15.06 % in relation to the initial stretching value of 138.7 KN. In the proximities of the passive anchorage this total loss was smaller 12.72 %.
The usual lump sum design estimate for post-tensioning loss is in
the order of 20 % of the initial force value. In this study a total loss of 14 % was already reached 170 days after straining. With this
result we can not estimate if the usual lump sum for the total
post-tensioning loss will exceed or not 20 % of the initial straining force. Tendon force measurements along a signiicant longer period of
time are still necessary.
4. Conclusions
This paper presented the results of “in situ” measurements of
stress losses in unbonded tendons of post tensioned lat slabs. These lats slabs have approximately 350 m2 in area and are 17
centimeter thick. They correspond to the repetitive loor plan (10th
to 15th level) of a hotel building, under construction, in the city of
Belo Horizonte. In each slab, the monitored tendon was always the
last one strained. Load cells were employed to measure the forces in the tendons; they were placed in the vicinity of the active and the passive anchorages. The forces in the tendons were monitored from the time of their straining up to 170 days afterwards. The main conclusions of the study are:
• Very distinct values were found for the force losses due to friction. Possible alterations in the tendon proile during casting
the slabs may be one of the factors which cause the
differences in the measured values. Based on the test results, an average value for the friction coeficient of 0.0528 was
determined. This mean value is smaller than the one suggested by the manufacture of 0.07; on the other hand is
245
246 IBRACON Structures and Materials Journal • 2008 • vol. 1 • nº 3
• Very similar results were obtained for the stress losses due
to anchorage take-up. The average value for this immediate
loss corresponded to 5.17% of the initial post-tensioning force. • The evaluation of the average tendon return length, right after anchorage take-up, unveiled a value of 3.21 mm, signiicantly
smaller than 7 mm prescribed by the tendon manufacturer.
• Until 14 days after straining, the average tendon total force loss (loors 10 to 15) corresponded to 9.25 % of the initial
post-tensioning force.
• The results showed that approximately 14 % of the initial
post-tensioning force was already lost till 170 days after straining.
• The results also unveiled larger remaining tendon forces
in the proximities of the passive anchorage in relation to the active one.
5. Acknowledgments
The authors would like to thank IMPACTO PROTENSÃO, BELGO BEKAERT and PARANASA for the inancial aid.
6. References
[01] LOUREIRO, G. J., Projeto de Lajes Protendidas com Cordoalhas Engraxadas, VI Simpósio EPUSP sobre Estruturas de Concreto, São Paulo, 2006.
[02] SOARES, S. J. Avaliação “in Loco” das Perdas de Carga de Cordoalhas Engraxadas em Lajes Lisas, Belo Horizonte, 2005, Master´s thesis, Escola de
Engenharia - Universidade Federal de Minas Gerais,
64 p.
[03] ASSOCIAÇÃO BRASILEIRA DE NORMAS TÉCNICAS, Projeto de Estruturas de Concreto – Procedimento - NBR 6118, Rio de Janeiro, 2003,
221 p
[04] BELGO BEKAERT ARAMES S. A., Fios e Cordoalhas para Concreto Protendido, Catálogo Técnico, http:// www.belgo.com.br.
[05] LYN, T. Y. and BURNS, N., Design of Prestressed Concrete Structures, John Wiley & Sons, 3rd ed,
1981, 646 p.
[06] CAUDURO, E. L., Manual para a Boa Execução de Estruturas Protendidas usando Cordoalhas de Aço Engraxadas e Plastiicadas, 2nd ed, 2002, 109 p.
[07] ASSOCIAÇÃO BRASILEIRA DE NORMAS TÉCNICAS (ABNT),Execução de Estruturas de Concreto – Procedimento, NBR 14931, Rio de Janeiro, 2003, 40 p.
247
IBRACON Structures and Materials Journal • 2008 • vol. 1 • nº 3
Appendix A – Determination of the tendon
return length
The tendon return length right after anchorage take-up was
deter-mined on the linearization of equation 1 as suggested by Collins and Mitchell [8]. Thus that equation becomes:
The distribution of the force
P
(
x
)
along the length of cable 2A at the 10th loor is given by:The length l, in the igure, is equal to:
248 IBRACON Structures and Materials Journal • 2008 • vol. 1 • nº 3
The same procedure was used for cable 2A in the 14th and 15th
loor. The obtained values were 3.62 and 4.10 mm respectively.
For the other loors, the above procedure led to values of length l larger than 16.65 m (13.9 + 2.75), indicating that the whole cable was affected by the return. For these cases, the adopted
proce-dure, employing cable 2A of the 11th loor as an example, was:
The same above procedure was employed for cable 2A in the
12th and 13th loor. The obtained values were 2.93 and 1.59 mm