Correlation Curves to Characterize Concretes Used
in Rio de Janeiro by Means of Non-destructive Tests
Curvas de Correlação para Caracterizar Concretos
Usados no Rio de Janeiro por Meio de Ensaios
Não Destrutivos
M. D. MACHADO a [email protected]
L. C. D. SHEHATA b [email protected]
I. A. E. M. SHEHATA c [email protected]
a COPPE, Programa de Engenharia Civil, Universidade Federal do Rio de Janeiro, [email protected], Caixa Postal 68506, CEP 21941-972, Rio de Janeiro, Brasil
b Escola de Engenharia, Departamento de Engenharia Civil, Universidade Federal Fluminense, [email protected], COPPE-UFRJ, [email protected],Caixa Postal 68506, CEP 21941-972, Rio de Janeiro, Brasil
c COPPE, Programa de Engenharia Civil, Universidade Federal do Rio de Janeiro, [email protected], Caixa Postal 68506, CEP 21941-972, Rio de Janeiro, Brasil.
Abstract
Resumo
Non-destructive tests give information about the properties of the concrete of a structure, but the reliability of the evaluation of those properties depends on the experience of the professional that carries out the tests and the curves employed to correlate the measured values with the properties of the investigated concrete. The main objective of this study was to supply engineers with correlation curves that make it possible to evaluate, by using non-destructive test results, the compressive strength and the modulus of elasticity of ready-mixed concretes used in Rio de Janeiro. Test specimens cast with concretes used in several constructions and supplied by different ready-mixed concrete producers were tested. These concretes had, in general, nominal fck value of 25 MPa or 30 MPa. Aiming to include concretes with strength varying within a wider range and made with the two types of typical coarse aggregates of Rio de Janeiro, test specimens cast in the laboratories of two ready-mixed concrete producers were tested. In these concretes, the water-cement ratio (0.40 to 0.60) and the petrographic characteristic of the coarse aggregate were varied. Compressive strength and modulus of elasticity tests, ultrasonic pulse velocity, rebound hammer and penetration resistance tests were carried out, at the ages of 3, 7, 14, 28 and 90 days. The correlation curves obtained from the analysis of the results of all those tests are presented here. When only one non-destructive test was used, the rebound hammer was the one that led to the best estimation of compressive strength and the combination of that test with the penetration resistance test improved the accuracy of the evaluation. If modulus of elasticity tests cannot be carried out, the ultrasonic pulse velocity test can be an interesting option to evaluate that property.
Keywords: correlation curves, nondestrutive tests, ready-mixed concrete
Os ensaios não destrutivos fornecem informações quanto às propriedades do concreto das estruturas, mas a coniabilidade da avaliação dessas propriedades depende da experiência do proissional que realiza esses ensaios e das curvas empregadas para correlacionar as grandezas me -didas nos ensaios com as propriedades do concreto investigado. Este estudo visou prover os engenheiros de curvas de correlação que os
possi-bilitem estimar, por meio da utilização de ensaios não destrutivos, a resistência à compressão e o módulo de elasticidade dos concretos dosados em central utilizados no Rio de Janeiro. Foram ensaiados corpos-de-prova moldados com concretos usados em diversas obras, fornecidos por
diferentes concreteiras. Esses concretos tinham, em geral, fck nominal de 25 MPa ou 30 MPa. Objetivando englobar concretos com resistências
mais variadas e os dois tipos de agregados graúdos típicos do Rio de Janeiro, foram ensaiados corpos-de-prova moldados nos laboratórios de dois grupos de concreteiras. Nestes concretos, variaram-se a relação água-cimento (0,40 a 0,60) e a característica petrográica do agregado graúdo. Foram realizados ensaios de resistência à compressão e de módulo de elasticidade, de velocidade de propagação de ondas ultra-sônicas,
de esclerometria e de penetração de pinos, em concretos com idades de 3, 7, 14, 28 e 90 dias. Aqui são apresentadas as curvas de correlação obtidas a partir da análise dos resultados de todos esses ensaios. Ao se usarem os métodos isolados, o de esclerometria foi o que levou à melhor avaliação da resistência à compressão e a combinação desse método com o de cravação de pinos melhorou a acurácia dessa avaliação. Na
impossibilidade de se realizarem ensaios de módulo de elasticidade, o ensaio de velocidade de propagação de ondas ultra-sônicas pode ser uma opção interessante para a avaliação dessa grandeza.
1. Introduction
The compressive strength of concrete is of fundamental importance
in structural design, being deined as the compressive strength at -tained by the material under controlled temperature and humidity conditions, at a certain age.
The veriication that the concrete used in the construction of the
structure complies with the design requirements is made from compression strength tests, usually at 28 days, on cylindrical or cubic specimens, moulded, cured and loaded to failure according to the technical standards used in each country. However, for dif-ferent reasons, many times the investigation of the concrete within a structure is required.
The need to evaluate the strength of the material in situ at ages below 28 days, for reasons inherent to the construction stages, or at ages after the construction, to verify the need to carry out repairs and/or strengthening, has led to the development or improvement
of several tests for the characterization of the concrete.
The extraction of concrete samples from the structure, and its sub-sequent compressive tests, has the disadvantages of being costly and of the restriction of the places where samples can be cut from, so that the stability of the structure is not impaired. As a result, the cores are usually drilled only from the slabs and in relatively small number, not allowing the full mapping of the strength levels of the concrete in the structure.
The use of non-destructive tests comes then as an alternative, given that the structural element to be evaluated undergoes no damage at all or small ones, easily repairable, that do not compro-mise its performance, therefore allowing a wider investigation of the concrete within the structure.
These tests, however, have to be carried out according to
ade-quate procedures and should have their results carefully analyzed,
given that they are affected by several factors, some of them re-lated to the compression strength of the concrete and others to the type of test. There is a consensus that obtaining reliable results
depends on the qualiication of the testing personnel and on the
use of adequate correlation curves, developed for the type of con-crete under study.
Thus, correlation curves to evaluate the compressive strength of ready-mixed concretes used in Rio de Janeiro, using different non-destructive tests, were obtained and are presented here.
A non-linear multiple regression study, which aimed at evaluating the accuracy increase in the compressive strength estimation with the use of combined non-destructive tests methods, is also pre-sented in this work.
The results of the initial tangent modulus of elasticity tests for the same concretes, obtained in a study that was conducted in paral-lel, also allowed correlating this property with the ultrasonic wave pulse velocity.
2. Evaluation of the compressive strength
by non-destructive tests
The estimation of the compressive strength (fc) using non-destruc-tive tests is made with curves that correlate fc with the quantities measured in these tests. Obtaining reliable results depends on the use of adequate correlation curves, developed for the type of con-crete under study.
According to Malhotra [1], whenever there are changes in the ma-terials involved in the production of the concrete, a new correlation curve should be developed. Considerable errors may be made in the evaluation of fc if correlation curves provided by the manufac-turers of the non-destructive equipment are used, given that they
were developed for speciic test conditions and materials.
According to ACI 228.1R-03 [2], the use of non-destructive tests in the
ield should be preceded by the development of correlation curves,
from laboratory tests done on standard concrete specimens (cylindri-cal or cubic) made with the same materials used in the structure’s concrete that is under evaluation. Measurements of a particular quan-tity are carried out on these specimens, using a non-destructive test and, immediately after that, they are submitted to the compressive
tests. Finally, the pairs of obtained results are analysed to determine the expressions that best characterize the desired correlation.
In some cases, as in the penetration resistance method, the tests are done on specimens that are different from those that are used in the compressive strength test. In these cases, it is essential that both tests are done on samples of same maturity and compaction conditions.
According to Neville [3], the major hurdle for obtaining adequate correlation curves is that the factors that affect the compressive strength do not always affect the quantities obtained from the non-destructive tests in the same proportion or in the same manner.
3. Experimental programme
In order to propose curves that correlate the compressive strength or the modulus of elasticity with the quantity obtained from the con-crete non-destructive tests, the experimental programme covered specimen tests with concrete supplied to construction work by 5 concrete suppliers and produced in the laboratories of 2 concrete supplier groups.
In the irst stage it was sought to obtain from each concrete sup -plier, previously selected based on their market share, two con-cretes with nominal fck values equal to at least 25 MPa and differ-ent between themselves. However, with only one exception, in the 180-day period (January to June 2004), it was possible to collect only concretes with a nominal fck of 25 MPa or 30 MPa, minimum values prescribed by NBR 6118 [4] for moderate and high environ-mental aggressivity.
In the second stage (July to December 2004), aiming to include concretes with more varied strengths and the two typical coarse aggregates of Rio de Janeiro, specimens moulded in the men-tioned laboratories, with concretes of a composition similar to that which would normally be adopted by the concrete supplier plants, were tested. In these concretes the variables were the water-ce-ment ratio (0.40, 0.45, 0.50, 0.55 and 0.60) and the petrographic characteristic of the coarse aggregate (crushed granitic gneiss and syenite). The composition of the concretes of this stage is present-ed by Machado [12].
Three combined non-destructive methods were studied here, obtain-ing of the correlation between the ultrasonic pulse velocity, the rebound number and the compressive strength of the concrete (V x IE x fc), the correlation between the ultrasonic pulse velocity, the probe penetration length and the compressive strength of the concrete (V x Lp x fc) and the correlation between the rebound number, the probe penetration length and the compressive strength of the concrete (IE x Lp x fc).
Table 1 summarizes the experimental programme developed. The
concretes of the 1st stage were produced by ive different concrete suppliers and those of the 2nd stage were produced by two concrete suppliers (concretes A and B by one of them and C by the other).
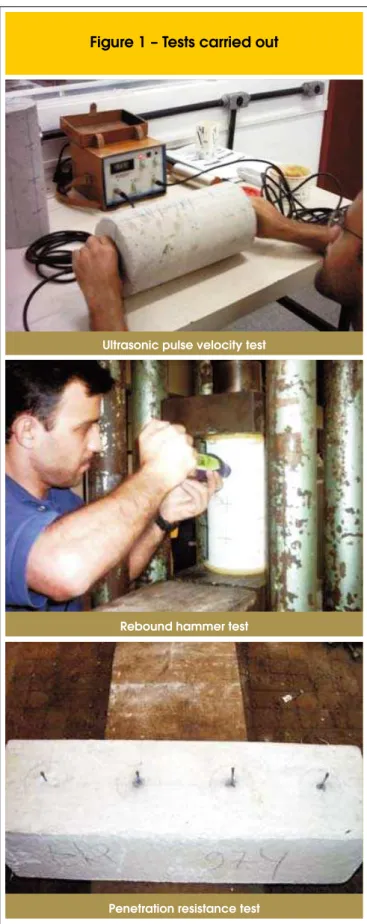
The non-destructive tests carried out are shown in Figure 1.
Compressive strength tests, ultrasonic pulse velocity tests and the rebound hammer tests were done according to the recommenda-tions of the NBR 5739 [5], NM 58 [6], and NM 78 [7], respectively. The Mercosul standards were used as they present, apart from the non-destructive tests recommendations, the procedure for obtain-ing the correlation curves. Besides the recommendations of these standards, those in the equipment manuals provided by the manu-facturers were also followed
The system used in other countries to perform the penetration
re-sistance test is named Windsor probe, while in Brazil the Brazilian
Method, developed by Vieira [8], is adopted, in which a gun and
Brazilian-made probes are used. As shown in Table 2, the Brazilian
Method has gaps in the procedures that have to be adopted during the execution of the penetration resistance tests. Due to that and
to the fact that there is no Brazilian Standard for this type of test, this work followed the recommendations of the American Standard ASTM C803 [9] and, for the selection of valid length of exposed probe measurements, the British Standard BS 1881:Part 207 [10].
In spite of all the precautions taken during the execution of the tests, incoherent exposed probe length values (Le) were found, that is, Le values in later ages smaller than those obtained in earlier ages, fact also found in the tests carried out by Evangelista [11].
Apart from that, the tests showed coeficients of variation over 5%,
limit recommended by ACI 228.1R-03 [2].
Having discarded the possibility that these incoherencies could have occurred due to inadequate procedures during the tests, a decision was made to seek a limit value for the selection of valid Le values that
would be more adequate to the length of the probe used in Brazil. The
need to establish this new limit comes from the fact that the length of
the probe used in Brazil (55 mm) is smaller than the one used in the USA and in Europe (around 80 mm). Besides that, the limit value for
the Le difference of one probe to the other in the same region
recom-mended by the British Standard [10], 5mm, is stricter than that set by the USA Standard [9], 8.4mm or 11.7mm, as shown in Table 2.
The criterion used in establishing this new limit, described in detail by Machado [12], consisted of considering the average of only 3 Le values from the 4 obtained, discarding the one that showed the greatest difference in relation to the average value of the 4 ob-tained. The differences between the Le value of the excluded probe and the greatest or smallest Le value of the remaining 3 probes
showed that the value recommended by BS 1881:Part 207 [10],
5mm, was more adequate to use in the analysis of the tests under-taken in this work.
4. Results
4.1 Isolated Methods
In the studies carried out by Evangelista [11], where the coarse aggregate and water volumes were kept constant, on concrete
ones that inluenced the IE x fc correlation the most, while the type
of cement and the maximum aggregate size were the ones to most
affected the Lp x fc correlation.
These indings served as the basis to decide for the use, in the
simple non-linear regression studies aiming at the selection of the curve that best represented the correlation between the quantities measured in the non-destructive tests and fc, the experimental data obtained in the 1st and in the 2nd stage of this work simultaneously; given that in all of the concretes tested the same type of cement and coarse aggregates with nearly identical density and volume
and with the same maximum size were used.
In the absence of a detailed study on the factors that affect the V x Ec relationship, the decision to use the experimental data obtained in the 1st and 2nd stages simultaneously was made by taking into account the work developed by Nunes [13], who studied the same concrete specimens of this study. In it, practically no difference was found between the expressions that relate Ec and fc obtained for each concrete group tested and that related to all the obtained experimental data.
In this study, for each correlation, the ive most commonly pro -posed curve models in the literature were tested: linear, power, exponential, polynomial (2nd degree) and logarithmic. The criterion
to select the curve that best itted the experimental data was based on the coeficient of determination (r2) and the residual standard
deviation (Sres), as well as the statistical parameter (α), equal to
(Sres) divided by the mean value of fc or Ec. The power curves were those that best represented the V x fc and IE x fc correlations, while the 2nd degree polynomial ones were those that best represented the correlations between Lp and fc and between V and Ec.
The expressions proposed to correlate the concrete compressive strength with the ultrasonic pulse velocity, with the rebound num-ber and with the probe penetration length, along with the expres-sion proposed to relate the modulus of elasticity with the ultrasonic
pulse velocity, are shown in Table 3. Figures 2, 3, 4, and 5 show,
respectively, the curves that represent the expressions given in
Table 3, along with the 95% prediction intervals, apart from all the
obtained experimental data. In order to obtain these expressions, the data that were distant from the mean of a value equal to or greater than three times the standard deviation were discarded
(see Figures 4 and 5).
Analysing the results related to the expressions for the evaluation of fc shown in Table 3, it is found that the IE x fc relationship is the one that presented the greatest value of r2 and the smallest
value of (α), followed in decreasing order by the Lp x fc and V x fc relationships, in line with the sequence found by Yun et al [14] and
Samarin and Meynink [15].
According to Popovics [16], the estimation of the concrete com-pressive strength cannot be obtained with an acceptable accuracy with the use of expressions where the only variable is the value for
V. This fact was veriied in this work, given that the V x fc relation-ship is the one which showed the smallest value of r2 and the
larg-est value of α amongst all of the studied relationships. According to
that author, preliminary studies demonstrated that the inclusion of a new variable (age of the concrete) in the expressions that relate V with fc provides an improvement in the accuracy of the estimated fc value.
Comparing the values of r2 and of α obtained for the V x f
c relation-ship with those obtained for the V x Ec relationship, one inds that the latter leads to more accurate values of the estimated quantity as it presented a greater value of r2 and a smaller value of α than the V x fc relationship. This fact had been anticipated given that the ultrasound pulse velocity is a measure of elastic stiffness and is directly related to the modulus of elasticity [17].
It should be noticed that the values of fc and Ec, obtained from the expressions shown in Table 3, correspond to the mean values located within the range set by the upper (fc,sup or Ec,sup) and lower (fc,inf or Ec,inf) limits of the prediction interval. Since these limits were
obtained from 95% prediction intervals, it can be said that there is a 95% chance of the fc or Ec value to be inside these limits. The ex-pressions for the calculation of these limits are shown in Table 4.
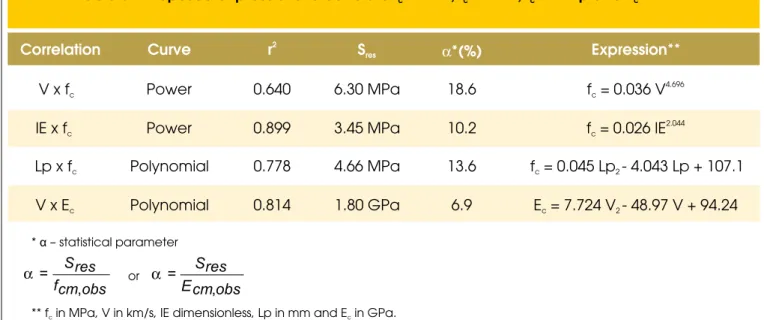
Table 3 – Proposed expressions to correlate f with V, f with IE, f with Lp and E with V.
c c c cCorrelation
Curve
r
2S
resα
*(%)
Expression**
V x f
cPower
0.640
6.30 MPa
18.6
f = 0.036 V
c4.696
IE x f
cPower
0.899
3.45 MPa
10.2
f = 0.026 IE
c2.044
Lp x f
cPolynomial
0.778
4.66 MPa
13.6
f = 0.045 Lp - 4.043 Lp + 107.1
c 2V x E
cPolynomial
0.814
1.80 GPa
6.9
E = 7.724 V - 48.97 V + 94.24
c 2* – statistical parameter
** f in MPa, V in km/s, IE dimensionless, Lp in mm and E in GPa.
α
c c
or
obs
cm
f
res
S
,
=
α
obs
cm
E
res
S
The expressions of this table and the prediction intervals shown in
Figures 2, 3, and 4 conirm the previously mentioned conclusion
drawn from the values of r2 and α: the IE x f
c relationship is the one which presented the smallest uncertainty range for the values of fc amongst the relationships studied in this work.
When conducting an evaluation of the fc by means of non-destruc-tive tests or of Ec from the V x Ec relation, one should always bear in mind the purpose of such evaluation. One should verify if the uncertainty range for the values of fc or Ec inherent to all methods is aligned with the accuracy required by the work to be undertaken. Table 4 Expressions for the calculation of the superior and inferior limits of isolated methods.
Figure 2 – Curve that correlates f with
the ultrasonic pulse velocity (V)
c 0 10 20 30 40 50 60 70 80
3.5 4.0 4.5 5.0
V (km/s) f c ( M Pa )
Experimental data Fitted curve
Limits of the prediction interval fc= 0.036 V4.696
Figure 4 – Curve that correlates f with
the probe penetration length (Lp)
c 0 10 20 30 40 50 60 70 80
0 5 10 15 20 25 30 35 40 45 50
Lp (mm) f c ( M P a )
Experimental data Fitted curve
Limits of prediction interval Discarded value
Vieira[8]
fc= 0.045 Lp2– 4.043 Lp + 107.1
Figure 3 – Curve that correlates f
with the rebound number (IE)
c 0 10 20 30 40 50 60 70 80
15 20 25 30 35 40 45 50 55 60
IE f c (M P a )
Experimental data Fitted curve
Limits of the prediction interval Equipment manufacturer
fc= 0.026 IE2.044
Figure 5 – Curve that correlates E
with the ultrasonic pulse velocity (V)
c 0 5 10 15 20 25 30 35 40 45
3.5 4.0 4.5 5.0
V (km/s) E c ( GP a )
Experimental data Fitted curve Limits of prediction interval Discarded value
Ec= 7.724 V2– 48.97 V + 94.24
4.2 Combined Methods
In the nonlinear multiple regression studies, aiming at choosing the curves that best represented the V x IE x fc, V x Lp x fc, and IE x Lp x fc correlations, the experimental data obtained in the 1st and 2nd
stages were used simultaneously, as justiied above.
Tests were done with 10 types of curve [12] for each correlation, with the choice being made for those that showed the greatest
co-eficient of determination (R2). The expressions proposed for the 3 combined methods studied here are shown in Table 5.
meth-Table 4 – Expressions for the calculation of the
superior and inferior limits of isolated methods
Correlation
Limits
V x f
cf
c,sup= 1.47 f
cf
c.inf= 0.68 f
cIE x f
cf
c.sup= 1.23 f
cf
c.inf= 0.81 f
cLp x f
cf
c.sup= f + 9.4 MPa
cf
c.inf= f - 9.4 MPa
cV x E
cE
c.sup= E + 3.6 GPa
cE
c.inf= E - 3.6 GPa
cf – Values calculated from equations of table 3.c
ods in comparison with that obtained with the use of an isolated method, Table 6 was prepared.
In the literature consulted, two criteria were found to evaluate the accu-racy of a particular relationship in
comparison with that which was obtained by the others. These criteria were named in this work as (A) and (B). In criterion (A), ad-opted by the vast majority of the authors, this evaluation is made by taking into account only the
value of the coeficient of determi -nation, that is, the larger its value, the greater the accuracy. As
re-gards criterion (B), used by Sa -marin and Meynink [15] and Pop-ovics [16], this evaluation is made with the analysis, apart from the
coeficient of determination, of the values of Sres and α. According to this criterion, the most accurate relationship is that which presents
the smallest values of Sres and α. Analysing only the correlations obtained with the use of one single non-destructive test, it is found that the two mentioned cri-teria lead to the same conclusion: the values of fc estimated by the IE x fc relation are more accurate than those estimated by the V x fc and Lp x fc relations, given that for that relation the greatest value of r2 and the smallest values of S
res
and α were found.
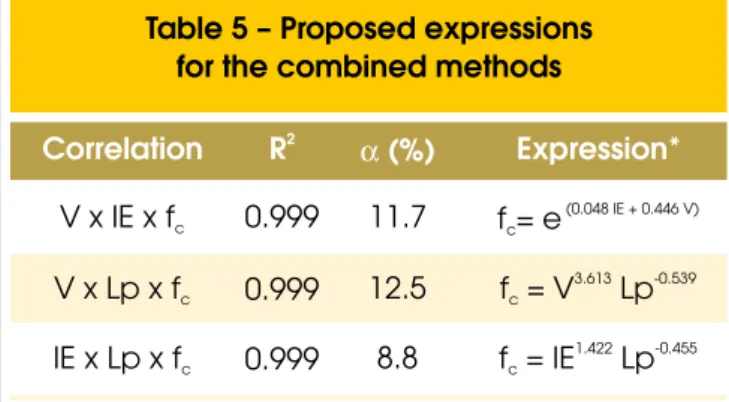
Table 5 – Proposed expressions
for the combined methods
Correlation
R
2α
(%)
Expression*
V x IE x f
c0.999
0.999
0.999
11.7
f = e
c(0.048 IE + 0.446 V)
V x Lp x f
c12.5
f = V
cLp
3.613 -0.539IE x Lp x f
c8.8
f = IE
cLp
1.422 -0.455* f in MPa, V in km/s, IE dimensionless, Lp in mm and E in GPa.c c
In relation to the combined methods, it is found that the analysis of only the values of R2 does not allow to evaluate which of the 3 tested combinations provides more accurate values of fc, as they showed the same value of R2 (0.999). Using criterion (B), however, one can say that the values of fc estimated by the IE x Lp x fc relationship are more accurate than those estimated by the other 2 studied
combina-tions, as it led to the smallest values of Sres and α.
Using criterion (A) in the evaluation of the increase in accuracy of the estimate of fc with the combined methods, it is found that the 3 stud-ied combinations showed an accuracy that was considerably higher than those observed in the isolated correlations, which would justify the use of the combinations. The combined methods led to values of R2 above the values of r2 found for the V x f
c
(in-crease of 56%), IE x fc (increase
of 11%) and Lp x fc (increase of
28%) relationships.
When performing this same evaluation with criterion (B), one can see that the estimate of fc would be more accurate with the use of combined meth-ods V x Lp x fc and IE x Lp x fc than with the use of the corre-sponding isolated methods, as
the values of Sres and α found for the combined methods were below those found for the isolated methods. However, in opposition to the conclusion that criterion (A) pointed, the increase in accuracy would hardly justify the additional time and cost that the use of these combined methods would bring about. This comes from the fact that the smallest values of the difference in percentage terms
between the α value found for
a combined method and those which were found for the
iso-lated methods (β) are relatively
Table 6 – Comparison between the values of r or
R , S ,
and
found for the studied correlations
2
2
res
α
β
Correlation r or R
22
S (MPa)
resα
(%)
β
(%)
V x f
c0.640
6.30
18.6
6.9
IE x f
c0.899
3.45 *
10.2 *
-1.5 ***
V x IE x c
f0.999
3.96
11.7
V x f
c0.640
6.30
18.6
6.1
Lp x f
c0.778
4.66
13.6
1.1**
V x Lp x f
c0.999
4.32 *
12.5 *
IE x f
c0.899
3.45
10.2
1.4 **
Lp x f
c0.778
4.66
13.6
4.8
IE x Lp x f
c0.999
3.04 *
8.8 *
β α
α β. .
– difference, in percentage, between the value of found for a combined method and those found for the respective isolated methods.
* Smallest values of S and ** Smallest values of
small, not going beyond 2%, as shown in Table 6.In this same table, one can see that the use of the V x IE x fc combined method
is not viable, since it led to values of Sres and α above those found for the IE x fc correlation.
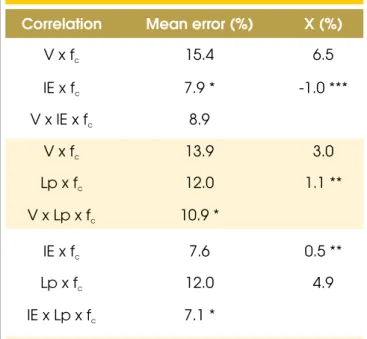
In the attempt to eliminate doubts about the viability of using the combined methods, as the two criteria led to contradictory conclu-sions, tables with the errors of the estimate of fc related to each one of the 6 proposed expressions were produced by Machado [12]. These errors were calculated by taking into account the difference between the values of fc obtained from a particular expression and those obtained from the standard compressive strength tests. A summary of the analysis of these results is shown in Table 7. Based on the results shown in tables 6 and 7, one can say that: a) As far as the isolated methods is concerned, criteria (A) and
(B) showed to be adequate to point, amongst various relations, that where the values of fc are estimated with more accuracy, as the IE x fc relation, pointed by the 2 criteria as being the most accurate, was the one that presented the
smallest relative errors, 7.9% against 15.4% of the V x fc
relation, and 7.6% against 12% of the Lp x fc relation. b) Criterion (B), in opposition to criterion (A), showed
adequacy to point, amongst various combined methods, that where the values of fc are estimated with greatest accuracy. The IE x Lp x fc relationship, pointed by criterion (B) as being the most accurate, was the one that presented
the smallest relative errors, 7.1% against 8.9% and 10.9%
of the V x IE x fc and V x Lp x fc relationships, respectively.
c) The great difference between the values of R2 found for the combined methods and those of r2 found for the respective isolated methods, according to criterion (A), indicates a considerable increase in accuracy for the estimate of fc with the combined methods, which would justify their
use. This fact, however, was not conirmed by the results
of the percentage differences between the relative error found for the combined method and those which were found for the respective isolated methods, X, seen in Table 7, which shows
the ineficiency of this criterion for this type of evaluation.
d) Criterion (B), in its turn, proved to be adequate for evaluating the viability of the combined methods. In the comparisons made in Table 7 between a particular combined method and the respective isolated methods, the values for X point that, in general, the combined methods showed a discrete increase in accuracy for the estimate of fc. This was not found only in the comparison between the V x IE x fc and IE x fc relations. The correspondence between these conclusions and those which were obtained with that criterion attests its validity for this type of evaluation.
It should be noticed that the values of fc, obtained from the expres-sions in Table 5, correspond to mean values within the range set by the upper and lower limits of the prediction interval. The expres-sions for the calculation of these limits are shown in Table 8.
From the expressions in this table, one can say that the values of fc estimated with the IE x Lp x fc relation showed an accuracy greater than the ones estimated with the relations of the other 2 studied
combinations, given that it had the smallest 95% prediction interval
for the values of fc. This same conclusion had already been arrived
at from the analysis of the values of Sres and α.
A comparison between the 95% prediction intervals of the relation -ships studied in this research is shown in Table 9.
From the analysis of the values of this table, one can see that:
a) The V x IE x fc relation presented a prediction interval smaller than that found in the V x fc relation albeit greater than that found in the IE x fc relation, which does not justify its use. b) The V x Lp x fc relation presented a prediction interval smaller
than those found in the V x fc and Lp x fc relations. Despite
Table 7 – Summary of the analysis of errors
in f estimation by a certain relationship
cX – Difference, in percentage, between the relative error found for a combined method and those found for the respective isolated methods.
* Smallest mean error value. ** Smallest values of X.
*** No accuracy increase with the use of the combined method.
Correlation
Mean error (%)
X (%)
V x f
c15.4
6.5
IE x f
c7.9 *
-1.0 ***
V x IE x f
c8.9
V x f
c13.9
3.0
Lp x f
c12.0
1.1 **
V x Lp x f
c10.9 *
IE x f
c7.6
0.5 **
Lp x f
c12.0
4.9
IE x Lp x f
c7.1 *
Table 8 – Expressions for calculating the superior
and inferior limits of the combined methods
Correlation
Limits
V x IE x f
cf
c.sup= 1.26 f
cf
c.inf= 0.79 f
cV x Lp x f
cf
c.sup= 1.31 f
cf
c.inf= 0.76 f
cIE x Lp x f
cf
c.sup= 1.21 f
cf
c.inf= 0.83 f
cthat, its use may not be economically viable due, especially, to the small difference between its prediction interval and that of the Lp x fc relation.
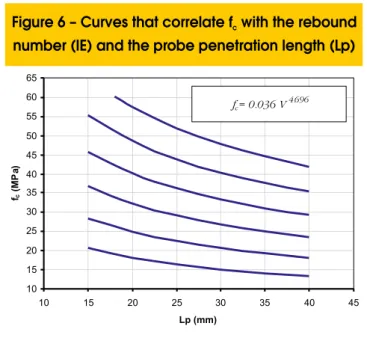
c) The IE x Lp x fc relation presented a prediction interval smaller than those found in the IE x fc and Lp x fc relations but may also not be economically viable due to the small difference between its prediction interval and that of the IE x fc relation. Curves that represent the IE x Lp x fc correlation, combined method
that showed the best results, are shown in Figure 6.
5. Conclusions
On the basis of the analysis of the obtained results, the following remarks can be made:
a) As far as the isolated non-destructive methods is concerned, it was found that the correlation between the rebound number and the compressive strength was that which presented the best results, followed in decreasing order by the Lp x fc and V x fc correlations.
The worst results showed by the V x fc relationship could be explained, according to Popovics [16], by the non-existence of a theoretical relation between the compressive strength and the ultrasonic pulse velocity, not even for homogeneous materials and with elastic linear behaviour. This explanation,
however, does not seem suficient to justify that fact, for
the simple reason that there is no theoretical relation between the compressive strength and the other quantities (IE and Lp). Analyses made by Machado [12] show that the ultrasonic pulse method is more affected by changes in the concrete
Table 9 – Comparison between the 95%
prediction intervals of the studied relationships
Correlation
95% prediction interval*
V x f
c0.79 f
cIE x f
c0.42 f
cV x IE x f
c0.47 f
cV x f
c0.79 f
cLp x f
c0.60 f **
cV x Lp x f
c0.55 f
cIE x f
c0.42 f
cLp x f
c0.60 f **
cIE x Lp x f
c0.38 f
c* Difference between the values of f and f
** Obtained from the mean of the differences between the superior and inferior limits of the 95% prediction interval and the predicted values.
c,sup c,inf.
composition than the other methods, and this explanation may be more adequate.
In spite of presenting the worst results in this study, the estimate of fc using the ultrasound pulse method should not be discarded, especially for an evaluation at later ages. In these ages, results obtained using the rebound hammer and the penetration resistance methods are affected by carbonation, and may not represent the concrete located
within the element. The inluence of carbonation is not as signiicant in the results obtained by the ultrasound wave
propagation method, as the thickness of the surface layer is relatively small in comparison with the total path length of the ultrasound wave (case of direct transmission).
One should always have in mind that, for evaluating the concrete compressive strength by means of non-destructive tests, regardless the method chosen, the greater the knowledge about the composition of the concrete under investigation, thus implying the use of more appropriate curves, the greater will be the accuracy of the obtained results. b) In relation to the combined non-destructive methods, it was
found that the correlation between the rebound number, the probe penetration length and the compressive strength was the one which presented the best results. This is in accordance to the assertion in RILEM NDT4 [18] that the combination of 2 or more methods is advantageous when the methods in question provide estimates of the compressive strength with similar accuracy levels. The IE x Lp x fc correlation was obtained from the combination of the 2 isolated methods (IE x fc and Lp x fc) that individually showed the best results. Despite the fact that the V x Lp x fc and IE x Lp x fc correlations led to an increase in accuracy in the obtained results in comparison to those obtained in the respective isolated methods, this increase may not be enough to justify the time and cost increases produced by the use of the two methods instead of only one.
c) The observed differences between the correlation curves
Figure 6 – Curves that correlate f with the rebound
number (IE) and the probe penetration length (Lp)
c
10 15 20 25 30 35 40 45 50 55 60 65
10 15 20 25 30 35 40 45
Lp (mm)
f
c
(MP
a
)
proposed in this and in other works [12] highlight the need to obtain the largest possible number of information about the composition of the concrete under investigation, which will allow the choice of more adequate curves and results that are closer to the real ones. It should be pointed out that the
use of these curves should be preceded by veriication, made with the extraction of cores, to evaluate their validity. Figures
3 and 4 show that the curves indicated by the manufacturer of the used hammer, and by Vieira [8], do not generally lead to an adequate evaluation of fc in the case of the
concrete specimens analyzed.
d) As regards the statistical procedure adopted, the use of the
determination coeficient was proved to be adequate both
for the choice of the curve that best represented the correlation studied as for the evaluation, amongst various isolated methods, that one which produced the best results. However, its use does not allow the correct evaluation of the use of combined methods. It is recommended, for the evaluation of the method isolated or combined that provides the best results for a particular data set, that the parameters
Sres and α are used, apart from the determination coeficient. e) The estimate of the concrete static modulus of elasticity
value by means of the ultrasonic pulse velocity presented rather satisfactory results as a consequence of the direct relationship between these two quantities.
There is in Brazil a vast ield to be explored in relation to the im -provement of non-destructive tests for obtaining more reliable
re-sults: in the training of qualiied personnel; in the modiication of
adopted procedures; in the inclusion of new variables (as age of the concrete) in the expressions that relate the quantities obtained in the non-destructive tests with the concrete compressive strength. In relation to the penetration resistance method, a broad study is
suggested to seek its adaptation to the Brazilian reality, investi -gating especially the following parameters: minimum number of
probes to be ired in a certain region, minimum distance between
them, maximum difference between the values of their exposed length, and the ideal driver unit position (power type) as a function of the strength of the concrete under analysis.
6. Acknowledgements
The authors would like to acknowledge all the professionals that contributed directly or indirectly to the development of this study, the ready-mixed concrete producers Concretex, Engemix,
Inter-mix, Lafarge, RediInter-mix, and Holcim do Brazil for supplying the con
-crete used in this work, as well as CNPq, CAPES and FAPERJ for their inancial support.
7. References
[01] MALHOTRA, V.M. In situ/nondestructive testing of concrete – A global review. In Situ/Non destructive testing of concrete,Special Publication SP-82, American Concrete Institute, Detroit, p.1-16, 1984.
[02] AMERICAN CONCRETE INSTITUTE. ACI 228.
1R-03, In-place methods to estimate concrete strength, Detroit, 2003.
[03] NEVILLE, A.M. Propriedades do concreto. São Paulo: Editora Pini, 1997.
[04] ASSOCIAÇÃO BRASILEIRA DE NORMAS
TÉCNICAS. NBR 6118:2003: Projeto de estruturas
de concreto-Procedimento, Rio de Janeiro, 2004.
[05] ASSOCIAÇÃO BRASILEIRA DE NORMAS
TÉCNICAS. NBR 5739: Concreto - Ensaio
de compressão de corpos-de-prova cilíndricos, Rio de Janeiro, 1994.
[06] COMITÉ MERCOSUR DE NORMALIZACIÓN.
NM 58: Hormigón endurecido-Determinación de la velocidad de propagación de pulsos ultrasónicos, Associação Brasileira de Normas Técnicas, Rio de Janeiro, 1996.
[07] COMITÉ MERCOSUR DE NORMALIZACIÓN.
NM 78: Hormigón endurecido-Evaluación de
la dureza supericial mediante el esclerómetro
de resorte, Associação Brasileira de Normas Técnicas, Rio de Janeiro, 1996.
[08] VIEIRA, D. P. Método brasileiro de penetração de
pinos, In: XIX JORNADAS SULAMERICANAS DE
ENGENHARIA ESTRUTURAL, Proceedings.
Santiago, Chile, 1978.
[09] AMERICAN SOCIETY FOR TESTING AND
MATERIALS. ASTM C803: Standard test method
for penetration resistance of hardened concrete, Philadelphia, 1990.
[10] BRITISH STANDARDS INSTITUTION. BS 1881:
Part 207, Recommendations for the assessment of concrete strength by near-to-surface tests, London, 1992.
[11] EVANGELISTA, A.C.J. Avaliação da resistência
do concreto usando diferentes ensaios não destrutivos, Tese (Doctorate in Civil Engineering),
COPPE/UFRJ, Rio de Janeiro, 2002.
[12] MACHADO, M.D. Curvas de correlação para caracterizar concretos usados no Rio de Janeiro por meio de ensaios não destrutivos, Dissertation
(Master in Civil Engineering), COPPE/UFRJ, Rio de
Janeiro, 2005.
[13] NUNES, F.W.G., Resistência e módulo de
elasticidade de concretos usados no Rio de Janeiro, Dissertation (Master in Civil Engineering),
COPPE/UFRJ, Rio de Janeiro, 2005.
[14] YUN et al. Comparative evaluation of nondestructive test methods for in-place strength determination, Nondestructive testing, Special Publication SP-112, American Concrete Institute, Detroit, 1988, p.111-116.
[15] SAMARIN, A. and MEYNINK, P. Use of combined
ultrasonic and rebound hammer method for determining strength of concrete structural members. Concrete International, v.3, n.3, p.25-29,
March 1981.
[16] POPOVICS, S. Analysis of the concrete strength
versus ultrasonic pulse velocity relationship. Materials Evaluation, v. 59, n.2, p.123-130,
February 2001.
[17] NOGUEIRA, C.L. and WILLAN, K.J. Ultrasonic
[18] RILEM. NDT 4: Recommendations for in situ concrete strength determination by combined non-destructive methods, 1993
[19] ASSOCIAÇÃO BRASILEIRA DE NORMAS
TÉCNICAS. NBR 5738: Concreto – Procedimento