ISSN 0104-6632 Printed in Brazil
www.abeq.org.br/bjche
Vol. 25, No. 04, pp. 789 - 797, October - December, 2008
Brazilian Journal
of Chemical
Engineering
THE INFLUENCE OF VARIABLE OPERATING
CONDITIONS ON THE DESIGN AND EXPLOITATION
OF FLY ASH PNEUMATIC TRANSPORT SYSTEMS IN
THERMAL POWER PLANTS
M. Stanojevi
ć
*, D. Radi
ć
, A. Jovovi
ć
, M. Pavlovi
ć
and V. Karamarkovi
ć
Department of Process Engineering, Faculty of Mechanical Engineering, Phone: +(381) 11 3370 366, Fax: +(381) 11 3370 364, University of Belgrade, Kraljice Marije 16, 11000, Belgrade, Serbia.
E-mail: [email protected]
(Received: January 31, 2007 ; Accepted: April 10, 2008)
Abstract - The efficiency of an air-slide pneumatic conveying system depends, first of all, on several basic elements chosen or calculated during the design of a plant: air-slide design parameters, air mover characteristics, as well as the physical and chemical properties of the material to be transported. However, during the exploitation of this type of system which is used for handling ash in thermal-power plants, either gradual and/or sudden changes in the operating conditions can arise. This may be due to changes both in the proportion of ash content, and in the flow characteristics of the porous membrane. The consequences of changes in these conditions on the performance of the ash handling system are analyzed, based upon the results of the experimental work carried out on the test rig at the Faculty of Mechanical Engineering in Belgrade, and upon the on-site measurements at the thermal-power plant "Nikola Tesla B".
Keywords: Electrostatic precipitator; Pulverized fly ash; Air-slide conveying system.
INTRODUCTION
The investigation that is reported in this paper has been initiated by recurring problems with the pneumatic transport of pulverized fly ash in the air-slide system at the thermal-power plant "Nikola Tesla B" near Belgrade. The system works successfully most of the time, but clogging of the air-slide occurs every few months and urgent intervention is needed in order to prevent excessive filling of the precipitators and consequently plant shut-down.
ASH HANDLING SYSTEM IN THERMAL-POWER PLANT "NIKOLA TESLA B"
Low grade lignite, from the adjacent surface mine, is used as a fuel in the 1200 MW power plant "Nikola
790 M. Stanojevi, D. Radi, A. Jovovi, M. Pavlovi and V. Karamarkovi
However, occasionally deposition of the ash occurs at the bottom of the air-slide chamber, as the air flow rate from the centrifugal fan is not sufficient to fluidize the ash and move it down the slide. It was obvious that the quality of the ash changed considerably from the standard and, if this kind of ash filled the air-slide for a long time, the stationary layer reached the height of the chamber and transport stopped completely.
In order to determine all the necessary flow characteristics of the different ash samples as well as the characteristics of the other relevant parts of the air-slide system (porous membrane, air mover, air supply lines), a comprehensive test programme was carried out both on site and at the Faculty of Mechanical Engineering in Belgrade.
AIR-SLIDE DESIGN PARAMETERS
In order to specify the air requirement for the air-slide system, two major parameters have to be determined:
1. air velocity (wa) which will fluidize the product sufficiently for sliding down,
2. corresponding pressure drops through the bed ( pb) and through the porous membrane ( pm).
Recommendations for the air velocity (wa), which can be found in the relevant literature, are always related to the minimum fluidizing velocity (wmf). However, the recommendations vary from 10% higher than wmf (for free flowing products with a narrow particle size distribution) up to 10 times the minimum fluidizing velocity in other cases. The problems are enhanced by the fact that there is still no absolutely reliable formula for prediction of the minimum fluidizing velocity. Therefore, in order to obtain the exact values, both the minimum fluidizing velocity and the corresponding pressure drop for the ash samples were measured on the laboratory test rig. The results were then compared with both the relevant literature values and the values which were measured on the real plant.
Pressure Drop Across Fluidized Bed
There are many proposed expressions for pressure drop across the bed. Two of them are given here and are compared with the obtained experimental results. They were originally derived by Kozeny and Carman (1937), for a laminar flow regime, and Ergun (1952), for any flow regime, but other authors improved them later, for example, [Wen and Yu (1996)]:
(
)
2o
b f
2 3 2
s o
1
p w
200
H d
− ε
∆ = µ
φ ε (1)
(
)
2o
b f
2 3 2
s o
2
o f f
3
s o
1
p w
200
H d
1 w
1, 75
d
− ε
∆ = µ +
φ ε
− ε ρ φ ε
(2)
These relations are often used as a starting point for the determination of the minimum fluidizing velocity. Some of them use various, mainly experimental, correction factors.
Minimum Fluidizing Velocity
Numerous formulae can be found for the determination of the minimum fluidizing velocity and it is not the intention of this paper to list them all. All of them are based on both experimental data with different products and on the assumption that, at the point of incipient fluidization, the pressure gradient is equal to the net gravity force of the bed per unit area:
(
p f)
(
mf)
p
g 1 H
∆ = ρ −ρ − ε (3)
Later on, experimental attempts to find the relationship between the voidage at minimum fluidizing conditions (εmf) and sphericity (Φs) were carried out
Wen and Yu (1966), although this relationship is not likely to be universal, as some other material characteristics should be involved too. However, these experiments led to rather acceptable relationship between Reynolds and Archimedes numbers:
mf f
mf
w d
Re = ρ
µ (4)
(
)
3
p f f
b 2
g d
Ar = ρ − ρ ρ
µ (5)
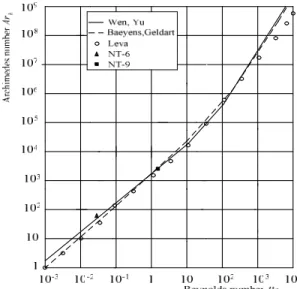
Wen and Yu (1996)plotted a large number of published test data points on this kind of graph (Fig. 1), along with the line obtained by substituting two relations between εmf and Φs, which they had found,
into Ergun's equation:
2
mf b
Re = 33.7 +0.0408 Ar −33.7 (6)
1.07 2
b mf mf
Ar =1823 Re +21.7 Re (7)
This relation is plotted with a dashed line in Fig. 1, along with the previous one (full line). The difference between them is relatively small: for 410
< Arb < 4.5⋅106 relation 7 gives lower values for
Remf up to 15% than relation 6; for Arb > 4.5⋅10 6
it gives higher values for Remf up to 5% and for Arb< 410 it gives higher values for Remf up to 40% (at the minimum values of Arb). However, relation 7 is also within the band of test data points.
Finally, in a similar way, Leva (1959) derived his formula for wmf' starting from Carman-Kozeny's formula and using his tests:
0.94 1.82
p
mf 0.88
f
d m
w 0.00923 ,
s
ρ
=
ρ
ν (8)
where: d(m), v(m2/s), ρpand ρf(kg/m3). Because this took into account only the viscous effect, it should be used for Remf < 10 without any corrections (for Remf > 10, the correction factor should be applied). This relation is also plotted in Fig. 1 (with circular dots).
Although the proposed correction factor was applied, the difference still exist for Remf > 500. The minimum and maximum values in the test data band will be discussed later, along with the test data for ash samples (NT-6 and NT-9).
Pressure Drop Across Porous Membrane
This pressure drop can be obtained only by experiment and, due to the laminar flow regime, it can be presented in the following way:
m m f
p k w , kPa
∆ = (9)
where: km (kPa/m/s) is the membrane resistance coefficient and wf (m/s) is the superficial air velocity which approaches the membrane. However, during the normal operation of the air-slide, the membrane resistance coefficient will gradually increase due to the penetration of the fine particles. This effect will be discussed later.
LABORATORY TEST PROGRAMME
The test programme, carried out under laboratory conditions, was aimed primarily at determining the flow characteristics of the ash during fluidization, as they are of vital importance for the design of the
air-slide parameters. Naturally, some other parameters were measured also (particle size and density, bulk density) in order to compare the obtained data with the ones proposed in the literature. Special attention has been paid to the determination of the resistance coefficients of different samples of porous membranes, used at the plant.
Ash Samples Characteristics
As each air-slide was fed from four points (different rows of the electrostatic precipitator), eight samples of standard quality ash were taken for further analysis (NT-1 to NT-8). Later, when deposition of the ash in the air-slide had been noticed, a sample of that ash was also taken for further analysis (NT-10). Another sample was formed in the laboratory, when sample NT-10 was separated in a fluidizing column into two fractions: top one (lighter and finer) and bottom one (heavier and coarser). The bottom one was tested too (NT-9) as it simulates the conditions which would appear in the air-slide at the point of clogging.
The value of particle density for the standard ash samples varied between 1400 and 1500 kg/m3. However, its value for sample NT-10 was higher (1680 kg/m3) and for NT-9 it was significantly higher - 2170 kg/m3. The reason for this increase was higher SiO2 content in samples NT-9 and NT-10, confirmed by chemical analysis.
The value of poured bulk density for the standard ash samples varied between 610 and 785 kg/m3. The variation in the value of poured bulk density (±12%) of these samples was expected, due to the different points from which the samples were taken. The poured bulk density for sample NT-10 was inside this range (715 kg/m3), however, its value for sample NT-9 was significantly higher - 1180 kg/m3. The tapped bulk density values for all samples were 10 - 15% higher than the corresponding poured bulk density values, except for sample NT-9, which was only 6% higher (Table 1).
792 M. Stanojevi, D. Radi, A. Jovovi, M. Pavlovi and V. Karamarkovi
Figure 1: Comparison of some relationships for minimum fluidizing velocity
Table 1: Bulk density values for all samples
Tapped bulk density *
Sample Poured bulk density
ρρρρb0 (kg/m3) ρρρρb30
(kg/m3)
ρρρρb60
(kg/m3)
b60 b30 b0
ρ − ρ ⋅
ρ 100 (%)
NT-1 610 670 675 11
NT-2 685 765 780 14
NT-3 655 725 745 14
NT-4 720 780 790 10
NT-5 695 755 790 14
NT-6 740 800 820 11
NT-7 785 865 875 11
NT-8 725 825 835 15
NT-9 1180 1255 1255 6
NT-10 715 780 790 10
*ρb30 - tapped bulk density 30 s after of fluidization, *ρb60 - tapped bulk density 60 s after of fluidization
Table 2: Characteristics of ash samples: NT-6 and NT-9
Bulk Density Particle
Density Voidage
Mean Particle Diameter
Terminal Velocity Sample
poured tapped
ρb0 (kg/m3) ρb60 (kg/m3) ρp (kg/m3) - d (µm) vt (m/s)
NT-6 740 820 1450 0.490 105 0.48
NT-9 1180 1255 2170 0.456 320 2.25
Fluidization Test Results
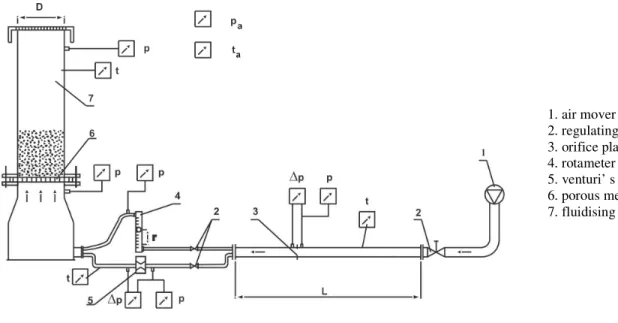
Fluidization tests were carried out in a standard type of experimental rig (Fig. 2) with the column diameter D = 150 mm. As very low air flow rates were used, a combination of three metering devices was used to accurately cover the whole range (orifice plate, rotameter and Venturi's nozzle). The data were recorded as the fluidizing air velocity was both
increasing and decreasing. Different initial bed heights were used, ranging from 70 to 300 mm.
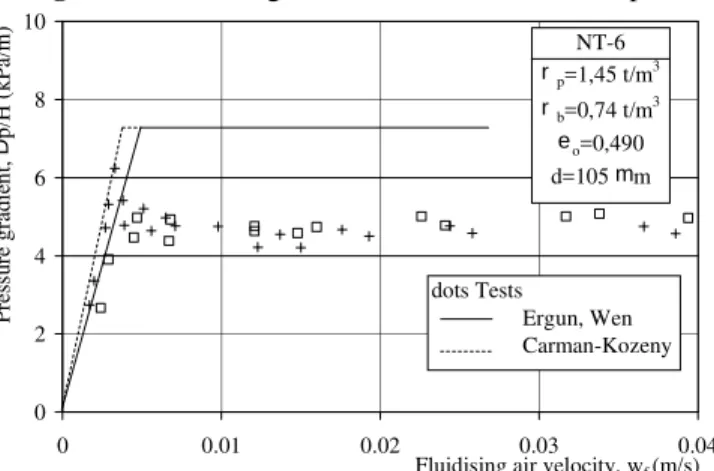
results are then plotted in Fig. 4 (for NT-6) and in Fig. 5 (for NT-9).
A remarkable agreement can be seen with all test results for sample NT-9 and for the lower air velocities for sample NT-6. A significant discrepancy appears only for sample NT-6 at higher air velocity, above the experimental value of the minimum fluidizing velocity. Actually, the obtained constant value of pressure gradient (4.7 kPa/m) was significantly lower than the expected one from equation 3 (7.3 kPa/m). The results for this pressure gradient with other samples, which are not presented here, were similar:
∆Pb /H = (4.2 - 4.5) kPa/m for samples with ρb0 = (610 - 700) kg/m3,
∆Pb /H = (4.7 - 5.2) kPa/m for samples with ρb0 = (715 - 785) kg/m3.
This discrepancy occurred partly due to the presence of uncombusted coal particles with very rough surfaces, which increased voidage locally, to a certain extent due to channeling, although it was not very remarkable.
Both the experimental values for the minimum fluidizing velocity wmf as well as some of the calculated ones can be obtained from Fig. 4 and 5. These values, together with the other calculated ones, are given in Table 3. The values for wmf for
other ash samples (with slightly different physical characteristics) were in the range (0.0035-0.0065) m/s.
If one wants to determine the value for wmffrom Fig. 1, using value Arb only, the range would be wmf = (0.0036 - 0.0086) m/s for NT-6 and wmf = (0.0425 - 0.1180) m/s for NT-9. It is now obvious that all values from Table 3 fall in this range. However, according to Wen and Yu (1966), the ratio between maximum and minimum values of Remf and hence wmf, for Arb < 105 is in the order of 2.5! Therefore, the prediction of wmf, relying on any relation Remf= f(Arb) can be very inaccurate. Some more material characteristics need to be involved too.
Resistance of the Porous Membrane
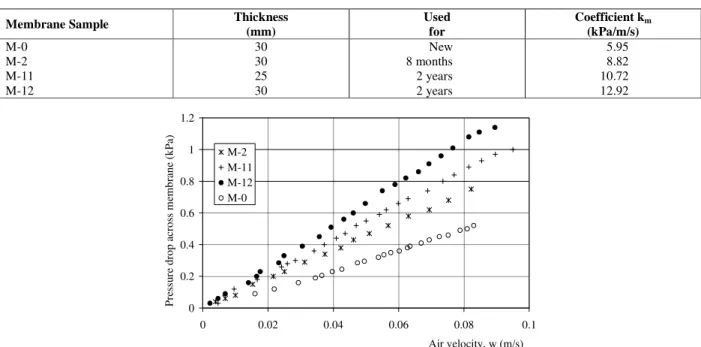
The porous membrane at the "Nikola Tesla B" power plant is made of compacted wool, around 30mm thick. As its membrane resistance coefficient km increases during normal operation of the ash handling plant, the point is reached when the fan can no longer serve the duty. Therefore, four different samples of the membranes were tested in the laboratory in order to determine their lifetime. The obtained test results are shown in Fig. 6.
The values of the coefficient km, as well as other characteristics of the membrane samples are given in Table 4. It can be seen that the coefficient km depends strongly on the exploitation time and this has to be considered in the design.
1. air mover 2. regulating valve 3. orifice plate 4. rotameter 5. venturi’ s nozzle 6. porous membrane 7. fluidising column
794 M. Stanojevi, D. Radi, A. Jovovi, M. Pavlovi and V. Karamarkovi
0 2 4 6 8 10 12 14
0 0.02 0.04 0.06 0.08 0.1 0.12 0.14
Fluidising air velocity, wf (m/s)
P
re
ss
u
re
g
ra
d
ie
n
t,
D
p
/H
(
k
P
a/
m
)
NT-9 (wf increases) NT-9 (wf decreases) NT-6 (wf increases) NT-6 (wf decreases)
Figure 3: Pressure gradient test data for ash samples
0 2 4 6 8 10
0 0.01 0.02 0.03 0.04
Fluidising air velocity, wf (m/s)
P
re
ss
u
re
g
ra
d
ie
n
t,
Dp
/H
(
k
P
a/
m
)
NT-6
rp=1,45 t/m3
rb=0,74 t/m3
eo=0,490 d=105 mm
dots Tests
Ergun, Wen Carman-Kozeny
Figure 4: Comparison of test data for NT-6 with some proposed formulae
0 2 4 6 8 10 12 14
0 0.05 0.1 0.15 0.2 0.25
Fluidising air velocity, wf (m/s)
P
re
ss
u
re
g
ra
d
ie
n
t,
Dp
/H
(
k
P
a/
m
)
dots Tests Ergun, Wen Carman-Kozeny
NT-9
rp=2,17 t/m3
rb=1,18 t/m3
eo=0,456 d=320 mm
Figure 5: Comparison of test data for NT-9 with some proposed formulae
Table 3: Values of minimum fluidizing velocity wmf obtained by different sources
NT-6 (Arb = 60) NT-9 (Arb = 2541)
Remf wmf Error Remf wmf Error
Source
- m/s % - m/s %
Test 0.026 0.0038 - 1.38 0.0650 -
Wen, Yu 0.036 0.0052 +37 1.51 0.0711 +9
Baeyens, Geldart 0.041 0.0059 +55 1.34 0.0634 -2
Carman-Kozeny 0.027 0.0039 +3 1.14 0.0539 -17
Table 4: Characteristics of the porous membrane
Membrane Sample Thickness
(mm)
Used for
Coefficient km
(kPa/m/s)
M-0 30 New 5.95
M-2 30 8 months 8.82
M-11 25 2 years 10.72
M-12 30 2 years 12.92
0 0.2 0.4 0.6 0.8 1 1.2
0 0.02 0.04 0.06 0.08 0.1
Air velocity, w (m/s)
P
re
ss
u
re
d
ro
p
a
cr
o
ss
m
em
b
ra
n
e
(k
P
a)
M-2 M-11 M-12 M-0
Figure 6: Test data for porous membrane
IMPLICATION OF THE RESULTS OF AIR SLIDE DESIGN PARAMETERS
In order to analyze the air slide operating conditions, the total pressure drop ∆pt = ∆Pm + ∆Pb was measured in the fluidizing rig using the same initial height of ash (H = 100mm) as estimated in the air slide and new porous membrane. The results are presented in Fig. 7.
Another set of tests was carried out at the plant where fan characteristics were measured. It showed that superficial air velocity through the bed was wa = 0.051 m/s, hence 8 ÷ 15 times higher than wmf for standard quality ash, which is more than sufficient for ash handling in an air-slide system. In actual fact, another important parameter in the design of the air-slide is often forgotten: the ratio of vertical to horizontal cross-sectional areas of the air-slide (or length to height ratio). This ratio determines the superficial axial air velocity distribution along the air-slide, once the fluidizing air velocity is set. The ratio at the "Nikola Tesla B" plant was 40, which means that the axial air velocity reaches was=2.04 m/s at the end, and confirms the visual conclusion on the low velocity pneumatic conveying mode of flow in the air-slide.
On the other hand, velocity wa is less than wmf required for the ash with high SiO2 content, which occurs from time to time, and is not sufficient to fluidize it. Therefore, if only a 20% higher value of minimum fluidizing velocity is adopted (wal =0.078 m/s), it will give very high velocity along the air slide (was =3.12 m/s).
Another consequence of a high fluidizing air velocity is the entrainment of fine particles in the air
stream leaving the surface of the bed. Theoretically, this happens when the upward velocity exceeds the particle terminal velocity. Fig. 8 shows the theoretical relationship between terminal velocity and particle size for the standard quality ash. During the fluidizing laboratory tests, it was noticed that a considerable amount of ash was leaving the bed at the velocity (0.060 - 0.070) m/s, which corresponds to particle size (37 - 42) µm. At the velocity wa = 0.051 m/s, the maximum particle size which leaves the bed is still high (34 µm).
796 M. Stanojevi, D. Radi, A. Jovovi, M. Pavlovi and V. Karamarkovi
0 0.5 1 1.5 2 2.5 3
0 0.02 0.04 0.06 0.08 0.1 0.12 0.14
Fluidising air velocity, wf (m/s)
T
o
ta
l
p
re
ss
u
re
d
ro
p
,
Dp
(
k
P
a
)
NT-9 (wf increases) NT-9 (wf decreases) NT-6 (wf increases) NT-6 (wf decreases)
Figure 7: Total pressure drop data for NT-6 and NT-9
0.15
Particle size (µm) 0.1
0.05
0 0
10 20 30 40 50 60
T
e
rm
in
a
l
v
e
lo
c
it
y
νt
(m/
s
)
0.15
Particle size (µm) 0.1
0.05
0 0
10 20 30 40 50 60
T
e
rm
in
a
l
v
e
lo
c
it
y
νt
(m/
s
)
Figure 8: Terminal velocity for standard quality ash
CONCLUSION
Investigation has shown that the pressure signal from the air-slide will not necessarily indicate that the ash quality changed, as total pressure drop remains almost the same at air velocity 0.03 ÷ 0.04 m/s. At lower values standard quality ash gives higher resistance, being less permeable, whereas at higher values it gives lower pressure drop. Thus, if the total pressure drop data analysis for a designed air velocity shows that there is no significant difference, then either chemical analysis of the coal or visual control should be used as a signal for implementing emergency measures.
Total pressure drop ∆pt which the fan should deliver will change significantly as the porous membrane gets filthy. At the air flow rate measured at the plant and standard quality ash, ∆pt would be 1.0 kPa with a new membrane and 1.4 kPa with a membrane used for two years. In this case the total pressure drop can be used as a reliable indicator for signaling the need for change a porous membrane.
This analysis deals with various aspects of the design of reliable flow in an air-slide system. The prediction of some flow parameters (minimum fluidizing velocity, pressure drop across fluidized bed) offered in the literature can be used as a guideline. However, in order to design key parameters, required fluidizing velocity and product flow rate, reliable experimental data is essential. Furthermore, the change in flow characteristics of some elements of an air-slide system (product, porous membrane, air mover) should be considered at the initial stage of the design in order to prevent operating problems.
NOMENCLATURE
∆pb pressure drop through the bed kPa
∆pm pressure drop through the porous membrane
kPa
∆pt total pressure drop kPa km membrane resistance
coefficient
H bed height m
εo porosity of fixed bed (-)
εmf minimum fluidization porosity
(-)
wa superficial air velocity through the bed
m/s
wmf minimum fluidizing air velocity
m/s
wf fluidizing air velocity m/s
vt terminal velocity m/s
ρf air density kg/m3
µ dynamic viscosity of air kg/m⋅s
ν kinematic viscosity of air m2/s d mean particle diameter µm
ρp particle density kg/m3
ρb bulk density kg/m3
Arb Archimedes number (-)
Remf Reynolds number (-)
CD drag coefficient (-)
Φs Sphericity (-)
REFERENCES
Baeyens, J. and Geldart, D., Predictive Calculations of Flow Parameters in Gas Fluidised Beds and Fluidisation Behaviour of Various Powders, Proc. Conf. La Fluidisation et ses Applications, Toulouse, October 1973, pp. 263-273 (1973). Carman, P. C., Fluid Flow through Granular Beds,
Trans. Inst. Chem. Engrg, Vol. 15, No. 1, London, pp. 150-166 (1937).
Ergun, S., Fluid Flow through Packed Columns, Chem. Engrg. Progress, Vol. 48, No. 2, pp. 89-94 (1952). Leva, M., Fluidization, McGraw-Hill, New York
(1959).