ISSN 0104-6632 Printed in Brazil
www.abeq.org.br/bjche
Vol. 26, No. 01, pp. 159 - 169, January - March, 2009
*To whom correspondence should be addressed
Brazilian Journal
of Chemical
Engineering
HYDROGEN FROM BIOMASS GAS STEAM
REFORMING FOR LOW TEMPERATURE FUEL
CELL: ENERGY AND EXERGY ANALYSIS
A. Sordi
1*, E. P. Silva
2,3, L. F. Milanez
3, D. D. Lobkov
2,3and S. N. M. Souza
41Federal Technology University, Paraná, Rua Alagoas 200, 86020-430, Londrina - PR, Brazil.
E-mail: [email protected]
2University of Campinas, UNICAMP, Physics Institute, Hydrogen Laboratory,
P.O. Box 6039, 13083-970, Campinas - SP, Brazil.
3University of Campinas, UNICAMP, Faculty of Mechanical Engineering, Department of Energy,
P.O. Box 6122, 13083-970, Campinas - SP, Brazil.
4State University of West Parana, UNIOESTE, 85806-300, Cascavel - PR, Brazil.
(Submitted: September 28, 2007 ; Accepted: July 4, 2008)
Abstract - This work presents a method to analyze hydrogen production by biomass gasification, as well as
electric power generation in small scale fuel cells. The proposed methodology is the thermodynamic modeling of a reaction system for the conversion of methane and carbon monoxide (steam reforming), as well as the energy balance of gaseous flow purification in PSA (Pressure Swing Adsorption) is used with eight types of gasification gases in this study. The electric power is generated by electrochemical hydrogen conversion in fuel cell type PEMFC (Proton Exchange Membrane Fuel Cell). Energy and exergy analyses are applied to evaluate the performance of the system model. The simulation demonstrates that hydrogen production varies with the operation temperature of the reforming reactor and with the composition of the gas mixture. The
maximum H2 mole fraction (0.6-0.64 mol.mol
-1
) and exergetic efficiency of 91- 92.5% for the reforming reactor are achieved when gas mixtures of higher quality such as: GGAS2, GGAS4 and GGAS5 are used. The use of those gas mixtures for electric power generation results in lower irreversibility and higher exergetic efficiency of 30-30.5%.
Keywords: Hydrogen; Fuel cell; Gasification gas of biomass; Steam reforming; Thermodynamic analysis.
INTRODUCTION
The fuel cell is an electrochemical device that converts the fuel chemical energy into electrical energy directly. The main classification of fuel cells is by type of electrolyte used and operation
temperature. PEMFC uses NAFION® membrane as
the electrolyte and gaseous diffusion electrodes with platinum (Pt) as catalyst, and the operating temperature is under 80ºC. Due to the low temperature, the PEMFC operates only with hydrogen of high purity (99.99%mol.mol-1), and the concentration of carbon monoxide in the gaseous flux should not exceed 10 µmol.mol-1.
The main sources for hydrogen production are: water, fossil hydrocarbons and biomass. Technologies utilized to remove the hydrogen of those sources are: water electrolysis and hydrocarbon reforming.
Hydrogen can be obtained from biomass mainly through two processes, both involving the reforming of methane. The first is the anaerobic degradation of organic matter, producing biogas mainly composed of methane (CH4) and carbon dioxide (CO2). The
160 A. Sordi, E. P. Silva, L. F. Milanez, D. D. Lobkov and S. N. M. Souza
The gasification gas of biomass is composed of H2,
CO, CH4, CxHy, CO2 and N2. The molar fractions of
these gaseous species in the GGAS composition depend on the design of the gasifier, the biomass composition and operational conditions. The potential of gasification gas to produce hydrogen depends, in turn, on its composition, mainly on its CH4 and CO
contents. For electricity generation in a low-temperature fuel cell, such as the PEMFC, it is necessary a gas processing (reforming and purification) until there is only hydrogen in the output gaseous flow.
This work presents a methodology for the thermodynamic simulation of hydrogen production by reforming the gasification gas of biomass. Gas mixtures from different gasification processes were used in order to find which had the highest potential for hydrogen and electricity production. The "highest potential" mixture is understood as the one in which the reforming and purification of the gasification gas of biomass results in the minimum irreversibility for the total system.
PEMFC / GASIFICATION GAS SYSTEM
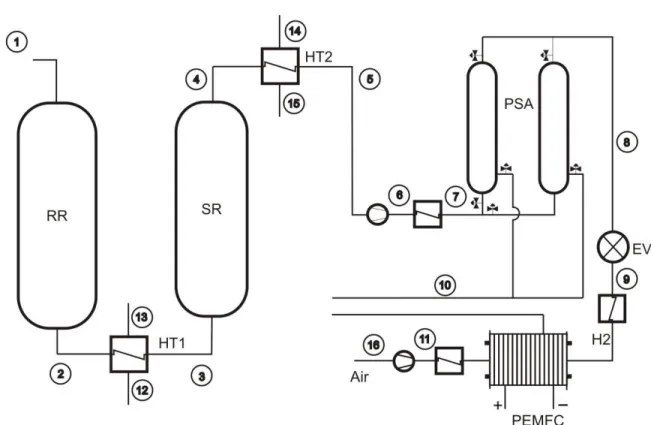
Figure 1 illustrates the model of the system for hydrogen and electricity production from gasification gas of biomass. The gas enters the reforming reactor at 850°C and atmospheric pressure at position 1, and leaves at position 2 at a temperature that depends on its composition at the entrance. The reform gas must be cooled before passing through the shift reactor for the reaction of carbon monoxide with steam. After the shift reactor, the shift gas must be cooled and compressed. The last part of the system is hydrogen purification by a PSA cycle and electrical energy production in PEMFC stacks. Currently, the PEMFC stacks are built on a power scale ranging up to 250 kW. In this work the fuel cell power was calculated based on the gas flow of GGAS1 pilot plant. Position 7 represents the flow of pure hydrogen, and position 9 represents the flow of the exhaust gas mixture at the PSA exit.
Hydrogen from Biomass Gas Steam Reforming for Low Temperature Fuel Cell: Energy and Exergy Analysis 161
Brazilian Journal of Chemical Engineering Vol. 26, No. 01, pp. 159 - 169, January - March, 2009
THERMODYNAMICS OF THE FUEL CELL
According to Larminie and Dicks (2003), the thermodynamics of the fuel cell is represented by the reaction (1) and equations below. The Global reaction of hydrogen with oxygen from air is:
1
2(g) 2 2(g) 2 (l)
H + O →H O Rc.(1)
The maximum electrical work W that can be el produced by the fuel cell is:
el
W dH TdS
−δ = −
or:
el
W G H T S
− = Δ = Δ − Δ (1)
Eq. (1) can be written on a molar basis as:
g h T s
Δ = Δ − ⋅ Δ (2)
The available thermal energy is hΔ , therefore the maximum thermodynamic efficiency of the fuel cell is defined as:
TH g h Δ η =
Δ (3)
In reaction (1) two electrons are transferred to a circuit external to the fuel cell. For each mol of hydrogen involved in the reaction, 2N electrons are transferred, where N is the Avogadro’s number. If -e is the charge of an electron then the charge flow will be (DOE, 2002):
2N e 2F
− ⋅ = − (4)
During the operation of the fuel cell, a difference of potential E appears between the cell electrodes.
The electrical work w is calculated by the el
equation:
el
w = − ⋅2F E (5)
If there are no irreversibilities present in the system, then the produced work will be equal to the Gibbs free energy of the reaction:
g 2F E
Δ = − ⋅ and
(6) g
E 2F Δ
=
Equation (6) calculates the ideal voltage or reversible potential for a fuel cell operating with hydrogen. For standard conditions (298.15 K and 101.325 kPa), the following applies:
0
0 g
E
2F −Δ
= (7)
This results in 1.229 V for a fuel cell based in Rc.(1). However, several phenomena related to the kinetics of the electrochemical conversion in the electrodes result in losses (overpotentials) in the cell potential when the current intensity increases (Matelli and Bazzo, 2005). The overpotentials are known as: polarization by activation, ohmic polarization and polarization by concentration. The electrochemical efficiency quantifies the overpotential effects by the equation:
OP
elq 0
E
E
η = (8)
Where EOP is the real operating voltage of the fuel cell. According to Matelli and Bazzo (2005), the practical efficiency can be defined by the thermodynamic efficiency multiplied by the electrochemical efficiency:
PRT TH elq
η = η ⋅η (9)
For a fuel cell system operating with hydrogen from biomass gasification gas reforming, the overall efficiency is associated to the total power output and the gas lower heating value (LHV). This efficiency is named first law efficiency of the PEMFC/ gasification gas system:
el el
I,FC
GGAS GGAS
W W
n .LHV Q
η = = (10)
Where the electrical power of fuel cell is:
(
3)
el OP
W = ⋅i 10− ⋅ ⋅A E (11)
GASIFICATION GAS REFORMING AND PURIFICATION
The gasification gas of biomass has a hydrogen molar fraction that can be maximized by the reforming of the molar fractions of methane (CH4),
162 A. Sordi, E. P. Silva, L. F. Milanez, D. D. Lobkov and S. N. M. Souza
For maximum conversion of these gaseous species into hydrogen two reactors are needed: one for hydrocarbon reforming and another for CO processing.
The process of reforming is defined as a thermo-chemical and catalytic conversion of a liquid, solid or gaseous fuel into a hydrogen-rich mixture. According to Silva (1991), most processes use light hydrocarbons for extracting hydrogen. Light hydrocarbons are those with molecular mass between methane and naphtha, and a boiling point below 250°C. These compounds can react with water at temperatures of 650-900°C. In the case of methane, a nickel/alumina catalyst is used.
The best known reforming methods are: steam reforming, partial oxidation, and auto-thermal reforming. In this work, steam reforming was considered. The global gasification gas reforming reactions are described by Rcs. (2) to (4).
4 2 2 2 2
CH +aH O→bCO+cCO +dH +eH O Rc.(2)
2 4 2 2 2 2
C H +fH O→gCO+hCO +iH +jH O Rc.(3)
2 2 2
CO+lH O→mCO +nH Rc.(4)
The application of H2 for power generation in
PEMFC requires that the anode inlet gas have a CO concentration lower than 10 µmol.mol-1, since CO is a poison to the fuel cell eletrocatalyst (Zalc and Löffler, 2002). If hydrogen is produced from hydrocarbons reforming (i.e. biomass gasification gas), purification is required in order to reduce the CO levels to cell requirements. This task is partially accomplished by a water gas shift (WGS) reactor (reaction 4) (Giunta et al., 2006). The final CO cleanup occurs in a preferential oxidation (PrOx) or in the pressure swing adsorption (PSA) unit.
The WGS reaction is moderately exothermic with a heat reaction, HΔ = -40 kJ.mol-1. The high temperatures favor intrinsic kinetics while lower temperatures favor high equilibrium CO conversion.
Adiabatic operation with an inlet-outlet temperatures of 250-350°C yields poor performance because the temperature of the process stream increases to a point at which equilibrium conversion is low (<80%). Isothermal operation with inlet-outlet temperature of 250°C initially yields conversions lower than those obtained adiabatically, but the conversion curve continues to increase to an equilibrium conversion value of 90% (Zalc and Löffler, 2002).
Significantly better performance can be achieved by operating at a relatively high temperature and exploiting reaction kinetics when the gas
composition is far from equilibrium and then lowering the temperature as thermodynamics begins to limit the CO conversion (Zalc and Löffler, 2002). This task is accomplished in two adiabatic stages using two different catalysts with intermediate cooling. The first reactor operates between 300 and 500°C (high temperature stage HTS) and uses an iron-based catalyst (Fe/Cr). The second reactor operates at lower temperatures (180-300°C) (low temperature stage LTS) and uses a copper-zinc catalyst supported on alumina Cu/Zn/Al (Francesconi et al., 2007).
Hydrogen final cleanup can be achieved by a PSA system, which is widely used for gas purification. PSA is generally employed for oxygen or nitrogen from air, and for hydrogen generated by processes such as hydrocarbon reforming. This technology has been in commercial use for hydrogen purification since 1966, and is currently widely used (Myers et al., 2002).
Basically, a PSA works by the action of an adsorbent bed selective for certain gaseous species. A gaseous mixture is introduced into the bed under high pressure, and the adsorbing solid selectively adsorbs certain components, allowing the non-adsorbed component to pass through the bed as a purified gas.
The PSA systems operate in cycles, where three steps are basic to any process: pressurization, adsorption and depressurization. In the depressurization occurs the adsorbent regeneration and desorption of components retained, and then the process returns to its initial condition. Therefore, the removal of species adsorbed is done by total pressure reduction, which gives the PSA systems a faster pace in cycles and greater production per unit volume of adsorbent bed than other types of adsorption processes (Neves and Schvartzman, 2005). The fastness and the operation with two or more sync beds allows input and output of products continuously, these features are essential for fuel cell systems.
The energy required for this separation of gaseous species is obtained from the mechanical work of compressing the gaseous mixture. Energy expended in this mechanical work is a significant component of the operational cost of a PSA system.
SYSTEM PERFORMANCE ANALYSIS
Hydrogen from Biomass Gas Steam Reforming for Low Temperature Fuel Cell: Energy and Exergy Analysis 163
Brazilian Journal of Chemical Engineering Vol. 26, No. 01, pp. 159 - 169, January - March, 2009
to find the minimization point of the total Gibbs free energy of the system. In this work, the EES (Engineering Equation Solver) was used in the simulation of the gasification gas reforming.
The hydrogen molar fraction in the mixture is a function of the temperature, pressure and the steam/carbon ratio (γ). In the present work, the pressure was 101.3 kPa, and the parameter γ was equal to 2 for CH4 reforming, 3 for C2H4, and 1 for CO reforming.
With regard to input conditions, the gasification gas may have compositions depending on the gasification process and biomass type. Table 1 illustrates the molar fractions of some gaseous mixtures produced by different gasification processes reported by Bain (2004). Initials in Table 1 stand for:
CFB: circulating fluidized bed
FB: fluidized bed
IFB: indirect fluidized bed
ICFB: indirect circulating fluidized bed DRF: downdraft
UPF: updraft
Once the hydrogen molar fraction in the gaseous mixture in the shift reactor (shift gas) is calculated, the next step is the hydrogen purification by PSA. In the present work, a PSA system was considered with an operation pressure of 650 kPa, and a hydrogen recovery factor of 0.85 of the volumetric flow of the molar fraction of this species in the shift gas. These characteristics were chosen based on research and development data from the Hydrogen Laboratory of the University of Campinas Physics Institute.
Thermodynamic analysis of the system illustrated in Fig. 1 assumed the ideal gas model. Equations (12) and (13) represent the enthalpy and entropy calculations for an ideal gas mixture.
T n
0
i i i i
i 1 T0
h y h cp .dT
=
⎛ ⎞
⎜ ⎟
= ⋅⎜ + ⎟
⎝ ⎠
∑
∫
(12)( )
T n
0 i
i i i i
i 1 T0
cp
s y s .dT R.ln y
T =
⎛ ⎛ ⎞ ⎞
⎜ ⎟
= ⋅ +⎜ ⎜ ⎟ − ⎟
⎝ ⎠
⎝ ⎠
∑
∫
(13)The mass and energy balances in reactors and heat exchangers are represented by Eqs. (14) to (16).
in out
m = m
∑ ∑
(14)(
)
(
)
n n
i i P i i R
i 1 i 1
n h (T) n h (T) 0
= =
− =
∑
∑
(15)n n
in in out out
i 1 i 1
n h n h Q
= =
⋅ − ⋅ =
∑
∑
(16)The exergy balance for a control volume is:
(
)
( )
CV out out in in
W − =I n ex −n ex (17)
The definition of specific physical and chemical exergy, according to Szargut et al. (1988), is represented by Eqs.(18) and (19):
(
) ( )
n
0 0
PH i i 0 i i
i 1
ex h h T s s
=
=
∑
− − − (18)n n
0
CH i CHi 0 i i
i 1 i 1
ex y .ex R.T . y .ln .y
= =
=
∑
+∑
(19)Where the total specific exergy is:
CH PH
ex=ex +ex (20)
The reference environment proposed by Szargut et al. (1988), where standard temperature and pressure (298.15 K and 101.325 kPa) and the standard atmosphere composition can be found was used to define physical and chemical exergies.
Table 1 GGAS composition for different gasification processes.
Process CFB ICFB FB IFB IFB FB DRF UPF
Fluid reagent air steam air steam steam air air air
Biomass Bagasse Wood Wood Black liquor Wood Wood Wood Wood
mol.mol-1 GGAS1 GGAS2 GGAS3 GGAS4 GGAS5 GGAS6 GGAS7 GGAS8
YH2 10.0 26.2 21.7 29.4 31.5 11.0 16.0 10.0
YCO 12.7 38.2 23.8 39.2 22.7 17.0 21.5 14.8
YCO2 16.7 15.1 9.4 13.1 27.4 18.0 14.4 12.8
YN2 56.4 1.6 41.6 0.9 3.2 44.0 44.8 57.5
YCH4 3.7 14.9 2.9 13.0 11.2 7.0 3.3 4.9
164 A. Sordi, E. P. Silva, L. F. Milanez, D. D. Lobkov and S. N. M. Souza
Exergetic efficiency calculations adopted the input/output criterion defined by Kotas (1995) as ratio efficiency. The ratio efficiencies of the following control volumes were calculated: reforming and shift reactors, heat exchangers, PSA, PEMFC, and the system as a whole. Eqs.(21) to (26) represent these efficiencies, respectively.
(
)
(
)
(
)
CH ,RR
CH 2 PH 2
CH PH
n ex (REFGAS)
n ex (H O) ex (H O)
n ex (GGAS) ex (GGAS)
ψ = + +
+ (21)
(
)
(
CH)
,SR
CH PH
n ex (SHIFTGAS)
n ex (REFGAS) ex (REFGAS)
ψ = + (22)
(
PH 2)
,PSA
PSA
n ex (H )
W
ψ = (23)
(
)
(
)
PH COLD,out PH COLD,in ,HE
PH HEAT,in PH HEAT,out
n ex , ex ,
n ex , ex ,
− ψ = − (24)
(
el)
,PEMFC
CH 2 AI
W
n ex (H ) W
ψ = + (25)
(
el)
II,FC
CH AI PSA
W
n ex (GGAS) W W
η = + + (26)
RESULTS
Figures 2 and 3 show the molar fractions of the equilibrium composition of GGAS1 and GGAS2 reforming simulations respectively. The potential for hydrogen production is higher from GGAS2 than
from GGAS1 because of its higher CH4 and CO
molar fractions. The temperature at which hydrogen production reaches its peak depends on the amount of CH4, CO and inert gases such as N2 and CO2. The
CH4 reforming reaction is enhanced by higher
temperatures (650-850°C), while the CO reforming reaction is enhanced by lower temperatures (250°C) in an isothermal reactor as Zalc and Löffler (2002). Thus, gas cooling is necessary at the reforming reactor exit to allow the conversion of the remaining CO molar fraction in the shift reactor.
In order to allow the use of the gasification gas physical exergy at the reforming reactor, the gas pre-cleaning must be performed by the hot system. If the system is cold, the gaseous mixture must be heated up to the reforming operation temperature again, increasing the energy consumption of the hydrogen production system.
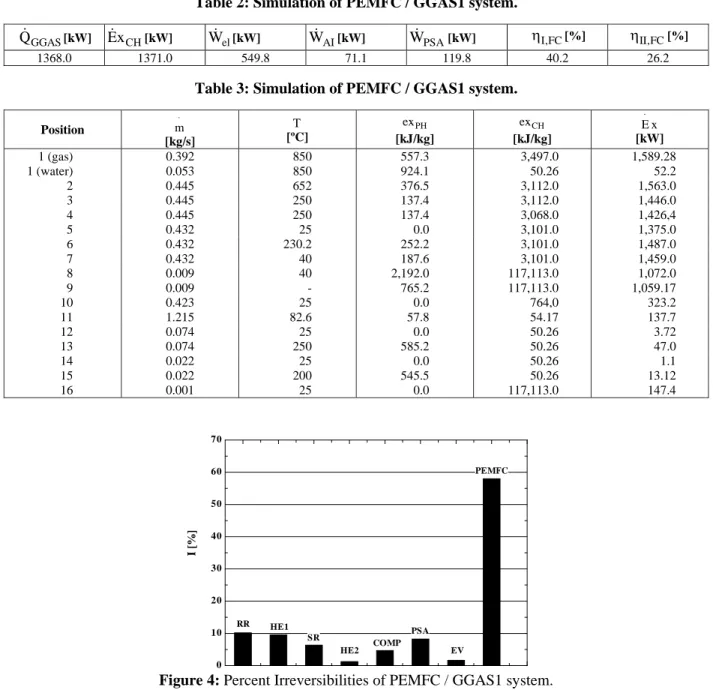
Tables 2 and 3 illustrate the results of thermodynamic simulation for PEMFC / GGAS system in Fig. 1.
Figure 4 shows that the largest contribution in the exergy destruction (irreversibility) occurs in the PEMFC. The process of electrical work transfer in the fuel cell is associated to the chemical potential gradient, and the generation of irreversibility is proportional to this gradient. The exhaust gas temperature of the PEMFC is very close to the ambient temperature, and therefore there is not much heat produced by the PEMFC available.
700 800 900 1000 1100 1200 1300 1400
0 0,1 0,2 0,3 0,4 0,5 0,6 T [K] CH4 CO2 H2 CO H2O
N2 yi [m o l. m o l -1 ] 0.6 0.5 0.4 0.3 0.2 0.1
Figure 2: Molar fractions from GGAS1 reforming simulation
500 700 900 1100 1300 1500
0 0,1 0,2 0,3 0,4 0,5 0,6
T [K]
yi [m ol .m o l -1 ] CH4 CO2 H2 CO
C2H4
H2O
N2 0.6 0.5 0.4 0.3 0.2 0.1
Hydrogen from Biomass Gas Steam Reforming for Low Temperature Fuel Cell: Energy and Exergy Analysis 165
Brazilian Journal of Chemical Engineering Vol. 26, No. 01, pp. 159 - 169, January - March, 2009
Table 2: Simulation of PEMFC / GGAS1 system.
GGAS
Q [kW] Ex CH[kW] Wel[kW] WAI[kW] WPSA[kW] ηI,FC[%] ηII,FC[%]
1368.0 1371.0 549.8 71.1 119.8 40.2 26.2
Table 3: Simulation of PEMFC / GGAS1 system.
Position m⋅
[kg/s]
T [ºC]
PH
ex [kJ/kg]
CH
ex
[kJ/kg]
E x⋅ [kW]
1 (gas) 0.392 850 557.3 3,497.0 1,589.28
1 (water) 0.053 850 924.1 50.26 52.2
2 0.445 652 376.5 3,112.0 1,563.0
3 0.445 250 137.4 3,112.0 1,446.0
4 0.445 250 137.4 3,068.0 1,426,4
5 0.432 25 0.0 3,101.0 1,375.0
6 0.432 230.2 252.2 3,101.0 1,487.0
7 0.432 40 187.6 3,101.0 1,459.0
8 0.009 40 2,192.0 117,113.0 1,072.0
9 0.009 - 765.2 117,113.0 1,059.17
10 0.423 25 0.0 764,0 323.2
11 1.215 82.6 57.8 54.17 137.7
12 0.074 25 0.0 50.26 3.72
13 0.074 250 585.2 50.26 47.0
14 0.022 25 0.0 50.26 1.1
15 0.022 200 545.5 50.26 13.12
16 0.001 25 0.0 117,113.0 147.4
0 10 20 30 40 50 60 70
I [
%
]
PEMFC
RR HE1
SR
HE2 COMP
PSA
EV
Figure 4: Percent Irreversibilities of PEMFC / GGAS1 system.
The gaseous mixture composition has an important effect on the system performance. For the gaseous mixtures in Table 1, Figure 5 shows the variation on reformer exergetic efficiency as a function of the nitrogen molar fraction in the gasification gas of biomass. The higher the amount of this inert gas is, the lower the reformer efficiency. In practice, the presence of inert gases has a negative influence on the reaction kinetics.
Although the effectiveness of the reforming process is very important for the performance of the system, the PSA has the most striking influence on the energy consumption. Hydrogen purification is the main determinant of energy
166 A. Sordi, E. P. Silva, L. F. Milanez, D. D. Lobkov and S. N. M. Souza
0 0,1 0,2 0,3 0,4 0,5 0,6
84 85 86 87 88 89 90 91 92 93
yN
2 [mol.mol-1] ψRR
[%]
0 0.1 0.2 0.3 0.4 0.5 0.6
Figure 5: Exergetic efficiency of the reforming reactor as a function of nitrogen molar function
0,25 0,3 0,35 0,4 0,45 0,5 0,55 0,6 0,65
20 25 30 35 40 45 50 55
yH
2 [mol.mol -1
]
ψPS A [%
]
0.25 0.3 0.35 0.4 0.45 0.5 0.55 0.6 0.65
Figure 6: Exergetic efficiency of PSA as a function of hydrogen molar fraction in the SHIFTGAS
575 615 655 695 735 775
I [
k
W]
GGAS1 GGAS2 GGAS3 GGAS4 GGAS5 GGAS6 GGAS7 GGAS8
Figure 7: Total irreversibilities of system for different GGAS composition
Figure 8 shows the variation of the first and second law efficiencies of the fuel cell system as a function of the hydrogen molar fraction in the shift gas. The first law efficiency is an adequate parameter to measure system performance but is not adequate to measure the gas quality, since the lower heating value does not reflect the quality of the gaseous mixture for hydrogen production. The second law efficiency, on the other hand, is indicative of the gasification gas quality in the
Hydrogen from Biomass Gas Steam Reforming for Low Temperature Fuel Cell: Energy and Exergy Analysis 167
Brazilian Journal of Chemical Engineering Vol. 26, No. 01, pp. 159 - 169, January - March, 2009
0,25 0,3 0,35 0,4 0,45 0,5 0,55 0,6 0,65
26 28 30 32 34 36 38 40 42
yH2 [mol.mol-1]
η
[%
]
ηI,FC
ηII,FC
0.25 0.3 0.35 0.4 0.45 0.5 0.55 0.6 0.65
Figure 8: First and second law efficiencies as a function of the hydrogen molar fraction
0,25 0,3 0,35 0,4 0,45 0,5 0,55 0,6 0,65
160 200 240 280 320
yH
2 [mol.mol -1
]
I [kW
]
0.25 0.3 0.35 0.4 0.45 0.5 0.55 0.6 0.65
Figure 9: Total system irreversibility as a function of the H2 molar fraction in the SHIFTGAS
CONCLUSIONS
The simulation demonstrated that the hydrogen production varies with the operation temperature of the reforming reactor, and with the gas mixture composition. These two variables are inherently dependent because of the particular chemical equilibrium state for each thermo-chemical reaction of system species.
The temperature of 850°C in output gasification reactor is sufficient for maximum methane conversion and hydrogen production. But hot gas cleaning should be used in gasification process so that gasification gas physical exergy can be utilized in steam reforming. In cold gas cleaning the cooling of the gasification gas to the environment temperature in the wet scrubber results in a thermal energy loss, which is a disadvantage of the cold cleaning. Gas reheating for the steam reforming reaction also causes the destruction of the exergy inherent to the heat transfer process, and makes the system more complex.
The exergetic efficiency of the reforming reactor also depends on the gas composition; for
the lower quality gas (GGAS1) the efficiency was 85%. For GGAS2, which is the best quality gaseous mixture, the reactor efficiency presented a value of 92.5%.
Both the exergetic efficiency and the total irreversibility values of the power generation system with PEMFC were, respectively, 26.2% and 775 kW for GGAS1 and 30.5% and 575 kW for GGAS2. Therefore, to achieve the maximum performance of the hydrogen production and electricity generation in the fuel cell systems, the gasifier should be designed to obtain gas mixture similar to GGAS2.
168 A. Sordi, E. P. Silva, L. F. Milanez, D. D. Lobkov and S. N. M. Souza
ACKNOWLEDGEMENTS
We are thankful to CAPES for the financial support of this work, and to the Hydrogen Laboratory and the Mechanical Engineering Faculty at UNICAMP.
NOMENCLATURE
a, b, c.. molar numbers of a specie in a chemical reaction
(-)
A active area of cell cm2
COMP compressor (-)
p
c specific heat J.kmol-1.K-1
e elementary charge 1.602 x10⁻¹⁹ C
E equilibrium potential V
OC
E open circuit voltage V
OP
E real voltage of cell V
ex specific molar exergy J.kmol-1
Ex exergy transfer rate W
EV expansion valve (-)
F Faraday’s constant 9.6487x10⁷C.
kmol-1
FB fluidized bed (-)
FC fuel cell (-)
g specific Gibbs’free energy J.kmol-1
G Gibbs’ free energy J
GGAS gasification gas of biomass
(-)
h specific molar enthalpy J.kmol-1
H enthalpy J
HE heat exchanger (-)
HTS high temperature stage (-)
i current density mA.cm-2
I
irreversibility rate W
IFB indirect fluidized bed (-)
LHV lower heating value J.kmol-1
LTS lower temperature stage (-)
m mass flow kg.s-1
n molar flow kmol.s-1
N Avogadro’s number 6.02 x10²³
OFFGAS exhaust gas of PSA (-)
P pressure kPa
PSA pressure swing adsorption
(-)
Q heat transfer rate W
R universal gas constant 8,314
J.kmol.K-1
REFGAS gas of reforming reactor (-)
RR reforming reactor (-)
s specific molar entropy J.kmol-1.K-1
S entropy J.K-1
SHIFTGASgas of shift reactor (-)
SR shift reactor (-)
T absolute temperature K)
W work J)
w specific work J.kmol-1
W work transfer rate, power
output
W
WGS water gas shift (-)
y molar fraction mol.mol
-Y molar fraction percent %mol.mol-1
Greeks Letters
γ steam-carbon rate (-)
η efficiency %
ψ rational efficiency %
Subscripts
0 reference state 101.3 kPa and
298.15 K
AI air input (-)
CH chemical (-)
el electrical (-)
elq electrochemical (-)
GGAS gasification gas of biomass (-)
g gas (-)
HT heat exchanger (-)
2
H hydrogen (-)
i ith specie (-)
I first law of thermodynamics (-)
II second law of
thermodynamics
(-)
in inlet (-)
l liquid (-) out outlet (-)
P Product (-)
PH physical (-) PRT practical (-)
R reagent (-)
RR reforming reactor (-)
SR shift reactor (-)
TH Thermodynamic (-)
CV control volume (-)
Superscripts
0 reference state 101.3 kPa and
Hydrogen from Biomass Gas Steam Reforming for Low Temperature Fuel Cell: Energy and Exergy Analysis 169
Brazilian Journal of Chemical Engineering Vol. 26, No. 01, pp. 159 - 169, January - March, 2009
REFERENCES
Bain, R. L., Biomass Gasification Overview, NREL National Renewable Energy Laboratory. US DOE United States Department of Energy, p. 48 (2004).
DOE – U.S. Department of Energy. Fuel Cell Handbook, EG & G Services Parsons, Inc. Science Applications International Corporation, West Virginia, USA, p. 352 (2002).
Francesconi, J. A., Mussati, M. C., Aguirre, P. A., Analysis of design variables for water-gas-shift reactors by model-based optimization, Journal of Power Sources, v. 173, p. 467-477 (2007).
Giunta, P., Amadeo, N. and Laborde, M., Simulation of a Low Temperature Water Gas Shift Reactor Using the Heterogeneous Model/Application to a PEM Fuel Cell, Journal of Power Sources, v. 156 (7) p. 489-496 (2006).
Kotas, T. J., The Exergy Method of Thermal Plant Analysis. Krieger Publishing Company, Florida (1995).
Larminie, J. and Dicks, A. Fuel Cell Systems Explained, John Wiley Sons (2003).
Matelli, J. A., Bazzo, E., A Methodology for Thermodynamic Simulation of High Temperature Internal Reforming Fuel Cell Systems, Journal of Power Sources, v.142, p. 160-168 (2005).
Myers, B. D., Ariff, G. D., James, B. D., Lettow, J. S., Thomas, C. E. and Kuhn, R. C., Cost and Performance Comparison of Stationary Hydrogen Fueling Appliances, The Hydrogen Program Office; Office of Power Technologies; U.S Department of Energy. 123 p. (2002).
Neves, C. F. C and Schvatzman, M. M. A. M., Separação de CO2 por meio da tecnologia PSA,
Química Nova, v.28, n. 4, p. 622-628 (2005). Silva, E. P., Introdução a Tecnologia e Economia do
Hidrogênio. Campinas: Editora da Unicamp (1991).
Szargut, J., Morris, D. R. and Steward, F. R., Exergy Analysis of Thermal, Chemical and Metallurgical Processes, John Benjamins Publishing Co. (1988).

![Figure 2: Molar fractions from GGAS1 reforming simulation 500 700 900 1100 1300 150000,10,20,30,40,50,6T [K]yi [mol.mol-1]CH4CO2H2COC2H4H2ON20.60.50.40.30.20.1](https://thumb-eu.123doks.com/thumbv2/123dok_br/18895012.426104/6.918.478.796.760.1031/figure-molar-fractions-ggas-reforming-simulation-mol-coc.webp)