ISSN 0104-6632 Printed in Brazil
www.abeq.org.br/bjche
Vol. 26, No. 01, pp. 1 - 9, January - March, 2009
Brazilian Journal
of Chemical
Engineering
EFFECT OF CULTIVATION CONDITIONS ON
GLUCOSE-6-PHOSPHATE DEHYDROGENASE
PRODUCTION BY GENETICALLY MODIFIED
Saccharomyces cerevisiae
F. G. Rossi
1, D. P. Silva
1,2,*, J. B. Almeida e Silva
3, M. E. Taqueda
4,
M. Vitolo
1and A. Pessoa-Jr
11
Department of Biochemical-Pharmaceutical Technology, School of Pharmaceutical Sciences, University of São Paulo, 05508-000, São Paulo - SP, Brazil.
2
Institute for Biotechnology and Bioengineering, Centre of Biological Engineering, Fax:: +(351) 253 678986, University of Minho, 4710-057, Gualtar - Braga, Portugal.
E-mail: [email protected], [email protected] 3
Department of Biotechnology, Engineering School of Lorena, University of São Paulo, 12602-810, Lorena - SP, Brazil. 4
Chemical Engineering Dept, University of São Paulo, PQI, 05508-000, São Paulo, SP, Brazil.
(Submitted: September 5, 2006 ; Revised: June 17, 2008 ; Accepted: July 12, 2008)
Abstract - The objective of this research was to improve Glucose-6-phosphate dehydrogenase (G6PD) production by Saccharomyces cerevisiae W303-181, which carry the plasmid YEpPGK-G6PD, by varying the following cultivation conditions: pH value (4.8, 5.7 and 6.6); inoculum concentration (0.1, 0.6 and 1.1 g/L) and initial glucose concentration (20.0, 30.0 and 40.0 g/L). The effect of those variables on G6PD production capability was studied by the application of response surface statistical analysis. The results showed that the highest G6PD production (1594.2 U/L), specific activity (1189.7 U/gcell) and productivity (45.6 U/L.h) occurred at pH 4.8, inoculum concentration of 0.1 g/Land initial glucose concentration of 20.0 g/L, under agitation of 150 rpm at 30oC after 36 h. In this work, the strain expressed about 21 fold more activity than the wild S. cerevisiae strain, being an attractive and promising new source of this enzyme.
Keywords: Saccharomyces cerevisiae; Fermentation; Enzyme production; Glucose-6-phosphate dehydrogenase; Strain genetically modified.
INTRODUCTION
Glucose-6-phosphate dehydrogenase (G6PD) (EC1.1.1.49) is the first enzyme of the pentose phosphate pathway, which is found in almost all animal tissues and microorganisms. This enzyme is used as an analytical reagent for the measurement of hexokinase and creatin-kinase activities, ATP, as well as in enzyme immunoassays, either ELISA (enzyme-linked immunosorbent assay) or EMIT (enzyme multiplied immunotechnique), for
In addition, G6PD can be employed for glucose determination in several beverages and in amended soil (Frey et al., 1999; Mori et al., 1999). This enzyme can also detect low levels of streptavidin and biotin by bioluminescent assays in DNA hybridization reactions, without enzymatic activity loss (Balaguer et al., 1989; Terouanne et al., 1989). As a biosensor the enzyme G6PD can rapidly monitor the concentration of glucose 6-phosphate (G6P) in blood or human tissue at lower costs, and consuming less time than the traditional methods like chromatography or spectroscopy. This monitoring is important because it can directly reflect the relative activity of G6PD in the metabolic pathways, and has been utilized to provide insight into the regulation of G6PD in human erythrocytes and rat liver cells (Bassi et al., 1999).
S. cerevisiae has been widely used for expression of various genes for protein production. As an eukaryotic organism, this yeast is a suitable host for high level production of both secreted and soluble
cytosolic proteins. The S. cerevisiae PGK1
(phosphoglycerate kinase 1) gene encodes one of the most abundant mRNA and protein species in the cell, accounting for between 1% and 5% of the total
cellular mRNA and protein. Therefore, the PGK1
promoter is an attractive option to obtain high levels of protein expression (Lojudice et al., 2001).
The goal of this work was to improve the Glucose-6-phosphate dehydrogenase production by
Saccharomyces cerevisiae W303-181 (genetically
modified S. cerevisiae), which carries a plasmid
containing the G6PD coding sequence under the control of the PGK1 promoter. Because G6PD is a constitutive enzyme, its production from a microorganism is linked to the amount of biomass obtained from a cultivation process. However, attaining a high amount of cell mass depends on the variables evaluated, such as: pH value, inoculum concentration and initial glucose concentration. The common approach of studying one variable at a time, while keeping the others constant within a set of selected values, has the drawbacks of requiring a large number of experiments and missing the interactions among the variables. An alternative, as employed in this work, is the use of statistical experimental designs, which require fewer experiments (Box et al., 1978). This methodology allows the verification of the effects of the variables individually, and their interactions on the enzyme production (Hasmann et al., 2003). A statistical model correlating the variables allowed the optimization of the cultivation process, with
Although G6PD could be attained from several microbial species, in Brazil, the use of S. cerevisiae
as a source of this enzyme and other products (Godfrey and West, 1996) is practical owing to the large experience in handling this strain in industrial plants. In addition, coupling the yeast processing with ethanol production probably should have a positive effect on distillery profits.
MATERIALS AND METHODS
Chemicals
Yeast Nitrogen Base (YNB), aminoacids, nicotinamide adenine dinucleotide phosphate
(NADP), phenylmethylsulfonyl fluoride (PMSF), β
-mercaptoethanol, glucose 6-phosphate (G6P) and glucose were purchased from Sigma Chemical Company (St. Loius, MO). GOD/POD enzymatic kit was purchased from Laborlab (Brazil). All the other chemicals were of analytical grade.
Microorganism and Inoculum Preparation
Saccharomyces cerevisiae W303-181 genetically modified was employed in all experiments; genetic techniques were described in details by Lojudice et al. (2001). The stock culture was maintained at 4oC on agar slants containing: yeast nitrogen base (YNB)
7.4 g/L, glucose 20 g/L, adenine 20 μg/mL,
L-tryptophan 20 μg/mL, uracil 20 μg/mL, L-Histidine
20 μg/mL. A loopful of the stock culture was
transferred to a 250 mL Erlenmeyer flask containing 50 mL of medium previously prepared with the same composition of stock culture and sterilized. For inoculum preparation, the cultures were incubated on a rotary shaker (NBS Gyratory Shaker, New Brunswick Scientific Company, New Brunswick) at 150 rpm, 30oC for 24 h. Following, the cells were
separated by centrifugation (8720 g; 4°C for
30 min), and rinsed with distilled water.
Growth Conditions
The inoculum was transferred to a 250 mL
used in the inoculum preparation (yeast nitrogen
base 7.4 g/L, adenine 20 μg/mL, L- tryptophan
20 μg/mL, uracil 20 μg/mL, L-Histidine 20 μg/mL) always maintaining constant the ratio C/N with the alteration of the variable initial glucose concentration, and the pH value adjusted with buffer
solutions (buffered medium with 0.1 M acetate
solution).
Experimental Design and Statistical Analysis
To verify the influence of pH value, inoculum concentration and initial glucose concentration on the enzyme productivity (yPrG6PD), a 23 factorial
design augmented with orthogonal design was employed. For each of the three variables, high (coded value: +1), medium (coded value: 0) and low (coded value: -1) set points were selected (Table 1). Cultivations representing all the set point combinations were performed, and the assays G6PD
productivity (PrG6PD) and cell productivity (Prcell)
were conducted randomly. They were taken as the dependent variables or responses of the design experiments. The “Statgraphics” (version 6.0) software was used for regression and graphical analysis of the data obtained, following traditional methodology for statistical analysis.
Measurement of Cell and Glucose Concentrations
One milliliter of fermenting medium was centrifuged (8720 g; 10 min - Jouan centrifuge, Saint Herblain/France), and the supernatant was used to measure glucose concentration via the GOD/POD enzymatic kit (Laborlab, kit number 02200). The cell cake was used to measure the cell concentration values of the cultures. This was obtained by using a calibration curve correlating optical density, measured through a spectrophotometer at 600 nm (Beckman DU 640) with dry weight (g/L).
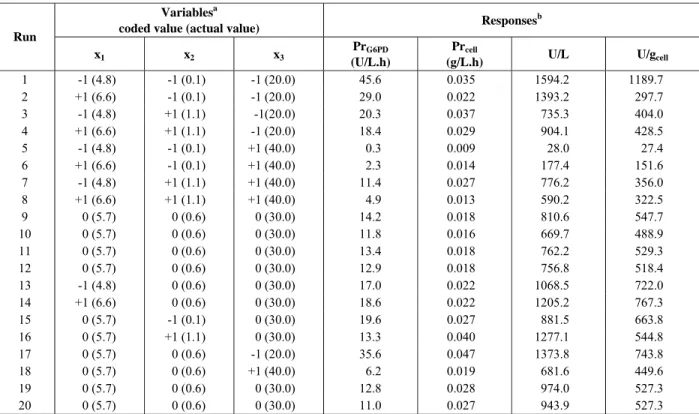
Table 1: Experimental design and results of the 23 full factorial orthogonal composite design.
Variablesa
coded value (actual value) Responses
b
Run
x1 x2 x3
PrG6PD
(U/L.h)
Prcell
(g/L.h) U/L U/gcell
1 -1 (4.8) -1 (0.1) -1 (20.0) 45.6 0.035 1594.2 1189.7
2 +1 (6.6) -1 (0.1) -1 (20.0) 29.0 0.022 1393.2 297.7
3 -1 (4.8) +1 (1.1) -1(20.0) 20.3 0.037 735.3 404.0
4 +1 (6.6) +1 (1.1) -1 (20.0) 18.4 0.029 904.1 428.5
5 -1 (4.8) -1 (0.1) +1 (40.0) 0.3 0.009 28.0 27.4
6 +1 (6.6) -1 (0.1) +1 (40.0) 2.3 0.014 177.4 151.6
7 -1 (4.8) +1 (1.1) +1 (40.0) 11.4 0.027 776.2 356.0
8 +1 (6.6) +1 (1.1) +1 (40.0) 4.9 0.013 590.2 322.5
9 0 (5.7) 0 (0.6) 0 (30.0) 14.2 0.018 810.6 547.7
10 0 (5.7) 0 (0.6) 0 (30.0) 11.8 0.016 669.7 488.9
11 0 (5.7) 0 (0.6) 0 (30.0) 13.4 0.018 762.2 529.3
12 0 (5.7) 0 (0.6) 0 (30.0) 12.9 0.018 756.8 518.4
13 -1 (4.8) 0 (0.6) 0 (30.0) 17.0 0.022 1068.5 722.0
14 +1 (6.6) 0 (0.6) 0 (30.0) 18.6 0.022 1205.2 767.3
15 0 (5.7) -1 (0.1) 0 (30.0) 19.6 0.027 881.5 663.8
16 0 (5.7) +1 (1.1) 0 (30.0) 13.3 0.040 1277.1 544.8
17 0 (5.7) 0 (0.6) -1 (20.0) 35.6 0.047 1373.8 743.8
18 0 (5.7) 0 (0.6) +1 (40.0) 6.2 0.019 681.6 449.6
19 0 (5.7) 0 (0.6) 0 (30.0) 12.8 0.028 974.0 527.3
20 0 (5.7) 0 (0.6) 0 (30.0) 11.0 0.027 943.9 527.3
a
x1 = pH value; x2 = inoculum concentration (X0, g/L); and x3 = initial glucose concentration (S0, g/L); bPrG6PD = enzyme productivity
G6PD Activity Assays
The cells were resuspended in 50 mM Tris-HCl
buffer (pH 7.5) containing 5 mM MgCl2, 0.2 mM
EDTA, 10 mM β-mercaptoethanol, 2 mM
aminocaproic acid and 1 mM PMSF (phenyl methyl sulfonyl fluoride). The cell suspension was disrupted by submitting to a vortex (PHOENIX AP56, Araraquara, Brazil) in the presence of glass beads (diameter = 0.5 mm) at low temperature (<10°C). The wet cell cake, Tris-HCl buffer and glass beads were mixed in a volumetric proportion of about 1:8:1. Cell debris and glass beads were removed by centrifugation (8720 g; 10 min; 4oC) and the G6PD activity of the supernatant was measured by
spectrophotometric quantitation of reduced NADP+
at 30oC, as described by Bergmeyer (1984). One
G6PD unit (U) was defined as the amount of enzyme
catalyzing the reduction of 1 μmol of NADP/min
under the assay conditions.
Calculation of Cultivation Parameters
The substrate-to-cell conversion factor was calculated as YX/S = ΔX/ΔS; the enzyme productivity
as PrG6PD = ΔP/Δt; and the cell productivity as Prcell =
ΔX/Δt, in which ΔX = Xf - Xo (Xf = final cell
concentration and Xo = initial cell concentration), ΔS
= So - Sf (So = initial glucose concentration and Sf =
final glucose concentration), ΔP = Pf - Po (Pf = final
enzymatic activity and Po = initial enzymatic
activity), and Δt = tf - to (tf = final cultivation time
and to = initial cultivation time). The specific cell
growth rate (μX), specific substrate consumption rate
(μS) and specific G6PD production rate (μP) were
defined in Equations 1, 2 and 3:
x
1 dX X dt
μ = (1)
S
1 dS X dt
μ = (2)
p
1 dP X dt
μ = (3)
The derivatives dX/dt, dS/dt, and dP/dt were
calculated according to the method proposed by Le Duy and Zajic (1973). The coefficient of cell
maintenance (ms) is represented by the linear
coefficient of the equation obtained of the plot between μs as a function of μx (Pirt, 1965) (Equation
4). The parameter substrate-to-cell true conversion factor, YG, is calculated, from Equation 4, as the
inverse of the angular coefficient (1 a).
s a. x ms
μ = μ + (4)
RESULTS AND DISCUSSION
The yeast used in this work was recently developed by genetic modification (Lojudice et al., 2001), and the effects of different experimental conditions on cell and G6PD productivities during aerobic cultivations, at 30oC, were simultaneously investigated by employing a full factorial experimental design. The three evaluated variables were: pH value, inoculum concentration and initial glucose concentration. The pH values were chosen based on previous results reported by Abrahão-Neto et al. (1997), while the inoculum concentration (initial yeast concentration) and initial glucose concentration were chosen based on previous results referred by Silva et al. (2002). To maintain constant the C/N ratio (C/N = 7), the nitrogen concentration (from YNB and aminoacids) in the cultivation medium was changed as a function of carbon source concentration (initial glucose concentration). The design of this experiment, given in Table 1, was planned to obtain a quadratic model consisting of 23 trials plus an orthogonal configuration, with replicates at the center point and with the experimental productivity results.
According to Table 1, the highest cell and G6PD productivity values were reached when the genetically modified S. cerevisiae was cultivated at the lowest level of substrate concentration (20.0 g/L), and a probable repression of the enzyme synthesis at high glucose concentrations was observed. Anyway, the experimental data were statistically evaluated to verify the effect of the variables on the desired responses (enzyme and cell productivity) (Tables 2 and 3). Regression analysis was performed to fit the response functions, G6PD productivity (PrG6PD) and cell productivity (Prcell) as a
Table 2: Estimated effects, standard errors and Student’s t-test for G6PD productivity (PrG6PD)
using the 23-full factorial orthogonal composite design.
Variables Estimated Effects Standard errors t-values Pa
mean 14.15 0.90 15.71 0.000
x1 -2.13 0.88 -2.40 0.035
x2 -2.84 0.88 -3.19 0.009
x3 -12.37 0.88 -13.90 0.000
x32 4.19 1.37 3.04 0.011
x2.x3 6.21 0.99 6.24 0.000
x1.x2.x3 -2.89 0.99 -2.91 0.014
a
significant level of the variables, and their interactions
Table 3: Estimated effects, standard errors and Student’s t-test for cell productivity (Prcell)
using the 23-full factorial orthogonal composite design.
Variables Estimated Effects Standard errors t-values Pa
mean 0.023 0.001 17.28 0.000
x1 -0.003 0.001 -2.50 0.037
x2 0.004 0.001 3.27 0.011
x3 -0.009 0.001 -7.67 0.000
x12 -0.006 0.002 -2.51 0.036
x22 0.006 0.002 2.62 0.030
x32 0.005 0.002 2.40 0.043
a
significant level of the variables, and their interactions
As the main objective of this work was to obtain the highest productivity in enzyme (PrG6PD), a model
expressed by Equation 5 was calculated, and shows the G6PD productivity (yPrG6PD) as a function of the
following coded values: pH value (x1), inoculum
concentration (x2) and initial substrate or initial
glucose concentration (x3).
Pr G6PD 1 2 3
2
3 2 3 1 2 3
y 14.15 2.13x 2.84x 12.37x
4.19x 6.21x x 2.89x x x
= − − − +
+ − (5)
To simplify the model yPrG6PD (Eq. 5) and draw
the response surface, the variable x2 was replaced by
its minimum codified value (-1), condition at which the highest enzyme productivity value was obtained. Thus, a new statistical model is shown in Equation 6.
Pr G6PD 1 3
2
3 1 3
y 17.00 2.13x 18.58x
4.19x 2.89x x
= − − +
+ (6)
Another model expressed by Equation 7 was calculated, and shows the cell productivity (ycell) as a
function of the pH value (x1), inoculum
concentration (x2) and substrate (glucose)
concentration (x3), coded values.
cell 1 2 3
2 2 2
1 2 3
y 0.023 0.003x 0.004x 0.009x
0.006x 0.006x 0.005x
= − + − −
+ + (7)
To simplify the cell productivity model (Eq. 7) and draw the response surface, the variable x2 was
again replaced by its minimum codified value (-1), condition at which the highest enzyme productivity value was obtained, and a new statistical model is shown in Equation 8.
cell 1 3
2 2
1 3
y 0.025 0.003x 0.009x
0.006x 0.005x
= − − −
+ (8)
The statistical significance of the second-order model for PrG6PD was evaluated by the analysis of
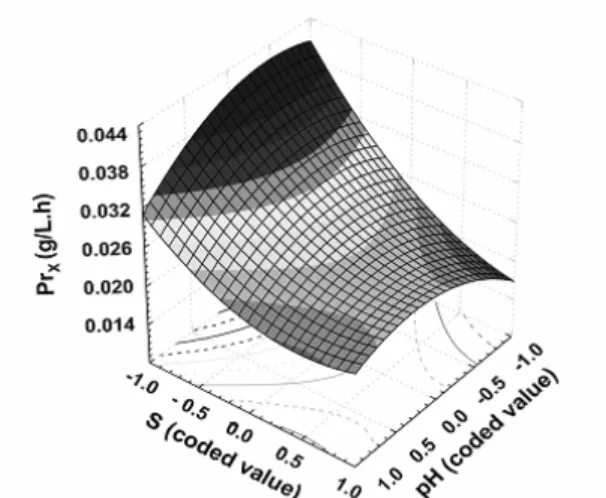
variance (ANOVA), which revealed that the regression obtained for this model is statistically significant (99% of confidence level). The response surface described by the model G6PD productivity (yPrG6PD) is represented in Figure 1. For the response
cell productivity (Prcell), the statistical significance of
the model revealed that the regression obtained is also statistically significant. The response surface described by the cell productivity model (ycell) is
According to the response surfaces, which represent G6PD and cell productivities (Figures 1 and 2), and comparing to the codified values (Table 1), the highest enzyme productivity (PrG6PD =
45.6 U/L.h) was obtained when the variables were pH = 4.8, X0 = 0.1 g/Land S0 = 20 g/L. On the other
hand, the highest cell productivity (Prcell =
0.047 g/L.h) was obtained under pH = 5.7, X0 =
0.6 g/Land S0 = 20 g/L.
Saccharomyces cerevisiae cultivations are mainly performed in the pH range from 4.0 to 5.0, since bacterial contamination is highly unfavorable (Lima et al., 2001). Furthermore, Lima et al. (2001)
emphasize that pH can be diminished down to 2.0
without damaging cell profile. However, the authors affirm that cultivations carried out at about pH 5.8 also provide excellent results. Concerning glucose effects, in general glucose represses enzyme synthesis (Entian et al., 1985). This fact could be observed in our experiments, since the cultivations conducted at the highest initial glucose concentrations (40 g/L) provided the lowest enzyme productivities.
To confirm the predicted response (yPrG6PD) by the
simplified model, as well as to do a kinetic study, a new cultivation was carried out by employing the optimal conditions (pH = 4.8, X0 = 0.1 g/L, and S0 =
20 g/L, under 150 rpm/30oC). The results, shown in Figure 3, indicate that glucose consumption, and enzyme production and cell production are coupled
events. The obtained enzyme productivity was similar to that predicted by the model and consequently by the response surface. This figure also shows that after about 30 hours of cultivation, the substrate was totally consumed, the cell growth was at the stationary phase and the enzyme activity was at the highest level. The maximal specific cell growth rate (μX,max) value of 0.15 h-1 was similar
(0.16 h-1) to that obtained by Silva et al. (2002) and by Miguel et al. (2003). Considering that, for recombinant systems with a high copy number of plasmid per cell, the host growth rate decreases because of the presence and expression of the plasmids, the maximal specific cell growth rate obtained here is quite good. In the present case, we can assume that the cultivation conditions guaranteed an adequate amount of nutrient in the medium to fine-tune the metabolic pathways related to growth, production and substrate consumption, with 0.059 g/g for the YX/S value.
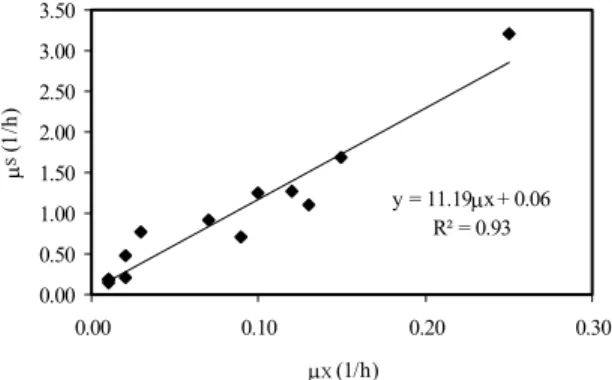
The results presented in Figure 3 were used to calculate the kinetic parameters of the process. Figure 4 presents the linear correlation, expressed by Equation 9, between specific substrate consumption rate (μS) and
specific cell growth rate (μX) (Moser, 1985). During
cell growth and enzyme production, part of the substrate was consumed for maintenance of the cell
metabolism (mS = 0.053 h-1), and for byproduct
production (for instance, ethanol). Thus, the substrate-to-cell true conversion factor (YG) was 0.089 g/g.
Figure 1: Response surface described by the model which represents G6PD productivity by
S. cerevisiae W303-181 as a function of initial glucose concentration (S, coded values) and pH (coded values), Xo = 0.1 g/L.
Figure 2: Response surface described by the model which represents cell productivity by
0 200 400 600 800 1000 1200 1400 1600
0 5 10 15 20 25
0 4 8 12 16 20 24 28 32
G
6
P
D
(
U
/L
)
X
(1
0
-1
g/
L
),
S
(g/
L
)
cultiva tion time (h)
y = 11.19μx + 0.06 R² = 0.93
0.00 0.50 1.00 1.50 2.00 2.50 3.00 3.50
0.00 0.10 0.20 0.30
μX (1/h)
μ
S
(1
/h
)
Figure 3: Cell concentration (X, ◊), glucose concentration (S, □) and enzymatic activity (G6PD,
Δ) as a function of cultivation time (h) of
Saccharomyces cerevisiae W303-181, performed
under the following conditions: pH = 4.8, Xo =
0.1 g/L, and So = 20.0 g/L (under agitation of
150 rpm at 30°C).
Figure 4: Specific substrate consumption rate (μS) as a function of specific G6PD production
rate (μP) determined after cultivation of
Saccharomyces cerevisiae W303-181 performed under the following conditions: pH = 4.8, Xo =
0.1 g/L, and So = 20.0 g/L (under agitation of
150 rpm at 30°C).
y = 605.0 μx + 12.27 R² = 0.88
0 20 40 60 80 100 120
0.00 0.05 0.10 0.15 0.20
μX (1/h)
μ
P (1
/h
)
Figure 5: Variation in G6PD specific production rate (μP) as a function of growth rate (μX) calculated
after cultivation of Saccharomyces cerevisiae W303-181 performed under the following conditions: pH = 4.8, Xo = 0.1 g/L, and So = 20.0 g/L (under agitation of 150 rpm at 30°C).
The specific G6PD production rate (μP) and
specific cell growth rate (μX) can be reasonably
correlated by the approach proposed by Luedeking and Piret (2004), shown in Figure 5, expressed by Equation 10. Assuming that the linear coefficient is negligible, G6PD formation and growth rate are associated events. As this enzyme is constitutive and growth-related, a viable process for its production would be in a steady-state continuous culture (Vitolo et al., 1985).
s 11.19 X 0.06
μ = μ + (R2 = 0.93) (9)
P 605 X 12.3
μ = μ + (R2 = 0.88) (10)
The enzyme produced by the genetically modified S. cerevisiae cultivated in the experimental
optimal conditions (pH = 4.8, X0 = 0.1 g/L, and S0 =
20 g/L, under 150 rpm/30oC) was compared to the
wild S. cerevisiae employing a suspension in the
same concentration obtained in the optimal condition of cultivation with the modified yeast. The enzymatic activity (G6PD production) of the genetically modified strain (1594 U/L) was up to 21 times higher than the enzyme activity from the wild type (75.9 U/L).
CONCLUSIONS
It can be concluded that the high level of G6PD formation and productivity (yPrG6PD) by S. cerevisiae
concentration of 0.1 g/L and initial glucose concentration of 20 g/L, under 150 rpm/temperature of 30oC), G6PD activity obtained for a modified S. cerevisiae was about 21 times higher than of a wild strain. Undoubtedly, this modified strain is an important potential source of G6PD. The proposed
modified Saccharomyces cerevisiae, containing
promoters that are up regulated, has been demonstrated to be an interesting potential source of G6PD.
NOMENCLATURE
G6PD enzyme
glucose-6-phosphate dehydrogenase
(-)
mS coefficient of cell
maintenance
1/h
Prcell cell productivity g/L.h
PrG6PD G6PD productivity U/L.h
U/L enzyme production by
medium volume
(-)
U/gcell enzyme production by cell
concentration
(-)
R2 determination coefficient (-)
S0 initial glucose concentration g/L
x1 pH coded value (model) (-)
x2 inoculum concentration
coded value (model)
(-)
x3 initial glucose concentration
coded value (model)
(-)
X0 initial cell concentration (or
inoculum concentration)
g/L
yPrG6PD G6PD productivity (model) (-)
ycell cell productivity (model) (-)
YG substrate-to-cell true
conversion factor
g/g
YX/S substrate-to-cell conversion
factor
g/g
Greek Letters
μX specific cell growth rate 1/h
μS specific substrate
consumption rate
1/h
μP specific G6PD production rate 1/h
μX,max maximal specific cell
growth rate
1/h
ACKNOWLEDGEMENTS
Fernanda Guerreiro Rossi acknowledges receipt
Pesquisa do Estado de São Paulo / Brazil). The authors also acknowledge the financial support from CNPq (Conselho Nacional de Desenvolvimento Científico e Tecnológico/Brasil), CAPES (Coordenadoria de Aperfeiçoamento de Pessoal de Ensino Superior / Brazil); and Prof. Carla Columbano Oliveira for supplying the genetically modified yeast.
REFERENCES
Abrahão-Neto, J., Infanti, P. and Vitolo, M., Influence of pH temperature and dissolved oxygen concentration on the production of glucose-6-phosphate dehydrogenase and invertase by Saccharomyces cerevisiae, Braz. J. Chem. Eng. 14, 89-94 (1997).
Balaguer, P., Térouanne, B., Eliaou, J. F., Humbert, M., Boussioux, A. M. and Nicolas, J. C., Use of glucose-6-phosphate dehydrogenase as a new label for nucleic acid hybridization reactions, Anal. Biochem. 180, 50-54 (1989).
Bassi, A. S., Tang, D. Q. and Bergougnou, M. A., Mediated amperometric biosensor for glucose-6-phosphate monitoring based on entrapped glucose-6-phosphate dehydrogenase, Mg+2 ions, tetracyanoquinodimethane, and nicotinamide adenine dinucleotide phosphate in carbon paste, Anal. Biochem. 268, 223-228 (1999).
Bergmeyer, H. U., Methods of Enzymatic Analysis, In: Bergmeyer, H. U., Bergmeyer, J. and Grasl, M. (eds) Methods of Enzymatic Analysis vol.2, 3rd, Verlag Chemie, Weinheim (1984).
Box, G. E. P., Hunter, W. G. and Hunter, J. S., Statistics for Experimenters: an Introduction to Design, Data Analysis and Model Building, John Wiley & Sons, New York (1978).
Chatel, S., Voirin, A., Luciani, A. and Artaud, J., Starch identification and determination in sweetened fruit preparations, J. Agric. Food. Chem..44, 502-506 (1996).
Entian, K. D., Hilberg, F., Opitz, H. and Mecke, D., Cloning of hexokinase structural genes from
Saccharomyces cerevisiae mutants with regulatory mutations responsible for glucose repression, Mol. Cell. Biol. 5, 3035-3040 (1985). Frey, S. D., Elliott, E. T. and Paustian, K.,
Application of the hexokinase-glucose-6-phosphate dehydrogenase enzymatic assay for measurement of glucose in amended soil, Soil
Biol. Biochem.31, 933-935 (1999).
Hasmann, F. A., Cortez, D. V., Pessoa-Jr, A. and
Roberto, I. C., Optimization of β-xylosidase
recovery by reversed micelles using response surface methodology, Electron. J. Biotechn. 6, 20-27 (2003).
Ivison, F. M., Kane, J. W., Pearson, J. E., Kenny, J. and Vadgama, P., Development of a redox mediated amperometric detection system for immunoassay: Application to urinary amphetamine screening, Electroanal. 12, 778-785 (2000).
Le Duy, A. and Zajic, J. E., A geometrical approach for differentiation of an experimental function at a point applied to growth and product formation, Biotechnol. Bioeng. 15, 805-810 (1973).
Lima, U. A., Aquarone, E. A., Borzani, W. and Schmidell, W., Biotecnologia Industrial: Processos Fermentativos e Enzimáticos, v.3, Edgard Blücher Ltda, São Paulo (2001).
Lojudice, F. H., Silva, D. P., Zanchin, N. I. T., Oliveira, C. C. and Pessoa-Jr, A., Overexpression of glucose-6-phosphate dehydrogenase (G6PD) in genetically modified Saccharomyces cerevisiae. Appl. Biochem. Biotechnol. 91-93, 161-169 (2001).
Luedeking, R. and Piret, E. L., A kinetic study of the lactic acid fermentation - Batch process at controlled pH, J. Biochem. Microbiol. Tech. Eng. 1, 393-412 (2004).
Miguel, A. S. M., Neves, L. C. M., Vitolo, M. and Pessoa-Jr, A., Effect of flow rate pattern on
glucose-6-phosphate dehydrogenase synthesis in
fed-batch culture of recombinant Saccharomyces
cerevisiae, Biotechnol. Prog. 19, 320-324 (2003). Mori, H., Ishida, M. and Okamoto, S., Glucose
determination using a flow system with enzyme reactor and application to analysis of glucose content in beverages, J. Health Sci. 45, 126-129 (1999).
Moser, A., Kinetics of Batch Fermentations In: Rehm, H. J. and Reed, G. (eds) Biotechnology: Fundamentals of Biochemical Engineering v.2, VCH Publishers, Weinheim (1985).
Pirt, S.J., The maintenance energy of bacteria in growing cultures, Proc. R. Soc. Lond. B. Biol. Sci.163, 224-231 (1965).
Silva, D. P., Pessoa-Jr, A., Roberto, I.C. and Vitolo, M., Effect of KLa on the production of
glucose-6-phosphate dehydrogenase from Saccharomyces
cerevisiae grown by fermentation process, Appl.
Biochem. Biotechnol.98-100, 205-213 (2002).
Terouanne, B., Bencheick, M., Balaguer, P., Boussioux, A. M. and Nicolas, I.C., Bioluminescent assays using glucose-6-phosphate dehydrogenase - Application to biotin and streptavidin detection, Anal. Biochem. 180, 43-49 (1989).
Vitolo, M., Vairo, M. L. R. and Borzani, W., Invertase activity of intact-cells of