ISSN 0104-6632 Printed in Brazil
www.abeq.org.br/bjche
Vol. 33, No. 03, pp. 599 - 606, July - September, 2016 dx.doi.org/10.1590/0104-6632.20160333s20150111
Brazilian Journal
of Chemical
Engineering
THE USE OF A HIGH LIMESTONE CONTENT
MINING WASTE AS A SORBENT FOR CO
2
CAPTURE
R. C. Barbosa, J. J. R. Damasceno and C. E. Hori
*Faculdade de Engenharia Química, Universidade Federal de Uberlandia. Av. João Naves de Ávila 2121, Bloco 1K, Campus Santa Mônica,
CEP: 38408-144, Uberlandia - MG, Brazil. Fax: (55) (34) 3239-4249
E-mail: [email protected]
(Submitted: February 25, 2015 ; Revised: August 27, 2015 ; Accepted: September 1, 2015)
Abstract - In this work, a high limestone content waste was evaluated as a potential material for CO2 capture.
The influence of calcination conditions on the CO2 capture capacity was evaluated using 5 cycles of
calcination-hydration-carbonation reactions. A Central Composite Design of Experiments was set using calcination temperatures and time as variables. The response evaluated was the CO2 capture measured by
thermogravimetric analysis. The results indicate that both calcination temperature and time influence the CO2
capture capacities in the initial cycles but, after a large number of cycles, the effect becomes less relevant. The optimum calcination temperature did not change significantly between cycles - about 893 °C in the first and 850 °C in the fourth cycle. However, the optimum calcination time decreased from 40.1 min in the first to 22.5 min in the fourth cycle. The maximum CO2 capture capacity declines over the reaction cycles due to the sorbent
sintering, which becomes more noticeable. Moreover, the waste used in this work is suitable for separating CO2
from flue gas, achieving more than 0.2 g/g of capture capacity after five cycles.
Keywords: CO2 capture; Limestone; Calcium oxide; Calcium carbonate.
INTRODUCTION
The continuous increase of atmospheric carbon dioxide levels since the Industrial Revolution, mostly due to fossil fuel combustion (Yu et al., 2012),has en-couraged extensive research to develop technologies to reduce this gas emission (Phalak et al., 2012). CO2
capture technologies are being implemented and could become a necessary option to achieve the necessary reduction(Zeman, 2007). This process consists of three steps: separation of CO2 from flue gas – the most
expensive step-, transport and sequestration. Among the promising technologies to separate CO2
by post-combustion capture processes, carbonation-cal-cination loops use an extremely cheap and abundant
regenerable sorbent (Abanades et al., 2004; López-Periago et al., 2013): calcium carbonate. This process is based on the cycles of the gas–solid reaction (carbonation) of calcium oxide with carbon dioxide, forming calcium carbonate (CaCO3) (Barker, 1973;
Santos et al., 2012) and the reverse reaction (calcina-tion) to regenerate the CaO, releasing a concentrated stream of CO2(Phalak et al., 2012) which can be stored
or used for other purposes such as dry ice, refrigera-tion equipment, carbonated beverages and fire extin-guishing equipment (Kikkinides and Yang, 1993).
Despite low costs, CaO-based sorbents show a fast deactivation and a decrease in their CO2 capture
600 R. C. Barbosa, J. J. R. Damasceno and C. E. Hori
calcination step (Abanades and Alvarez, 2003; Sy-monds et al., 2009; Grasa and Abanades, 2006; Gon-zález et al., 2008; Manovic et al., 2009; Kuramoto, 2003). Previous studies show that high calcination temperatures accelerate this deactivation process (Grasa and Abanades, 2006; González et al., 2008). In order to overcome the sintering and enhance the sorbent reactivity, a range of methods has been pro-posed, such as doping of CaO-based sorbents (Al-Jeboori et al., 2012) to produce synthetic sorbents, thermal preactivation of fresh sorbent (Valverde et al., 2013) and hydrating (Yu et al., 2012; Phalak et al., 2012; Blameyet al., 2010). A number of authors have shown that including an intermediate hydration of CaO improves the sorbent morphology, forming po-rous agglomerates(Kuramoto, 2003) and enhancing pore size, likely a shift from smaller to larger pores, which avoids the pore pluggage(Yu et al., 2012; Phalak et al., 2012).
Previous studies investigating carbonation of Ca(OH)2 and carbonation of CaO show that Ca(OH)2
reaches a higher conversion than CaO (Nikulshina et al., 2007; Kuramoto et al., 2003), whereas the car-bonation of CaO is initially chemically controlled and then becomes controlled by diffusion, while the carbonation of Ca(OH)2 at high temperatures (up to
400 °C) is all chemically controlled(Nikulshina et al., 2007).
Usually the studies that use calcium carbonate as a potential sorbent for CO2 capture processes are
con-ducted with freshly mined materials. Although this type of material is cheap and abundant, the envi-ronmental impact of a mining process is always high. Therefore, it would be more environmentally friendly to use a residue as a CO2 sorbent. Consequently, this
work concerns the evaluation of a high limestone con-tent waste from Vale Fertilizantes produced in an apa-tite concentration process for separating CO2 through
calcination-hydration-carbonation reactions under dif-ferent calcination conditions to determine the opti-mum calcination temperature and time to provide the best performance.
EXPERIMENTAL
Reaction Cycles
A set of 5 cycles (calcination−hydration− carbona-tion) was performed for each calcination condition, keeping the hydration and carbonation conditions constant. These conditions were fixed because there are studies in the literature which pointed out that the calcination step is usually the most critical one in
terms of sintering the sorbent materials (Ramkumar et al., 2010).
The reactions developed in this work are provided below:
3 2
CaCO s CaOCO (1)
2
2CaO s H OCa OH (2)
2 2 3 2Ca OH s CO CaCO H O (3)
The samples were calcined in a muffle furnace under 30 mL/min of synthetic air flow. Calcination temperatures and time ranges of 723-977 °C and 11-49 min, respectively, were set by central composite design of the experiments, with five replicates in the central point (850 °C and 30 min) and an alpha or-thogonality factor of 1.267. Table 1 shows an experi-mental matrix set by the central composite design. Thereby, for each cycle, 13 runs were performed, for different calcination temperatures and times.
Table 1: Conditions of the Central Composite Design.
Variable -α -1 0 1 +α
Calcination Temperature (°C)
723 750 850 950 977 Calcination
Time (min)
11 15 30 45 49
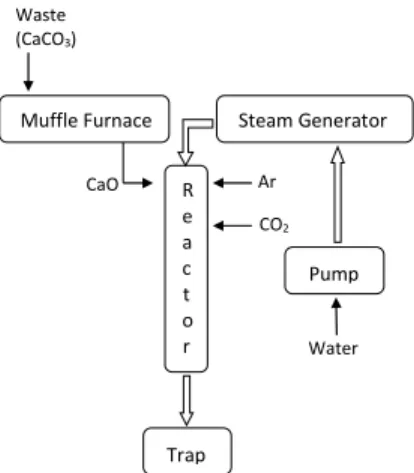
The hydration and carbonation reactions were car-ried out under fixed conditions in a laboratory-scale fixed-bed reactor with internal diameter of 0.012 m and length of 0.317 m. The solid samples, after each calcination, were supported in this reactor using quartz wool, forming a packed bed and the reactor was placed in a heated zone provided by an electrical tube furnace. Liquid water was pumped at 25 °C, heated to 150 °C and then fed to the reactor as steam. Hydration was carried out at 500 °C for 30 min (Phalak et al., 2012) under 90% steam and 10% argon. Carbonation was performed at 650 °C and 30 min (Phalak et al., 2012) under 10% CO2 (balanced with an argon stream).
Figure 1 shows schematically the experimental setup used to perform the cycle of reactions.
Characterization
Figure 1: Schematic drawing of the experimental system used for the calcination-hydration-carbonation reaction cycles.
Average crystallite sizeafter first and fifth calcina-tions was estimated with the Scherrer equation:
cos
D
(4)
where D is the mean size of the crystallite; is the Scherrer constant, which depends on the shape factor, with a typical value of about 0.9; is the X-ray wave-length; β(2θ) is the line broadening at half the maxi-mum intensity, in radians; and θ is the Bragg angle.
The BET surface area was determined from N2
adsorption isotherms, at 77 K, using a Quantachrome adsorption analyser model Quantsorb Jr.
CO2 Capture Capacity
A thermogravimetric analysis (TGA) was used to evaluate the extent of CO2 capture in the cycles. After
each carbonation step, about 5 mg of sample was test-ed in the TGA. The analyses were carritest-ed out under N2 flow and the same conditions used in the
calcina-tion step. Thus, if the sample was calcined at 750 °C for 15 min, in the TGA test the sample was heated from 25 to 750 °C under N2 and held isothermally at
750 °C for 15 min.
Reactivity of Calcium Oxide
The reactivity of the oxide formed was experimen-tally studied following the procedure described by ASTM - C - 110-76. This methodology is based on the temperature increase due to the heat released during the hydration reaction of the oxide. After each calcination, around 2.5 g of sample and 10 g of water were introduced into an adiabatic receiver and shaken by a magnetic stirrer. The increase of the temperature
was monitored using a thermometer placed inside the receiver and the temperature variation reached after 10 min was recorded.
RESULTS
A diffractogram of the waste is shown in Figure 2. As can be seen, the waste is composed mostly of cal-cium carbonate. Calcite (CaCO3, rhombohedral) is the
predominant phase. Limestone with a high concentra-tion of calcite has received the most focus for CO2
capture because it allows the highest capture of CO2
per unitmass (Blameyet al. 2010). The waste has a specific surface area of 3 m2/g, as determined by BET.
Figure 2: XRD diffraction pattern of waste as received. C – Calcite (JCPDS 01-072-1651) and D – Dolomite (JCPDS 01-071-1662).
Figure 3 shows XRD diffraction patterns of sam-ples after the first and the second carbonation cycles and Figure 4 after the first and the second calcination. Both samples were calcined at 950 °C for 45 min and carbonated at 650 °C for 30 min. It can be seen that the carbonations and calcinations are reversible in practice since, after the first and second carbonations, there is only calcium carbonate and after calcinations there is mostly calcium oxide. Kuramoto et al. (2003) also reported that the sorbent regenerates, maintaining the CO2 capture capacities of this type of mineral over
calcination-hydration-carbonation cycles. The authors compared the results with and without intermediate hydration of CaO, suggesting that the hydration treat-ment provides the durability of the sorbents in repeti-tive CO2 sorption.
Figure 4 shows the diffractograms of a sample after the first and fifth calcination cycles. The increase of intensity of the major peaks is evidence that the
Waste (CaCO3)
Pump
Trap
Water
CaO R Ar
e a c t o r
602 R. C. Barbosa, J. J. R. Damasceno and C. E. Hori
sample is sintering as it is submitted to calcination-hydration–carbonation cycles. After the first and fifth calcination the average crystallite sizes for the CaCO3
phase obtained using the Scherrer equation were (0.298 mm) and (0.340 mm) respectively. This shows that CaCO3 particles are sintering during the cycles,
which makes their diameter larger and decreases their surface area. Besides the CaCO3 phase, one can also
notice some small peaks of MgO due to calcined dolo-mite and some peaks of Ca(OH)2, probably due to the
contact of the oxide with air moisture.
Figure 3: Diffractograms of the carbonation product after the first and second cycles. C – Calcite (JCPDS 01-072-1651). Calcination carried out at 950 °C for 45 min, hydration at 500 °C for 30 min and carbona-tion at 650 °C for 30 min.
Figure 4: Diffractograms of the calcination product after the first and fifth cycles. A - CaO (JCPDS 01-082-1690) and H - Ca(OH)2 (JCPDS 04-0733). Calcination
carried out at 950 °C for 45 min, hydration at 500 °C for 30 min and carbonation at 650 °C for 30 min.
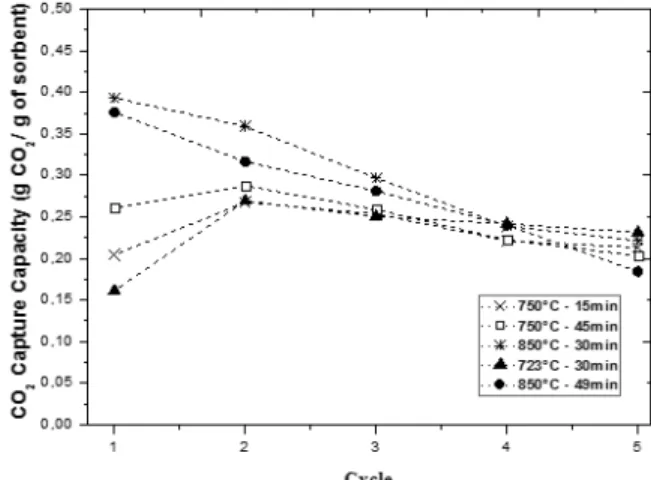
The extent of CO2 captured during the cycles, for
different calcination conditions, is shown in Figure 5.
As can be seen, samples calcined at temperatures up to 800 °C performed better in the first cycle. It can be noted that the CO2 capture capacity drops from the
second to fifth cycle for all samples. However, as the number of cycles increases, the CO2 capture capacity
seems to stabilize. Similar results were obtained by Rhida et al. (2012) working with natural limestones and pellets prepared from acetified limestone, with kaolin binder or with Al(OH)3 binder. Therefore, the
calcination temperature seems to have a pronounced effect on CO2 capture in the first cycle, since samples
calcined at higher temperatures performed much bet-ter. However the effect diminishes with increasing number of cycles, and all samples achieved similar CO2 uptake in the fifth cycle.
In Figure 5 it can be seen that samples calcined at temperatures up to 800 °C achieved almost 0.4 g/g of CO2 capture capacity in the first cycle and about 0.22 g/g
in the fifth cycle. In a study using natural limestones, Rhida et al. (2012) obtained about 0.5 g/g to 0.24 g/g, in the first and fifth cycle, respectively. This result suggests that the waste used in this work is suitable for separating CO2 from flue gas.
Figure 5: CO2 Capture Capacity vs. the number of
cycles under different calcination conditions.
Another interesting effect can be noted in Figure 5: the samples calcined at lower temperatures showed an increase in the CO2 uptake from the first to second
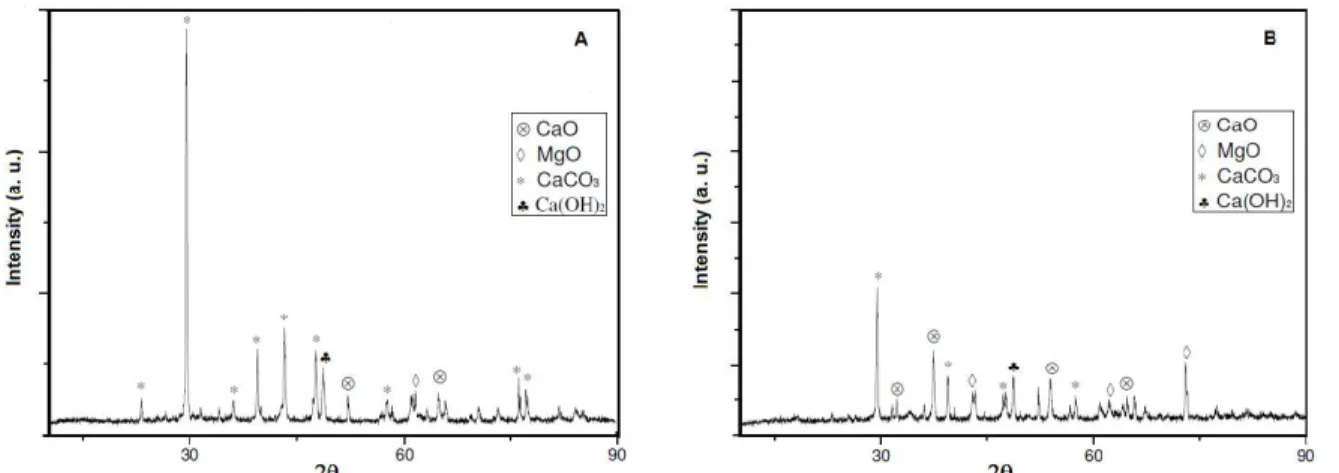
cy-cle. This probably happened because the use of lower temperatures is not sufficient to decompose com-pletely CaCO3 into CaO in the first cycle. Figure 6
shows XRD data for a sample calcined at 800 ºC for 5 minutes (Fig. 6A) and for 30 minutes (Fig. 6B). The presence of a small CaCO3 diffraction peak (2θ
the use of temperatures below 800 ºC, such as 723 ºC and 750 ºC (shown in Figure 5) are possibly insuffi-cient to convert all the CaCO3 into CaO, even if longer
calcination times are used. After the second calcina-tion–hydration–carbonation cycle, probably all CaCO3
was converted to CaO.
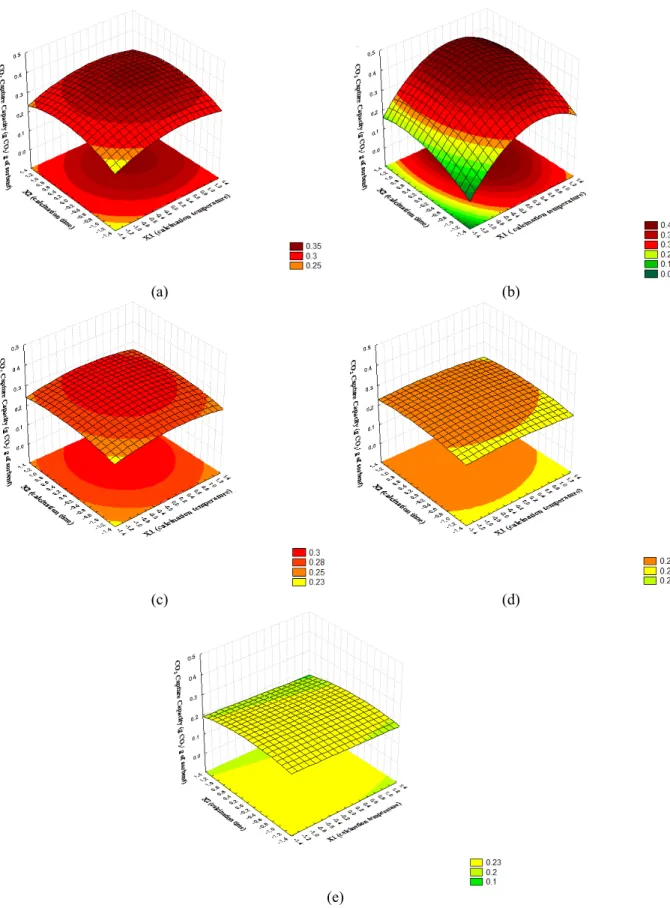
Figure 7 shows the response surface for each cycle. In the first and second cycles, the CO2 capture capacity
increased, as the calcination temperature increased, until reached the best region and then began to de-cline. This is expected because, for low calcination temperature and time, there is probably still unreacted carbonate in the first cycles and, as the calcination temperature and time increase, the sorbent become less reactive due to the sintering processes. However, from the third to fifth cycles the ability to capture CO2
for all conditions tends to the same value. For a larger number of cycles, it seems reasonable to assume that the decay in CO2 capture capacity would be more
dependent on the amount of cycles than on the calci-nation conditions, within this experimental range.
The maximum capacity declined over the cycles. For instance, in the first cycle, the maximum CO2
capture capacity was around 0.42 gram of CO2 per
gram of waste and in the fifth cycle, it was only about 0.23. Previous studies investigating CO2 capture with
the same type of materials also show the decay in the maximum capture capacity along the cycles (Grasa and Abanades, 2006; González et al., 2008). Usually this decline in the CO2 capture capacities is attributed
to the sintering phenomena (Abanades and Alvarez, 2003; Symonds et al., 2009) which becomes more noticeable with each cycle and is enhanced by increas-ing calcination temperatures (Borgwardt, 1989).
The optimum conditions for each reaction cycle are shown in Table 2. For the fifth cycle, the optimum conditions were out of the experimental region.
Table 2: Optimum conditions for CO2 capture
capacity.
Cycle X1 X2 Calcination
Temperature (°C)
Calcination time (min)
1° 0.43 0.67 893 40.1
2° 0.33 0.17 883 32.6
3° 0.25 0.50 875 37.5
4° 0 -0.50 850 22.5
The CO2 capture capacities for the first to fifth
cycles can be described by Equations (5) to (9), respectively.
1 2
2 2
1 2
0.39 0.06 * 0.04 *
–0.07 * – 0.03*
Y X X
X X
(5)
1 2
2 2
1 2
0.35 0.02 * 0.01
–0.03* – 0.03*
Y X X
X X
(6)
1 2
2 2
1 2
0.29 0.01* 0.01*
–0.02 * – 0.01*
Y X X
X X
(7)
2 2
2 1 2
0.25 0.01* – 0.01* – 0.01*
Y X X X (8)
2
1 2 2
0.22 – 0.01* – 0.01* – 0.01*
Y X X X (9)
Figure 6: Diffractograms of samples calcined at 800 ºC. A – for 5 minutes; B – for 30 minutes. (CaO -
JCPDS 01-082-1690; CaCO3 - JCPDS 01-072-1651; MgO - JCPDS 01-079-0612; Ca(OH)2 - JCPDS
604 R. C. Barbosa, J. J. R. Damasceno and C. E. Hori
(a) (b)
(c) (d)
(e)
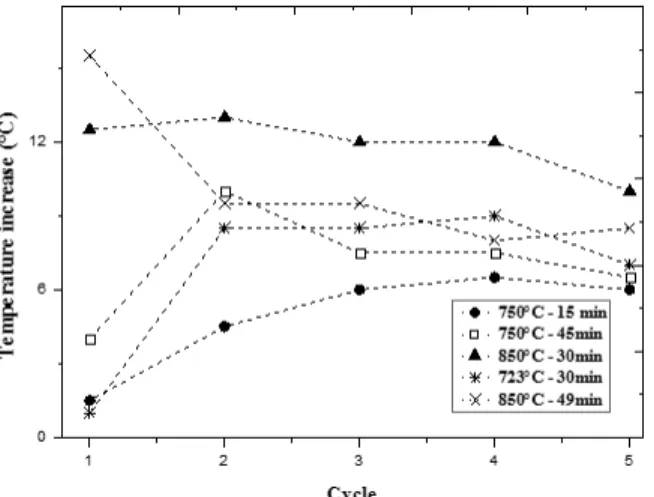
Results obtained in reactivity tests of samples calcined under five different conditions are shown in Figure 8. It can be observed that samples calcined at temperatures up to 800 °C are more reactive, but as the number of cycles increases, the reactivity of all the samples seems to converge to similar values. The results suggest that reactivity of the oxide, as reflected in the CO2 capture capacities, depends more strongly
on the number of cycles than on calcination conditions within the range tested.
Figure 8: Sorbent reactivity vs. the number of cycles for different calcination conditions.
CONCLUSIONS
In this paper, we have experimentally investigated the CO2 capture capacity of a high limestone content
waste via five calcination-hydration-carbonation re-action cycles under different calcination conditions. The parametric optimization shows that the increase of the calcination temperature and time increases the quality of quicklime and CO2 capacity capture for the
initial cycles, until the best region of operation is reached and then it decreases. Furthermore, for the first cycle, those samples treated at higher calcination temperatures showed better ability to capture CO2.
However, over several cycles, the ability to capture CO2 for all conditions tended to similar values and the
difference between the best and the worst condition tested decreased. Therefore, it appears that the calci-nation temperature and time influence CO2 uptake in
the initial cycles, but as the number of cycles in-creases, the effect becomes less significant. The loss of CO2 capture capacity can probably be attributed to
the sintering, which is faster for sorbents calcined at higher temperatures. Although there is a loss in the CO2 capture capacity of CaO over the cycles for all
samples, which is common for this kind of material, the waste seems to be suitable for CO2 capture.
ACKNOWLEDGEMENTS
The authors thank FAPEMIG, CAPES and Vale Fertilizantes for the financial support and Vale Fertili-zantes for supplying the waste studied.
REFERENCES
Abanades, J. C. and Alvarez, D., Conversion limits in the reaction of CO2 with lime. Energy & Fuels, 17,
308 (2003).
Abanades, J. C., Rubin, E. S. and Anthony, E. J., Sorbent cost and performance in CO2 capture
sys-tems. Ind. Eng. Chem. Res., 43(13), 3462 (2004). Al-Jeboori, M. J., Fennell, P. S., Nguyen, M. and
Feng, K., Effects of different dopants and doping procedures on the reactivity of CaO-based sor-bents for CO2 capture. Energy & Fuels, 26, 6584
(2012).
Ar, I. and Dogu, G., Calcination kinetics of high pu-rity limestones. Chemical Engineering Journal, 83, 131 (2001).
Barker, R., The reversibility of the reaction CaCO3(s) ⇄ CaO(s) + CO2(g). J. Chem. Technol. Bioechnol.,
23, 733 (1973).
Blamey, J., Anthony, E. J., Wang, J. and Fennell, P. S., The calcium looping cycle for large-scale CO2
cap-ture. Progress in Energy and Combustion Science, 36, 269 (2010).
Blamey, J., Paterson, N., Dugwell, D., Fennell, P., Mechanism of particle breakage during reactiva-tion of CaO-based sorbents for CO2 capture. Energy
Fuels, 24, 4605 (2010).
Borgwardt, R. H., Calcium oxide sintering in atmos-pheres containing water and carbon dioxide. Ind. Eng. Chem. Res., 28, 493 (1989).
Garcia-Labiano, F., Abad, A., Diego, L. F., Adanez, J., Calcination of calcium-based sorbents at pressure in a broad range of CO2 concentrations. Chemical
Engineering Science, 57, 2381 (2002).
González, B., Grasa, G. S., Alonso, M. and Abanades, J. C., Modeling of the deactivation of CaO in a carbonate loop at high temperatures of calcination. Ind. Eng. Chem. Res., 47, 9256 (2008).
Grasa, G. S. and Abanades, J. C., CO2 capture
capac-ity of CaO in long series of carbonation/calcination cycles. Ind. Eng. Chem. Res., 45, 8846 (2006). Kikkinides, E. S. and Yang, R. T., Concentration
606 R. C. Barbosa, J. J. R. Damasceno and C. E. Hori
swing adsorption. Ind. Eng. Chem. Res., 32, 2714 (1993).
Kuramoto, K., Fujimoto, S., Morita, A., Shibano, S., Suzuki, Y., Hatano, H., Shi-Ying, L., Harada, M., Takarada, T., Repetitive carbonation-calcination reactions of Ca-based sorbents for efficient CO2
sorption at elevated temperatures and pressures. Ind. Eng. Chem. Res., 42, 975 (2003).
López-Periago, A. M., Fraile, J., López-Aranguren P., Vega, L. F. and Domingo, C., CO2 capture
effi-ciency and carbonation/calcination kinetics of micro and nanosized particles of supercritically precipitated calcium carbonate. Chemical Engi-neering Journal, 226, 357 (2013).
Manovic, V., Charland, J. P., Blamey, J., Fennell, P. S., Lu, D. Y. and Anthony, E. J., Influence of calcina-tion condicalcina-tions on carrying capacity of CaO-based sorbent in CO2 looping cycles. Fuel, 88, 1893
(2009).
Nikulshina, V., Gálvez, M. E., Steinfeld, A., Kinetic analysis of the carbonation reactions for the cap-ture of CO2 from air via the Ca(OH)2–CaCO3–CaO
solar thermochemical cycle. Chemical Engineer-ing Journal, 129, 75 (2007).
Phalak, N., Deshpande, N. and Fan, L. S., Investiga-tion of high-temperature steam hydraInvestiga-tion of natu-rally derived calcium oxide for improved carbon dioxide capture capacity over multiple cycles. Energy & Fuels, 26, 3903 (2012).
Ramkumar, S., Fan, L. -S., and Lowrie, W. G., Ther-modynamic and Experimental Analyses of the Three-Stage Calcium Looping Process. Ind. Eng.
Chem. Res., 5, No 16, 7563 (2010).
Ridha, F. N., Manovic, V., Macchi, A. and Anthony, E. J., High-temperature CO2 capture cycles for
CaO-based pellets with Kaolin-CaO-based binders. Green-house Gas Control, 6, 164 (2012).
Santos, E. T., Alfonsín, C., Chambel, A. J. S., Fernan-des, A., Dias, A. P. S., Pinheiro, C. I. C. and Ri-beiro, M. F., Investigation of a stable synthetic sol–gel CaO sorbent for CO2 capture. Fuel, 94,
624, (2012).
Sun, P., Grace, J. R., Lim, C. J., Anthony, E. J., Determination of intrinsic rate constants of the CaO–CO2 reaction. Chemical Engineering Science,
63, 47 (2008).
Symonds, R. T., Lu, D. Y., Macchi, A., Hughes, R. W. and Anthony, E. J., CO2 capture from syngas via
cyclic carbonation/calcination for a naturally oc-curring limestone: Modelling and bench-scale testing. Chemical Engineering Science, 64, 3536 (2009).
Valverde, J. M., Sanchez-Jimenez, P. E., Perejon, A. Perez-Maqueda, L. A., Role of looping-calcination conditions on self-reactivation of thermally pre-treated CO2 sorbents based on CaO. Energy &
Fuels, 27, 3373 (2013).
Yu, F., Phalak, N., Sun, Z. and Fan, L.-S., Activation strategies for calcium-based sorbents for CO2
cap-ture: A perspective. Ind. Eng. Chem. Res., 51, 2133 (2012).
Zeman, F., Energy and material balance of CO2