ISSN 0104-6632 Printed in Brazil
www.abeq.org.br/bjche
Vol. 25, No. 02, pp. 299 - 312, April - June, 2008
*To whom correspondence should be addressed
Brazilian Journal
of Chemical
Engineering
MATHEMATICAL MODELING OF HANDMADE
RECYCLED PAPER DRYING KINETICS AND
SORPTION ISOTHERMS
M. G. A. Vieira
1and S. C. S. Rocha
2*School of Chemical Engineering, UNICAMP, Phone: +(55) (19) 3788-3929, Fax: +(55) (19) 3788-3922, P. O. Box 6066, CEP: 13083-970, Campinas - SP, Brazil.
E-mail: [email protected], E-mail: [email protected]
(Received: April 25, 2006 ; Accepted: November 5, 2007)
Abstract - The objective of this work is to analyze and compare the natural and forced convective drying of handmade recycled paper. Drying of recycled cellulose pulp was carried out under laboratory environment conditions and in a convective dryer with forced air circulation and controlled conditions of air temperature and velocity. The tests were conducted following a two-factor central composed factorial design of experiments, with six runs at the central point. The drying results were analyzed and fitted to mathematical models of Fick, Henderson and Pabis (Fick’s modified equation), Page and He (considering the nonlinear Fick effect). The model of Page represented best the experimental data and the one of Henderson and Pabis resulted in an adequate fit for the paper drying kinetics. Sorption isotherms were determined for the dried paper and the models of GAB (Guggenheim-Anderson-de Boer) and GDW (Generalised D’Arcy and Watt) resulted in excellent fits of the experimental data. The water sorption mechanism was suggested by the analysis of the calculated parameters of the GDW model.
Keywords: Drying modeling; Convective drying; Paper drying.
INTRODUCTION
In the paper industry, drying is an important stage of the pulp processing, since it is characterized by high energy consumption and has direct influence on the paper quality. Studies on paper drying refer to the influence of the initial moisture content of the pulp, type of fiber, dryer configuration, operating conditions, among other parameters, on the quality of the final product (Rueff and Faloui (1994), Nazhad and Pazner (1994), Poirier and Pikulik (1996) and Coumans and Kruf (1995)).
Several drying technologies have been proposed for paper drying on a large scale. A new technique for the drying of paper, denominated "high intensity drying", was proposed by Pikulik and Poirier (1994), in which a wet screen is pressed by cylinders heated at 120ºC. Compared to the conventional method with
a cylinder dryer, this new technique resulted in higher drying rates and produced a paper of better quality. However, none of them was capable of substituting the multi-cylinder dryer. The dilemma for the introduction of innovative technologies in the paper industry is the high capital investment and level of risk involved (Mujumdar, 1996).
Brazilian Journal of Chemical Engineering
In Brazilian small productions of recycled paper, the drying of paper sheets is conducted outdoors. The natural environment drying, although without a direct cost to the producer, depends on the environmental conditions that may result in differences in the quality of the final product. Also, the long time needed for total drying represents an indirect cost, which is not always considered.
An analysis of paper drying on a laboratory scale
is found in the works of Mota Lima et al. (2000a, b,
2004, 2005). The paper sheets were dried over a heated surface under natural and forced convection conditions. The proposal of the dryer design and operation was to simulate the cylinder movement during drying of paper pulp, in the same manner as in the paper industry. A reduction of the drying time and higher drying rates were found with increasing air temperature. Moreover, it was verified that drying rates for paper made from long fibers were smaller than the respective ones for short fibers, which are encountered in recycled paper.
The drying process involves simultaneous heat and mass transfer phenomena, making its mathematical description difficult. Mathematical modeling of any drying process is important for optimum management of operating parameters and predicting the performance of the drying system.
In addition to the drying kinetics, the knowledge of sorption isotherms is very important for design, modeling and optimization of many processes. The literature points out the importance of those data in drying, aeration and predicting of stability and quality during packaging and storage of products.
Based on the above, the objective of this work is to determine and compare the drying kinetics of recycled paper dried under natural convection and in a laboratory scale forced convective drier. The drier design is a versatile proposal, of easy construction, which allows the increase of recycled paper production by the addition of other drying modules. The drying curves are analyzed using mathematical models described in the literature and selecting the most suitable ones by statistically comparing the implemented models. Sorption isotherms were also determined and analyzed using GAB (Guggenheim-Anderson-de Boer) and the recently proposed GDW (Generalised D’Arcy and Watt) models.
MATHEMATICAL MODELING OF DRYING KINETICS AND SORPTION ISOTHERMS
Several mathematical models that intend to represent drying kinetics are found in the literature. The model developments have been based on three
fundamental approaches, namely, theoretical, semi-theoretical and empirical.
The theoretical models are based on the theory of moisture diffusion as liquid or vapor, represented by Fick’s second law. The one-dimensional form of Fick’s law of diffusion can be expressed as (Crank, 1975):
2 ef 2
q
X X X
D
t r r r
§ ·
w w w
¨ ¸
¨ ¸
w © w w ¹ (1)
where:
X: moisture content (dry basis, d. b.);
r: distance of a point to the center of the material; t: drying time;
Def: effective diffusivity;
q=0 (plane plate); q=1 (cylinder) and q=2 (sphere).
Analytic solutions of Equation (1), in the form of series, for several initial and contour conditions, considering the diffusivity constant or as a function of water concentration are found in Crank (1975). Those solutions are applied for simple and constant geometries of the solid during the drying process and consider uniform initial moisture content and constant moisture at the center of the material and at the solid surface. Equation 2 shows the analytic solution for plane plate geometry.
eq
2 2
0 eq n 0 2 2 ef
2
X X 8 1
X X 2n 1
D t
exp 2n 1
4l
f
S
§ S ·
¨ ¸
© ¹
¦
(2)
where:
X0: initial moisture content (d. b.);
X: average moisture content (d. b.);
Xeq: equilibrium moisture content (d. b.);
Def: effective diffusivity;
t: time;
l: plate thickness.
Brazilian Journal of Chemical Engineering Vol. 25, No. 02, pp. 299 - 312, April - June, 2008 Some semi-theoretical models based on diffusion
theory assume that the resistance for heat and mass transfer is restricted to a fine layer on the particles surface (Parry, 1985). One of these models establishes that the drying rate is proportional to the content of free water and is expressed as follows:
eqdX
K X X
dt (3)
where:
K: drying constant
Equation 4 is also often used to model drying kinetics. It represents the expression of Newton’s law of cooling, in the integral form.
eq 0 eq
X X
exp( Kt)
X X
(4)
Modifications of this model (Equations 5 and 6), preserving the exponential form and including two and three parameters, have resulting in good fittings.
eq 0 eq
X X
a exp( Kt)
X X
(5)
eq n
0 eq
X X
a exp( Kt )
X X
(6)
where:
a, K and n: models parameters.
Equation (5) is similar to the solution of Fick’s model for long drying times, when only the first term of the series is significant. It is usually referred to as Henderson and Pabis’ equation (Mc Cormick, 1983). The difference from the analytical solution given by Equation (2) is mainly the empirical fit of the model
parameters a and K, which become then independent
of the material geometry and lose their physical meaning.
Empirical equations for drying simulation are easy to apply and have been widely used. The main justification for the empirical approach is the satisfactory fit to the experimental data. Equation (6) is known as Page’s model and is quite used in modeling agricultural products drying.
Equation (7) represents the recent mathematical
model of He (He, 2006). This model may be applied when Equation (5) (Henderson and Pabis model) leads to large error compared to the experimental data. It is the solution of a nonlinear equation considering the nonlinear Fick effect.
eq 0 eq
X X
a exp( Kt). 1 exp bt
X X
(7)
where:
a, K and b: model parameters
One of the most applied models to analyze vapor sorption isotherms is the one of GAB (Guggenheim-Anderson-de Boer).
GAB is considered a versatile model, as it is satisfactory applied in an ample range of relative humidity (10<RH<90%) for the adjustment of sorption data of many materials (Marinos-Kouris and Maroulis, 1995), being widely applied to foodstuffs.
Recently proposed, the GDW (Generalised D’Arcy and Watt) model assumes the existence of multilayer adsorption sites on the solid surface and the possibility that one water molecule attached to a primary site can create more than one secondary
adsorption site (Furmaniak et al., 2007b).
The models referred to above are given by Equations (8) and (9).
eq
m.K.C.RH X
(1 K.RH)(1 K.RH K.C.RH)
§ ·
¨ ¸
© ¹ (8)
eq
1 k 1 w RH
m.K.RH X
(1 K.RH) 1 kRH
§ ·
¨ ¸
¨ ¸
© ¹ (9)
where:
C: kinetic constant related to the sorption in the first layer;
k: kinetic constant related to sorption on secondary sorption sites (GDW model);
K: kinetic constant related to multilayer sorption (GAB model); kinetic constant related to the sorption on primary sorption sites (GDW model); m: monolayer capacity (GAB model); concentration
of primary active surface sites (GDW model); RH: relativity humidity;
w: parameter determining what part of water molecules adsorbed on primary sites convert into secondary adsorption sites;
Brazilian Journal of Chemical Engineering
MATERIAL AND METHODS
Material
The material used in the experiments consisted of
cellulose pulp made from white extra (75g/m2) used
paper. Cassava starch, carboxymethyl cellulose (CMC - adhesive agent) and titanium dioxide (white pigment) were added to the pulp in order to provide the necessary characteristics for the production of a card type paper.
Drying Kinetics
a) Natural Convective Drying
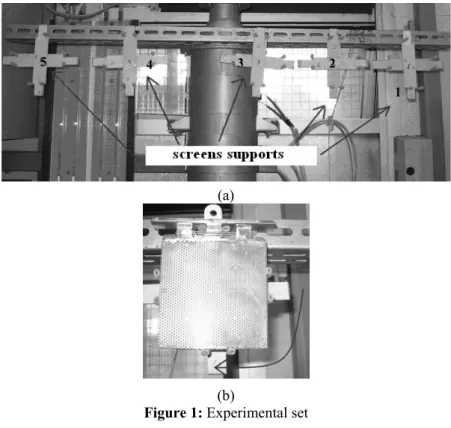
For the kinetics determination of natural convective drying of the recycled paper, a similar procedure used in Brazilian small productions was adopted. The paper pulps were pressed and hung on a horizontal support, submitted to the environmental conditions of the laboratory. Figure 1 shows the experimental apparatus used for the natural drying tests.
The support consists of a horizontal stem, with claws, that sustain five screens with the pulp. This system allows the movement of the screens, which were rotated 90º every hour during the drying test to
enhance uniformity of the sheet moisture content. Also, this procedure has the purpose of avoiding that the pulp flow down, resulting in the variation of the paper sheet density. Moreover, the sheets shrink and suffer deformations when dried naturally, without the screens. The shrinkage is due to irregular contractions of the fibers during drying, as a consequence of heat and mass transfers in
preferential areas (Vieira et al., 2006).
The screens were weighed after each 20 minutes for the first two hours and every hour during the following twelve hours. After that, some other measurements of the screen weight were done to determine the total time needed for complete drying of the sheets under each environmental condition.
The sheets’ moisture contents were obtained by the oven gravimetric method at 105ºC, for 24 hours. Temperature and relative humidity of the environmental air were measured by a digital thermo-hygrometer. The solids concentration of each pulp used in the tests was also determined.
The experiments were conducted on different days, thus at different conditions of air temperature and relative humidity, making it possible to verify the influence of these parameters on the paper drying time, as well as on the final quality of the dry paper. The natural convective drying kinetics was analyzed and fitted using Page’s model.
2
1 3
4 5
(a)
(b)
Brazilian Journal of Chemical Engineering Vol. 25, No. 02, pp. 299 - 312, April - June, 2008
b) Forced Convective Drying
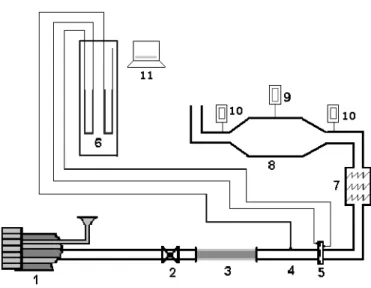
Figure 2 illustrates the experimental system used in this work. The paper surface temperature was obtained by contact thermocouples. Two thermo-hygrometers were inserted at the entrance and exit of the dryer, for the air temperature and relative humidity measurements.
For forced convective drying, the pulp is inserted in a sample holder screened on both sides with 10 cm x 10 cm of sides and a 1 mm thickness. The sample holder is constituted externally of a rigid screen and internally of a finer screen. The dryer is provided with appropriate connections to support five screened sample holders, which give support to the cellulose pulp, therefore producing 5 cards in each drying run. The screen holders can be designed and constructed to produce different sizes of cards and other drying modules can be inserted in series to increase the number of cards produced per batch. More details about the dryer construction and
operation can be found in Vieira et al. (2005, 2006).
The moisture content of the sample holders was measured every five minutes during the drying experiments to obtain the drying kinetics. For the initial drying rate determination, a tangent line to the first
point of the drying curve (at X/X0 =1) was drawn. To
obtain the constant drying rate, the linear part of the drying curve was fitted to a linear function.
The experiments were conducted according to a composed factorial design, with the air temperature and velocity as the independent variables analyzed. Six replicates at the central point (xi = 0) were done, corresponding to intermediate values between inferior and superior levels of the independent variables. In addition, experiments were conducted at the points of coordinates xi = ± 1, for both variables (corresponding to the factorial part) and at the points of coordinates xi = ± 1.4 (corresponding to the axial part), totalizing fourteen experiments. The results were analyzed using
the software STATISTICA, version 5.5.
The levels of the two factors, air temperature and velocity, defined in preliminary tests and applied for the experimental design are presented in Table 1.
1. Blower 2. Control valve 3. Silica bed 4. Pipeline 5. Orifice plate 6. U-tube Manometers 7. Resistances 8. Drying chamber 9. Thermocouples 10. Thermohygrometer 11. Balance
Figure 2: Experimental set-up for the forced convective drying tests.
Table 1: Factorial design for the forced convective drying analysis.
Code -1.4 -1 0 +1 +1.4
Tair (ºC) 66 70 80 90 94
Brazilian Journal of Chemical Engineering
Based on the drying curves obtained, the forced convective drying results were analyzed and fitted to the mathematical models of Fick, Henderson and Pabis (Fick’s modified), Page and He, represented, respectively, by Equations 2, 5, 6 and 7.
In this work, the dimensionless moisture content
ratio, ( eq
0 eq
X X
X X
), was reduced to the ratio ( 0
X
X ),
because the equilibrium moisture content obtained for the material is very close to zero, as verified in
previous works (Mota Lima et al., 2004) and in
laboratory tests, where desorption isotherms for the dried recycled paper at different operating conditions were determined.
c) Vapor Sorption Determination and Modeling
Sorption isotherms of the paper dried under forced convection, at 70ºC and 0.30m/s, were obtained by the dynamic method, using the DVS-Dynamic Vapour Sorption 2 equipment. Two isotherms were determined, at ambient temperature of 25ºC and at 50ºC, the highest temperature available for the equipment utilized.
The isotherms were adjusted using the GAB model (Equation 8) and the recently proposed GDW
model (Furmaniak et al., 2007a) (Equation 9).
RESULTS AND DISCUSSIONS
Drying kinetics results
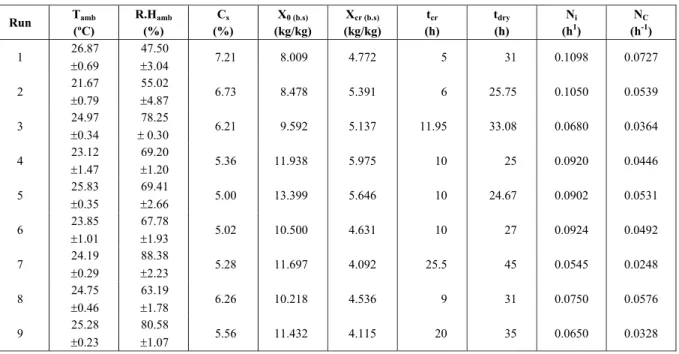
Drying of the pulp by natural convection under different conditions of environmental relative humidity and temperature was carried out, as described in the previous item. Table 2 shows these operating conditions, the pulps solid concentrations and the results of the drying processes.
The environmental conditions, mainly the relative humidity, had a great influence on the results of the natural drying of the pulps. Different environment conditions are then responsible for long and different drying times, resulting in the production of papers with different characteristics, as happens in Brazilian small cooperatives of recycled paper. The very long time needed for complete drying of the sheets by the traditional outdoors method, even when conducted under good environmental conditions (high temperature and low relative humidity of the ambient air) justifies the use of the forced convective dryer. Figure 3 shows the comparison of the drying curves obtained under three different conditions of forced convection and under good environmental conditions (run1, Table 2).
Table 2: Operating conditions and results for natural convective drying.
Run Tamb (ºC)
R.Hamb (%)
Cs (%)
X0 (b.s) (kg/kg)
Xcr (b.s) (kg/kg)
tcr (h)
tdry (h)
Ni (h1)
NC (h-1)
1 26.87
r0.69
47.50
r3.04 7.21 8.009 4.772 5 31 0.1098 0.0727
2 21.67
r0.79
55.02
r4.87 6.73 8.478 5.391 6 25.75 0.1050 0.0539
3 24.97
r0.34
78.25
r 0.30 6.21 9.592 5.137 11.95 33.08 0.0680 0.0364 4 r23.12
1.47
69.20
r1.20 5.36 11.938 5.975 10 25 0.0920 0.0446
5 25.83
r0.35
69.41
r2.66 5.00 13.399 5.646 10 24.67 0.0902 0.0531 6 23.85
r1.01
67.78
r1.93 5.02 10.500 4.631 10 27 0.0924 0.0492
7 24.19
r0.29
88.38
r2.23 5.28 11.697 4.092 25.5 45 0.0545 0.0248
8 24.75
r0.46
63.19
r1.78 6.26 10.218 4.536 9 31 0.0750 0.0576
9 25.28
r0.23
80.58
Brazilian Journal of Chemical Engineering Vol. 25, No. 02, pp. 299 - 312, April - June, 2008 The experimental design defined in the previous
item was applied to analyze the forced convective drying kinetics. A summary of the experimental conditions, as well as the pulps solid concentrations and the drying rates is presented in Table 3.
It can be verified, as expected from theory, that the increase in air temperature and velocity influences positively the process, increasing the initial and constant drying rates, consequently reducing the total drying time.
The constant drying rate ranges obtained by Mota
Lima et al. (2000b) for the natural (0.0342 to 0.0811
min-1) and forced (0.0560 to 0.1437 min-1)
conductive/convective drying of paper were much higher than the ones obtained in this work. The experimental apparatus used by those authors
consisted of a metallic box heated by a thermostatic bath containing an upper surface over which the paper samples were placed. The system was submitted to ambient air under natural and forced convection. Therefore, the differences in the drying rates are due to the heating surface effect (conductive drying) and higher air drying velocities (2 to 6 m/s) (convective drying), which enhanced the mass transfer.
Based on the results of Table 3, it can be expected that Fick’s diffusion model do not adjust well the experimental kinetic data for the recycled paper drying, due to the long constant drying rate period obtained, where the external conditions control the drying. However, as a significant falling-rate period was also observed, the model was still tested.
0 100 200 300 400 500 600 700
0.0 0.2 0.4 0.6 0.8 1.0
X/X
0
t (min)
natural drying (-1.4;-1.4) (0;0) (+1.4;+1.4)
Figure 3: Drying curves for experiments carried out at 66ºC and 0.22m/s, 80ºC and 0.50m/s, 94ºC and 0.78m/s and under natural environment conditions.
Table 3: Operating conditions and results for forced convective drying.
Run Tair (ºC)
vair (m/s)
Cs (%)
X0 (b.s) (kg/kg)
Xcr (b.s) (kg/kg)
tcr (min)
tdry (min)
Ni (min-1)
NC (min-1)
1 70 0.30 5.58 12.745 7.868 20.00 105.00 0.0198 0.0189
2 70 0.70 6.19 10.636 4.708 20.00 60.00 0.0330 0.0260
3 90 0.30 6.31 9.937 4.880 20.00 60.00 0.0334 0.0228
4 90 0.70 6.15 10.958 4.406 15.00 45.00 0.0450 0.0370
5 66 0.50 5.43 11.720 5.741 20.25 70.00 0.0290 0.0239
6 94 0.50 6.57 7.941 2.695 20.00 45.00 0.0380 0.0314
7 80 0.22 5.57 12.106 5.273 35.00 45.50 0.0164 0.0161
8 80 0.78 6.35 10.263 4.403 15.00 45.00 0.0420 0.0360
9 80 0.50 5.48 12.302 4.702 20.00 55.00 0.0362 0.0291
10 80 0.50 5.41 11.139 4.472 20.00 55.00 0.0330 0.0289
11 80 0.50 5.42 9.610 4.293 20.00 55.00 0.0298 0.0269
12 80 0.50 5.53 10.693 4.400 20.00 55.00 0.0312 0.0289
13 80 0.50 5.46 10.072 5.477 15.00 60.00 0.0322 0.0295
Brazilian Journal of Chemical Engineering
Drying Kinetics Mathematical Modeling
The drying curves fit using the model represented by Equation 2 (simplified Fick’s diffusion model) resulted in lack of adjustment. Some hypotheses are included in this analytical model, as follows: uniform product moisture content, homogeneous product and constant dimensions of the material during drying (non-shrinkage), which were not practically verified in the process, thus explaining the lack of adjustment obtained. Analyzing the drying methodology and the material applied in this work, it can be verified that, since the sheets are dried in the vertical position, the moisture is not uniformly distributed in the paper. Still, being the paper a capillary-porous material, its
dimensions shrink during drying (Vieira et al, 2006).
The use of screens maintained the width and the length of sheets fixed, but the thickness reduces
during drying. Thus, the physical situation of non-accordance with the model assumptions led to the poor fit of the simplified Fick’s model (Equation 2) to the experimental data and the determination of the recycled paper effective diffusivities was not done in this work.
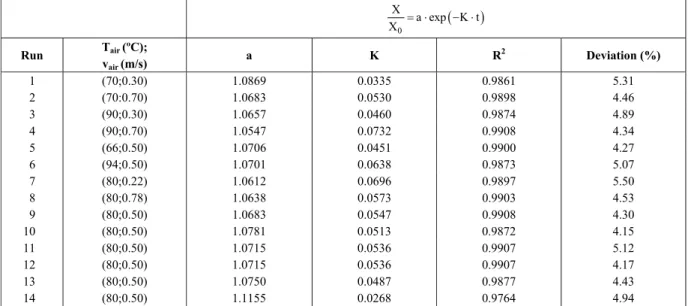
The values obtained for the constants aand K and
the regression coefficients (R2) for the fit of
Henderson and Pabis’ model (Equation 5) are shown in Table 4. The regression coefficients higher than 0.97 for all experiments confirm the good fit of the drying curves using this kinetic model.
Figure 4 presents the kinetic curve for run 8, where an excellent adjustment of Henderson and Pabis’ model to the constant drying rate period and an adequate adjustment to the drying falling-rate period can be verified. Similar results were obtained for the other runs.
Table 4: Fit of (X/X0) as a function of time by Henderson and Pabis’ equation (similar to Fick’s model).
0
X
a exp K t X
Run Tair (ºC); vair (m/s)
a K R2 Deviation (%)
1 (70;0.30) 1.0869 0.0335 0.9861 5.31
2 (70:0.70) 1.0683 0.0530 0.9898 4.46
3 (90;0.30) 1.0657 0.0460 0.9874 4.89
4 (90;0.70) 1.0547 0.0732 0.9908 4.34
5 (66;0.50) 1.0706 0.0451 0.9900 4.27
6 (94;0.50) 1.0701 0.0638 0.9873 5.07
7 (80;0.22) 1.0612 0.0696 0.9897 5.50
8 (80;0.78) 1.0638 0.0573 0.9903 4.53
9 (80;0.50) 1.0683 0.0547 0.9908 4.30
10 (80;0.50) 1.0781 0.0513 0.9872 4.15
11 (80;0.50) 1.0715 0.0536 0.9907 5.12
12 (80;0.50) 1.0715 0.0536 0.9907 4.17
13 (80;0.50) 1.0750 0.0487 0.9877 4.43
14 (80;0.50) 1.1155 0.0268 0.9764 4.94
t (min)
X/
X0
-0.1 0.1 0.3 0.5 0.7 0.9 1.1
0 10 20 30 40 50 60 70 80
Figure 4: Fit of Henderson and Pabis’ model (similar to Fick’s diffusion model)
Brazilian Journal of Chemical Engineering Vol. 25, No. 02, pp. 299 - 312, April - June, 2008 Similarly to the solution of Fick’s model,
parameter K can be thought to include the effective
diffusivity. The statistical analysis of this parameter as a function of the operating conditions indicated that it is significantly influenced (95% confidence level) by the air temperature and velocity, individually, and by their interaction, the linear term of the air velocity having the most pronounced effect (Figure 5). The preponderant air velocity effect, over the temperature effect, is an indication that diffusive
effects are not the only ones involved in the model
parameter K, making the evaluation of an effective
diffusivity inconsistent.
Tables 5 and 6 present the results for the non-linear fit of Page’s model to the natural and forced convective drying data, respectively. Regression coefficients higher than 0.99 obtained for all experiments indicate the excellent fit of this model to the experimental drying curves for natural and forced convective drying.
K (estimated effect)
-0.467812 1.542046
4.694306 4.726688
9.828968
p=0.05
v (Q) T (Q) T (L) T (L) * v (L) v (L)
-1 0 1 2 3 4 5 6 7 8 9 10 11 12
Figure 5: Pareto diagram for K parameter of Henderson and Pabis’ model.
Table 5: Fit of (X/X0) as a function of time by Page’s model (natural drying).
n
0
X
a exp kt
X
Run Tamb(ºC); R.Hamb (%) a k n R2 Deviation (%)
1 (26.87; 47.50) 0.9517 0.0505 1.4277 0.9984 1.96
2 (21.67; 55.02) 0.9349 0.0283 1.4818 0.9974 2.12
3 (24.97; 78.25) 0.9748 0.0394 1.1368 0.9982 1.71
4 (23.12; 69.20) 0.9611 0.0396 1.2177 0.9971 1.51
5 (25.83; 69.41) 0.9450 0.0311 1.4257 0.9974 2.05
6 (23.85; 67.78) 0.9293 0.0285 1.4323 0.9958 2.68
7 (24.19; 88.38) 0.9508 0.0174 1.2687 0.9979 1.83
8 (24.75; 63.19) 0.9523 0.0334 1.4313 0.9985 1.87
9 (25.28; 80.58) 0.9643 0.0143 1.5622 0.9984 1.96
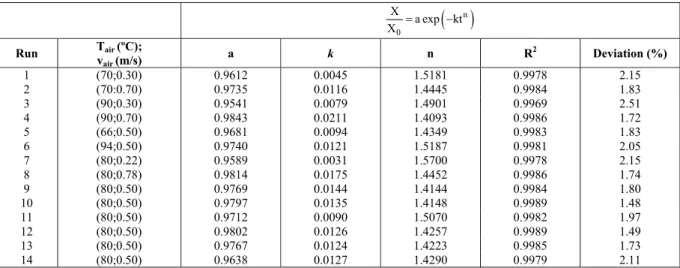
Table 6: Fit of (X/X0) as a function of time by Page’s model (forced convective drying).
n
0
X
a exp kt
X
Run Tair (ºC); vair (m/s)
a k n R2 Deviation (%)
Brazilian Journal of Chemical Engineering
According to the literature, the two parameters of
Page’s model, n and k account for the effects of
external drying conditions and the internal resistance to drying, respectively. The statistical analysis
applied to these parameters showed that k is
positively influenced by the air temperature and
velocity, and n is significantly affected only by the
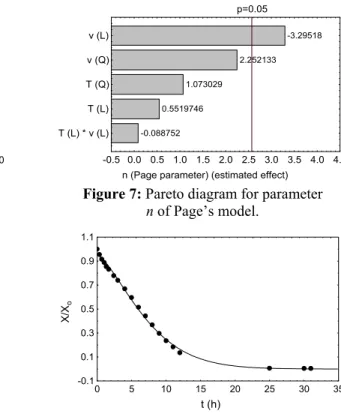
air velocity, at a confidence level of 95% (Figures 6 and 7). These results are in agreement with the
previous model analysis. Statistical models for n and
k as a function of the codified variables (T and v)
were obtained and are expressed by Equations 10 and 11, where only the statistically significant terms were considered.
k 0, 01150, 0021 T 0, 0051 v (10)
n 1, 46030, 0414 v (11) Figures 8 and 9 show the drying kinetic curves for run 8 (forced convective drying) and for run 1 (natural convective drying), respectively. An excellent adjustment of the non-linear Page’s model to the experimental data is verified.
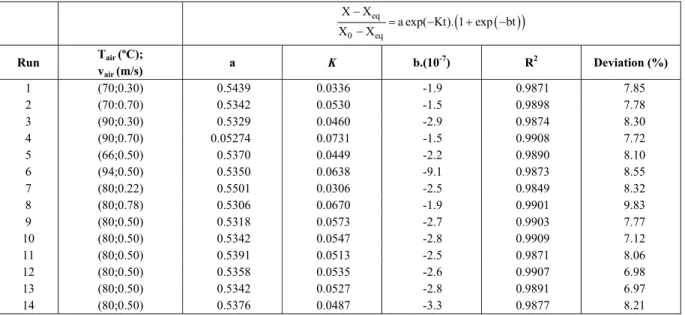
The model recently proposed by He (Equation 7) was also used to fit the recycled paper drying curves. As stated before, it is indicated in the cases that Equation (5) leads to large deviations from experimental data. Table 7 shows the model parameters and the adjustment quality (correlation coefficient and percentage deviation) evaluated for the forced convective drying data. The high correlation coefficients (all values above 0.989) indicate the model adequacy to represent the drying curves; however, the comparison of the model predictions and the experimental data resulted in deviations, which are quite higher than the ones obtained with the other models applied.
Summarizing the results of the drying kinetics modeling, an excellent fit of the experimental data was obtained using Page’s model (natural and forced convective drying) and an adequate adjustment was verified for the equations of Henderson and Pabis and of He. The analytical solution of Fick’s law considering a flat plate did not fit as well the experimental data, since the necessary hypotheses for its applicability were not satisfied in the cases studied here.
k (Page parameter) (estimated effect)
-0.967118 -1.29976
1.659309 3.215707
7.821673
p=0.05
T (Q) v (Q) T (L) * v (L) T (L) v (L)
0 1 2 3 4 5 6 7 8 9 10
Figure 6: Pareto diagram for parameter
k of Page’s model.
n (Page parameter) (estimated effect)
-0.088752 0.5519746
1.073029
2.252133 -3.29518
p=0.05
T (L) * v (L) T (L) T (Q) v (Q) v (L)
-0.5 0.0 0.5 1.0 1.5 2.0 2.5 3.0 3.5 4.0 4.5
Figure 7: Pareto diagram for parameter
n of Page’s model.
t (min)
X/
X0
-0.1 0.1 0.3 0.5 0.7 0.9 1.1
0 10 20 30 40 50 60 70 80
Figure 8: Non-linear fit of Page’s model for the forced
convective drying curve (run 8) (Tair = 80ºC; vair = 0.78
m/s) (R2 = 0.9986).
t (h)
X/X
o
-0.1 0.1 0.3 0.5 0.7 0.9 1.1
0 5 10 15 20 25 30 35
Figure 9: Non-linear fit of Page’s model for the natural
convective drying curve (run 1) (Tamb = 26.87ºC; R.
Brazilian Journal of Chemical Engineering Vol. 25, No. 02, pp. 299 - 312, April - June, 2008
Table 7: Fit of (X/X0) as a function of time by He’s equation.
eq
0 eq
X X
a exp( Kt). 1 exp bt
X X
Run Tair(ºC); vair(m/s)
a K b.(10-7) R2 Deviation (%)
1 (70;0.30) 0.5439 0.0336 -1.9 0.9871 7.85
2 (70:0.70) 0.5342 0.0530 -1.5 0.9898 7.78
3 (90;0.30) 0.5329 0.0460 -2.9 0.9874 8.30
4 (90;0.70) 0.05274 0.0731 -1.5 0.9908 7.72
5 (66;0.50) 0.5370 0.0449 -2.2 0.9890 8.10
6 (94;0.50) 0.5350 0.0638 -9.1 0.9873 8.55
7 (80;0.22) 0.5501 0.0306 -2.5 0.9849 8.32
8 (80;0.78) 0.5306 0.0670 -1.9 0.9901 9.83
9 (80;0.50) 0.5318 0.0573 -2.7 0.9903 7.77
10 (80;0.50) 0.5342 0.0547 -2.8 0.9909 7.12
11 (80;0.50) 0.5391 0.0513 -2.5 0.9871 8.06
12 (80;0.50) 0.5358 0.0535 -2.6 0.9907 6.98
13 (80;0.50) 0.5342 0.0527 -2.8 0.9891 6.97
14 (80;0.50) 0.5376 0.0487 -3.3 0.9877 8.21
Vapor Sorption Mathematical Modeling
Figure 10 shows the sorption isotherms at 25ºC and 50ºC obtained for a sample of paper dried under forced convective operating conditions of 70ºC and 0.30m/s.
A significant increase of the equilibrium moisture content of the paper in the region of capillary condensation (R.H. > 60%) is verified. It is also observed that the increase of the isotherm temperature reduces the material equilibrium moisture content for the entire range of relative humidity analyzed. This is the usual tendency,
according to the theory of the physical adsorption (Dullien, 1992). The same behavior was verified by
Mota Lima et al. (2004) for isotherms of handmade
paper, of the Kraft type.
Analyzing the results in Figure 10, a safe limit for storage of the recycled paper can be recommended at relative humidity of 60%, from which an abrupt increase of the material equilibrium moisture content is verified at 25ºC and 50ºC.
The models of GAB and GDW (Equations 8 and 9) were used to fit the sorption isotherm data. Table 8 shows the model parameters and the correlation coefficients obtained.
0 20 40 60 80 100
0.00 0.05 0.10 0.15 0.20
Xeq
(d
.b.)
RH(%) 25ºC 50ºC
Brazilian Journal of Chemical Engineering
Table 8: Parameters and correlation coefficients for the models of GAB and GDW applied to the vapor sorption data of recycled paper.
GAB (Eq. (8) GDW (Eq.(9))
T
(ºC) m [%(db)]
K
[% -1] C R
2 m
[%(db)]
K [% -1]
k
[%-1] w R
2
25 4.7058 0.8381 9.8576 0.9995 9.0681 3.0222 0.9110 0.3995 0.9999 50 4.3224 0.7839 9.0998 0.9998 6.6666 3.8142 0.8406 0.5572 0.9999
The results show that the GAB and GDW models lead to very good fits. The GDW model describes the data with a slightly higher accuracy than the GAB model; however, the difference is not significant.
Both the GAB and GDW models assume the existence of primary (Langmuir-type) adsorption sites on the paper surface. Each site adsorbs one water molecule, which can be the secondary adsorption site for the next molecule. The GAB and GDW models differ by the assumption of the number of secondary sites created from primary ones. The assumption of the GDW model is that not all water molecules adsorbed on primary sites will be secondary centers. Moreover, the model takes into account the possibility that one water molecule attached to a primary site can give rise to more than one secondary adsorption site.
Analyzing the physical meaning of parameter w
in the GDW model, one can assume that, since this parameter determines the ratio of water molecules adsorbed on primary sites that are converted into
secondary sites, when w = 1, each primary
adsorption site converts exactly into one secondary site. In this special case, the GDW equation becomes equal to the GAB equation.
The results in Table 8 show values of w less than
1; hence the analysis was made using the GDW
model. In Table 8 the values of m, around 9% and
6.7%, correspond to the maximum sorption on primary sites, for maximum equilibrium moisture contents of 19% and 14% (dry basis), at 25ºC and 50ºC, respectively (Figure 10). According to the
values obtained for w, around 40% and 56% (at 25ºC
and 50ºC, respectively) of those strongly bound molecules become secondary adsorption sites for the next water molecules.
In addition, according to the GDW model, the decrease observed in the material equilibrium moisture content with the rise in temperature is due
to the strong temperature dependence of K. The
sorption on primary sites is strongly exothermic;
therefore, their saturation occurs at larger values of the relative humidity.
CONCLUSIONS
On the basis of the results of this paper:
The drying rates of paper sheets dried under
natural conditions were influenced by the ambient relative humidity. The natural convective drying data were very well fitted by Page’s model.
The independent variables analyzed (air
temperature and velocity) influence in a positive way the forced convective drying process, increasing the drying rates and reducing the paper drying time. Drying kinetics showed the occurrence of constant and falling-rate periods for the recycled cellulose pulp. Experimental drying curves were fitted by empirical models, as follows: Page’s, Henderson and Pabis’ and He’s. The equation of Page resulted in better representation of the experimental data, being thus indicated to represent drying kinetics of the
recycled paper. Parameter k of Page’s model is
influenced positively by the operating variables, air
temperature and velocity, while for the parameter n
only the air velocity had a significant influence. These parameters were statistically correlated with the significant independent variables.
The analytical solution of the diffusion equation
for a flat plate (Fick’s simplified model) could not be used for the determination of the effective diffusivity coefficients, since the hypotheses of the model were not valid in the present study.
The experimental water sorption data were well
adjusted by the GAB and GDW models (a slightly better accuracy was obtained using the GDW model). The equilibrium moisture content decreases with the rise in temperature. The analysis of the GDW model parameters gives insights into the mechanism of water adsorption in the material tested.
A significant increase of equilibrium moisture
Brazilian Journal of Chemical Engineering Vol. 25, No. 02, pp. 299 - 312, April - June, 2008
ACKNOWLEDGEMENTS
The authors acknowledge the financial support received from Foundation for Research Support of São Paulo State, FAPESP, for this research.
NOMENCLATURE
C Kinetic constant related to
the sorption in the first layer (GAB model)
(-)
a, b, n, k, K
Drying kinetics mathematical model parameters
(-)
C Concentration %
Def Effective diffusivity m2/s
k Kinetic constant related to
sorption on secondary sorption sites (GDW model)
%-1
K Kinetic constant related to
multilayer sorption (GAB model); kinetic constant related to the sorption on primary sorption sites (GDW model)
%-1
L Thickness of the plate M
L Linear term of codified
independent variable (Pareto diagram)
(-)
m Monolayer capacity (GAB
model); concentration of primary active surface sites (GDW model)
% d.b.
N Drying rate s-1
Q Quadratic term of codified
independent variable (Pareto diagram)
(-)
R.H. Relative humidity %
R2 Regression coefficient
t Time s
T Codified variable for air
temperature
(-)
Tair Air temperature ºC
v Codified variable for air
velocity
(-)
vair Air velocity m/s
w Parameter determining what
part of water molecules adsorbed on primary sites convert into the secondary adsorption sites (GDW model)
(-)
X Moisture content d.b.
Subscript
0 Initial point (-)
f Final point (-)
eq Equilibrium (-)
cr Critical point (-)
s Solids (-)
dry Drying (-)
amb Ambient (-)
C Constant (-)
i Initial (-)
REFERENCES
Dullien, F. A. L. Porous Media: Fluid Transport and Pore Structure. USA: Academic Press, 2. ed., 574 (1992).
Coumans, W. J. and Kruf, W. M. A., Mechanistic and lump approaches of internal transport phenomena during drying of paper sheet. Drying Technology, 13, No. 4, 985-998 (1995).
Crank, J., The mathematics of diffusion. Pergamon Press, Oxford (1975).
Furmaniak, S.; Terzyk, A. P.; Gauden, P. A.; Rychlicki, G. Applicability of the generalised D’Arcy and Watt model to description of water sorption on pineapple and other foodstuffs. Journal of Food Engineering, 79, 718-723 (2007a).
Furmaniak, S.; Terzyk, A. P.; Gauden, P. A. The general mechanism of water sorption on foodstuffs – Importance of the multitemperature fitting of data and the hierarchy of models. Journal of Food Engineering, 82, 528-535 (2007b).
He, J. H., Some asymptotic methods for strongly nonlinear equations. International Journal of Modern Physics, 20, No. 10, 1141-1199 (2006). Marinos-Kouris, D.; Maroulis, Z. B., Transport
Properties in the Drying of Solids. Handbook of Industrial Drying, ed. A. S. Mujumdar, 1, 113-159 (1995).
Mc Cormick, P. Y., Solids drying fundamentals. In: Perry, R. H. and Chilton, C. H. Chemical engineer´s handbook. Mc Graw-Hill Co. 5ed. Sec. 20-4 (1983).
Mota Lima, O. C., Pereira, N. C. and Machado, M. A. L. S., Generalized drying rate curves in paper drying. Drying 2000. Proceedings of the 12th International Drying Symposium (IDS`2000), Noordwijkerhout, Holanda (2000a).
Brazilian Journal of Chemical Engineering
conductive/convective paper drying. Braz. J. Chem. Eng., 17, No 4-7, 539-548 (2000b).
Mota Lima, O. C., Machado, G. D., Lucheis, R. M. and Pereira, N. C., Moisture equilibrium isotherms for a handmade Kraft paper. Drying 2004. Proceedings of the 14th International Drying Symposium (IDS 2004), ed. M. A. Silva and S. C. S. Rocha, São Paulo, Brazil, B, 1241-1248 (2004).
Mota Lima, O. C., Rocha, S. A., Tofoli, C. M, Souza, L. H. C. D. and Pereira, N. C., Heat transfer of short- and long-fiber cellulose. Proceedings of the 3rd Inter-American Drying Conference, Montreal, Canada, August 21-23, 2005 (ISSN 0771706340) CD-ROM (2005). Mujumdar, A. S., Innovation in drying. Drying
Technology, 14, No. 6, 1459-1475 (1996). Nazhad, M. and Paszner, L., Temperature effect on
paper recycling. Drying´94. Proceedings of the 9th International Drying Symposium (IDS`94), ed. V. Rudolph and R. B. Keey, Hemisphere Publ., 1239-1246 (1994).
Parry, J. L., Mathematical modeling and computer simulation of heat and mass transfer in agricultural grain drying: A review, Journal of Agricultural Engineering Researches, 32: 1-29 (1985).
Pikulik, I. I. and Poirier, N. A., Combined convective and conductive drying of paper. Drying´94. Proceedings of the 9th International Drying Symposium (IDS`94), ed. V. Rudolph e R. B. Keey, Hemisphere Publ., 1163-1170 (1994).
Poirier, N. A and Pikulik, I. I., The effect of drying temperature on the quality of paper. Drying´96. Proceedings of the 10th International Drying Symposium (IDS`94), ed. C. Strumilo and Z. Pakouwski, Hemisphere Publ., 1189-1196 (1996). Rueff, M. and Faloui, F., Influence of sheet structure
and process conditions on paper drying. Drying´94. Proceedings of the 9th International Drying Symposium (IDS`94), ed. V. Rudolph and R. B. Keey, Hemisphere Publ., 1221-1228 (1994).
Vieira, M. G. A., Estrella, L. and Rocha, S. C. S., Energy Efficiency and Drying Kinetics of Recycled Paper in convective Drying. Proceedings of the 3rd Inter-American Drying Conference, Montreal, Canada, August 21-23, 2005, CD-ROM (2005).