O
R
I
G
I
N
A
L
A
R
T
I
C
L
E
Evaluation of Out-of-Autoclave (OOA) epoxy system
Fernanda Guilherme
1,2, Silvana Navarro Cassu
1,3, Milton Faria Diniz
3,
Tanila Penteado de Faria Gonzales Leal
2, Natália Beck Sanches
4and Rita de Cássia Lazzarini Dutra
1*
1
Instituto Tecnológico de Aeronáutica – ITA, São José dos Campos, SP, Brazil
2
Embraer S.A., São José dos Campos, SP, Brazil
3
Divisão de Química – AQI, Instituto de Aeronáutica e Espaço – IAE, São José dos Campos, SP, Brazil
4
Centro Logístico da Aeronáutica – CELOG, Santana, SP, Brazil
Abstract
Epoxy resins (EP) usually cure in autoclave to minimize resin voids and to achieve the desired resin/iber ratio. Cure parameters such as temperature, vacuum and pressure levels are controlled and monitored. Aiming time and cost optimization, new out-of-autoclave (OOA) cure processes have been developed lately. This study evaluated the cure cycle and the effect of non-programmed interruptions in an OOA process. Fourier Transform Infrared spectroscopy (FT-IR) results show similarities between the resin used and diglycidyl ether of bisphenol A (DGEBA) and also that the curing system is composed of cyan and sulfur hardeners, codiied in industry, as Components of #2511 Resin System. The cure cycle and its interruptions were simulated by dynamic-mechanical analysis (DMA). The samples obtained were evaluated by FT-IR and differential scanning calorimetry (DSC), whose results show that the degree of cure varying between 0.8 to 0.85 was achieved at 120 °C.
Keywords: DMA, DSC, epoxy system, FT-IR, OOA.
1. Introduction
Composite materials are used in a wide range of application, such as the aerospace industry. They can be employed as rigid thermal insulation of rocket engine and in many types of aircraft parts (fairings, fuselages, leading edges)[1].
Most established curing process for high performance aerospace composites parts requires the use of autoclaves[2],
which involves temperature, vacuum and pressure. Consequently, the process present high operating costs, long cycle times and limitation of produced parts size[3],
besides high investments are needed.
During the last four decades, the use of composites has undergone many changes. Several studies proposed changing the method of composite production, the most significant being the out-of-autoclave (OOA) cure[4].
Nowadays, OOA curing process is still seldom used in comparison to the conventional methods such as autoclave curing prepregs. The latest aircraft development programs, in large companies, invest millions in autoclaves and automated production machines to meet their high demands, around 80 to 120 aircraft per year. About 10% of production costs represent the curing and assembly of the manufactured composite parts. This fact is one of the motivations for the OOA process development[4].
According to Harshe[1], Thomas et al.[5] and ETH[6],
prepreg (reinforcement of preimpregnated fibers with a partially cured polymer resin) of OOA is a potential alternative to materials cured in traditional autoclave. It reduces processing costs and allows the manufacturing of larger parts, limited in conventional prepregs by the autoclave size. OOA process differs from the conventional ones because it is exclusively dependent of vacuum and
temperature and can cure in an oven. These OOA systems are capable of achieving mechanical properties similar to some prepreg processed by autoclave. However, according to Harshe[1], further research should be developed to improve
the robustness of these processes.
Epoxy resins (EP) composites are the most used in aeronautical applications due to the cost/benefit relation between price, weight, thermal and mechanical properties. Epoxies are the resins used in OOA systems along with selected curing agents (CA)[7]. Since prepregs are supplied
ready for use, their exact chemical composition is unknown and varies from manufacturer to manufacture.
There is a large amount of studies related to the characterization and identification of curing agents using Fourier Transform Infrared spectroscopy (FT-IR), by transmission mode. Some of these studies, were developed at the Brazilian Institute, Instituto de Aeronáutica e Espaço (IAE).
Sugita et al.[8] showed that carbonylated compounds
are more easily identified by FT-IR due to the presence of C = O of the ester functional group, origined from the epoxide ring/anhydride curing reaction. However, the methodology used for the separation of this component is complex. A few studies reported a simpler method for CA separation: controlled pyrolysis (CONTROLPIR/FT-IR)[9,10]. These routines were
able to isolate and characterize, by FT-IR, the CA anhydride type in EP and even the composite amide-amine type, which shows a higher degree of difficulty to be separated.
Romão et al.[11] demonstrated that it was possible to
the developed methodology could be evaluated for the investigation of other types of CA, under specific adaptations. Other technique coupled thermogravimetric analysis and FT-IR (TG/FT-IR) to identify polymercaptan and amine adduct based CA, as well as CA containing polyaminoamide in smaller contents.
Romão et al.[12], in another study, also developed the
characterization of EP DEGBA type, cured with agents based on mercaptan and tertiary amines, by middle infrared (FT-MIR) and near infrared (FT-NIR). The spectrometric changes resulting from the curing reaction were evaluated, when the disappearance of some characteristic functional groups occurred. It was observed that the NIR region shows better the spectrometric changes of the reactions studied, allowing the detection of the CA, even in smaller proportion.
Romão et al.[13], in a supplementary study, applied the
CONTROLPIR/FT-IR method to characterize DGEBA epoxy based systems cured with other agents, such as anhydride, pure or in the presence of small amounts of mercaptan and amino-phenol. The TG/FT-IR coupling was also used to identify the CA present even in a small content in the epoxy system.
Andrade et al.[14] showed that the use of CA
containing mercaptan groups (CAPCURE) in DGEBA system/diethylenetriamine (DETA) reduced the cure time of an adhesive to 24 hours. FT-MIR/FT-NIR and differential scanning calorimetry analysis (DSC) results showed a complete cure. The addition of asbestos in adhesive containing CAPCURE was also evaluated. The reactions between the epoxy and amine groups, as well as those occurring between epoxy and mercaptan, were studied in the spectral regions MIR and NIR. It was observed that asbestos does not interfere in the curing reactions and the FT-NIR evidences better the spectrometric changes during reactions in comparison to the FT-MIR analysis, similar to what occurred in the study by Romão[12].
Sales et al.[15] investigated the application of luminescence
spectroscopy under steady state conditions for studying F161 prepreg of fiber glass and EP. The results were compared to those in the FT-NIR analysis. Both methods indicated that the crosslinking reaction can be monitored by spectrometric analysis of the changes observed. FT-IR analysis indicated the CA used as an amine function, however it did not indicate the chemical structure of the compound. The degrees of cure evaluated by both techniques were similar.
Ferrari et al.[16] carried out the characterization of some
prepregs (EP/carbon fiber (CF)) by FT-IR, TGA, DSC and dynamic-mechanical analysis (DMA). FT-IR transmission mode and photoacoustic spectroscopy (PAS) were performed. The sample techniques used were KBr pellets, pyrolysis in Bunsen burner and controlled pyrolysis. FT-IR transmission analysis of the extract obtained by solvent treatment was able to identify cyanoguanidine (dicyandiamide) as the curing agent. FT-IR/PAS spectra evidenced the spectrometric changes resulting from the curing of the epoxy system. In addition, thermal analysis showed the curing process steps.
The application of prepreg to the manufacture of composite parts includes[16,17] cutting and laminating a
predetermined number of plies to be used in a particular part. As the manufacturing process depends on a curing
cycle already established by the manufacturer, there is an interest of the scientific and technological community in studying which properties of the material may change once the curing process is interrupted.
In this context, the contribution of this research is the evaluation of an OOA epoxy system when compared to conventional autoclave curing system, and the influence of the curing cycle interruption at different stages of the cure. The application of methodologies previously developed in our laboratories and the development of new methods, with the use of FT-IR latest techniques such as universal reflection attenuated (UATR) to identify OOA prepregs composition, can contribute significantly to quality control laboratories and research companies in the aeronautical industry being more competitive.
Therefore, based on the stated above and aligning the interest of companies working with prepregs, NIR and MIR techniques for the identification/characterization of the base polymer/curing agent were evaluated in this study, applied to the analysis of a epoxy system of unknown composition. The evaluation of the materials subjected to the curing cycle interruptions at different temperatures was performed by FT-IR and DSC.
2. Materials and Methods
A CF prepreg and an epoxy resin film were analyzed in this study, both of unknown composition. The analyzed prepreg has CF reinforcement, and both, prepreg and film, are made of EP of OOA curing. It was provided by Toray Company.
As prepregs are perishable materials, it was stored at -18 °C in order to slow down the chemical reactions involved in curing process and consequently keep the storage conditions during the time allowed for manufacturing parts, which is 2 years. The shelf life determined by the manufacturer is 24 months and the out time is restricted to a maximum of 25 days at room temperature[18].
2.1 Methodologies/conditions
The prepreg and the EP film were previously conditioned in sealed plastic bags. For the characterization tests, they were removed from the freezer to defrost at ambient temperature for about 1 hour (23°C/65%RH). After that, the materials were cut according to required size for each technique.
2.2 FT-IR analysis
They were performed on a Spectrum One PerkinElmer spectrophotometer (conditions: 7000 to 400 cm-1 for
NIR analysis and 4000 to 400 cm-1 for MIR analysis,
resolution 4 cm-1, 20 scans). Sample dimensions were
2.3 Identification of CA
Controlled pyrolysis was carried out at 500 °C/5 min, and then the pyrolysed film was analyzed by FT-IR transmission mode. In another step of identification, the material was treated with water in a Soxhlet apparatus, and the extract obtained was analyzed by UATR. The materials used as reference for comparison with the curing system used were curing agent and accelerator, based on cyan and amine-sulfur compounds, respectively. They also were analyzed by FT-IR mode transmission, after being prepared as KBr pellet (0.8: 400mg).
2.4 TGA analysis
The materials degradation was investigated on a TGA model 4000 supplied by PerkinElmer, under the conditions: 10mg, nitrogen atmosphere (N2) (20 mL min-1), temperature
range 25°C to 950°C, heating rate 10 °C/min. The purpose of this test was to determine the material degradation profile to set the optimum parameters for the pyrolysis with controlled temperature[11]..
2.5 DSC analysis
The DSC analyses of the prepreg were carried out using a DSC 8000 PerkinElmer, with 10mg of samples in aluminum hermetic pans, at 10 °C/min, between -40 °C and 230 °C. The second heating was conducted under the same conditions. Analyses were carried out with N2 atmosphere (20 mL min-1).
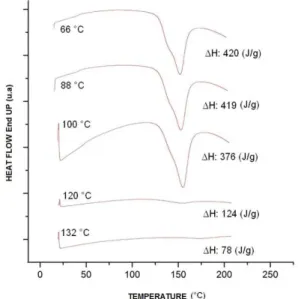
The final temperature used in DSC analyses was set in accordance with the initial degradation temperature determined by TGA. Samples at different temperatures (66 °C, 88 °C, 100 °C, 120 °C and 132 °C) were obtained during the cure cycle and analyzed by DSC under the conditions described above. Samples at different temperatures (66 °C, 88 °C, 100 °C, 120 °C and 132 °C) were obtained through different cure cycles as mentioned in item Curing process interruptions. DSC analyses were performed in triplicate.
The enthalpy values were corrected considering only the mass of resin, with a standard deviation of about 10%. This correction was made by discounting the mass of the
carbon fiber, obtained from TGA analysis. The degree of cure was estimated in relation to the enthalpy obtained by the DSC curve of the uncured resin sample.
2.6 DMA analysis
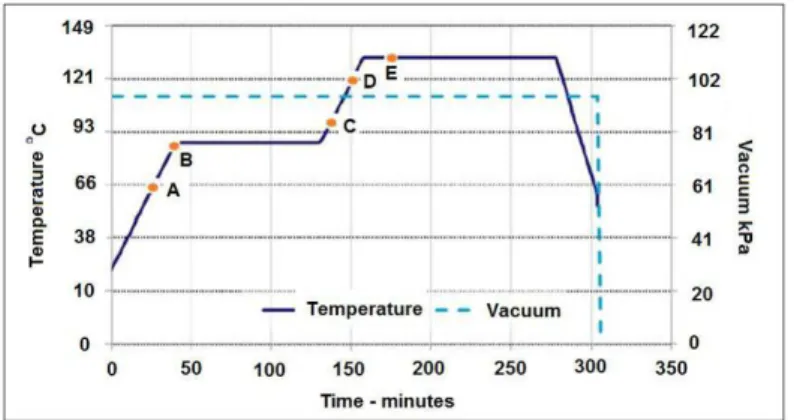
The cure of the prepreg was also monitored by DMA using the curing cycle recommended by the manufacturer. The curing cycle, ranging from 25 to 132ºC is showed in Figure 1. The equipment used was a PerkinElmer DMA model 8000. Analyses were performed using dual-cantilever clamps, frequency of 1 Hz, and the dimensions of the prepreg specimens were (50 x 5 x 0.7) mm. The heating rate used between the isothermal temperatures was 1.7 ºC/min. In the DMA test, aluminum paper was used on the prepreg tips attached to the DMA claws, avoiding the adhesion of the resin to the claw and facilitating the removal of the sample for later tests.
2.7 Curing process interruptions
Simulation of curing interruptions was carried out in DMA under the same conditions described above. The materials obtained from the interruptions at different temperatures received codes, as follows: A (25 °C to 66 °C); B (25 °C to 88 °C); C (25 °C to 100 °C); D (25 °C to 120 °C) and E (25 °C to 132 °C).
Samples were collected at the predetermined temperatures, as presented in Figure 1, and analyzed by UATR and by DSC (under the same conditions previously described, in section 2.2, to check the curing stage of each specimen).
3. Results and Discussion
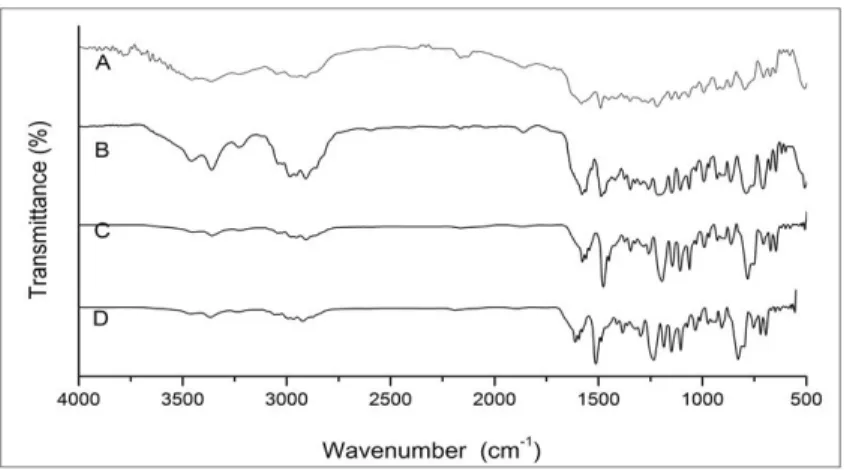
Initially, materials as received were characterized by surface FT-IR techniques, such as DRIFT (Figures 2A and 2B) and UATR (Figures 2C and 2D). As it is known, the depth of penetration (pathlength) of the infrared beam in the DRIFT technique is deeper than UATR[19,20], consequently DRIFT
and UATR spectra can present different results. However, the sample preparation in these FT-IR reflection modes do not require complex process. The material is analyzed directly without any treatment. DRIFT spectra usually evidence
surface coating and inner composition showing then in some cases, large bands. Meanwhile UATR is considered a surface technique that use a zinc selenide crystal with diamond to analyze the surface material pressuring the sample against the crystal to assure that it has a good contact with the surface of sample and the incident IR beam, preventing loss of beam irradiation[21,22].
The major bands showed by both techniques, in all spectra at 3450 cm-1 (OH), 1250 and 1040 cm-1 (aromatic ether group),
917 cm-1 (main terminal epoxy band) and 826 cm-1
(para-substitution aromatic) characterized[19] the functional
groups of EP. UATR spectra showed more defined resin bands, whereas DRIFT spectra distinctly showed an absorption at approximately 2160 cm-1 (Figure 2A), suggesting the
detection of another component. This component might possibly be the curing agent, as the band can be assigned to cyan groups[19]. This possibility can be further investigated
by other FT-IR techniques, with or without prior solvent extraction[19,23].
All data suggest so far that an effortless non-destructive analysis without samples pretreatment, by UATR and DRIFT techniques, is able to indicate the type of resin, in this case
an EP DGEBA type. It can also suggest the curing agent used as a cyan compound.
3.1 Transmission NIR/MIR analysis of the film EP
To attempt a better characterization of the EP, the EP film as received was also analyzed by NIR. Figure 3 shows the NIR spectrum of the EP film. Table 1 indicates the main NIR bands and their probable assignment[12,24] which are
characteristic of a DGEBA resin type.
It is known that the MIR spectra of cured epoxy resins derived from bisphenol A and epichlorohydrin are quite similar to the uncured resins spectra. The main difference is the absence of absorption at 917 cm-1, assigned to the
epoxy group[25] and to the presence of new bands from the
CA employed. In order to try to identify the CA, an attempt was made for controlled pyrolysis (CONTROLPIR / FT-IR), already developed by the group[9,10].
The temperature range used in the CONTROLPIR/FT-IR technique, was set in to the temperature established by TGA and corresponds to the resin degradation temperature.
Figure 3. Transmission FT-NIR partial spectrum (7600-4000 cm-1) of OOA EP film.
Figure 2. FT-IR spectra of the analyzed materials as received: (A) OOA CF/EP prepreg (DRIFT); (B) OOA EP Film (DRIFT); (C) OOA
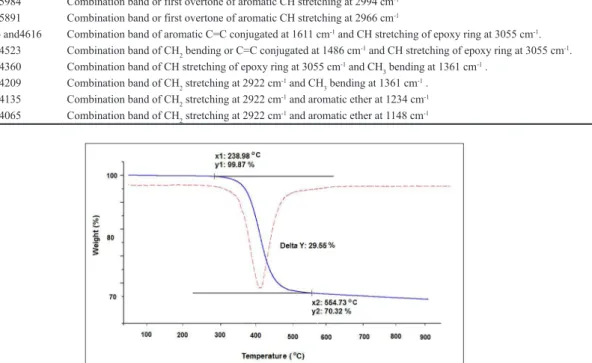
The thermal decomposition of the film occurred in a single stage, between 290°C and 520 °C (Figure 4).
Although the TGA experiment was not able to separate the EP components, FT-IR analyses were performed on the EP film after controlled pyrolysis[9] at 500 °C, in an attempt
to determine whether it would be possible to identify the CA functional groups (Figure 5C).
The bands in Figure 5C, around 3300 cm-1
and 1500 to 1600 cm-1 indicate the presence of the NH
group, and those from 1200 to 1400 cm-1, the CN bond[19].
Detection of these functional groups is in agreement with the molecular structure of cyan hardener.
However, as bands in the fingerprint region (i.e., wavenumbers under 1500 cm-1) are characteristic of
specific kinds of bonds, they must be associated to another region for the unique identification of the material. In this context, the band between 2100 and 2200 cm-1 of the cyan
group was not observed, suggesting that the spectrum
Table 1. Probable assignment of main NIR bands of EP film.
Wavenumber (cm-1) Probable assignment[12,24]
6069 First overtone of terminal CH2 stretching mode at 3055 cm-1
5984 Combination band or first overtone of aromatic CH stretching at 2994 cm-1
5891 Combination band or first overtone of aromatic CH stretching at 2966 cm-1
4666 and4616 Combination band of aromatic C=C conjugated at 1611 cm-1 and CH stretching of epoxy ring at 3055 cm-1.
4523 Combination band of CH2 bending or C=C conjugated at 1486 cm-1 and CH stretching of epoxy ring at 3055 cm-1.
4360 Combination band of CH stretching of epoxy ring at 3055 cm-1 and CH
3 bending at 1361 cm -1 .
4209 Combination band of CH2 stretching at 2922 cm-1 and CH
3 bending at 1361 cm -1 .
4135 Combination band of CH2 stretching at 2922 cm-1 and aromatic ether at 1234 cm-1
4065 Combination band of CH2 stretching at 2922 cm-1 and aromatic ether at 1148 cm-1
Figure 4. TGA and DTG curves of carbon fiber sample with epoxy resin, starting at a temperature of 30 °C to 950 °C, under nitrogen atmosphere.
Figure 5. Transmission FT-IR/MIR spectra: (A) Cyan hardener compound (KBr pellet - 0.8: 400mg), (B) extract - solid residue of EP
(Figure 5C) shows only one pyrolysis product that contain amine groups. Results, however, can not indicate undoubtedly that it is a known cyan hardener, as Figure 5A, for example.
Indication of cyan groups in the prepreg and resin let to the assessment of various types of solvents, as previously performed by Ferrari et al.[16], for solvent treatment, which
is done to isolate and study the different components. The best result for the separation and identification of the CA was observed by using water as solvent. This is accordance with the literature[23], that indicates that cyan
hardener compound, containing NH2, NH and CN groups, is partially soluble in water.
The comparison between Figures 5A and 5B indicates that the CA used is based on a cyan compound[26]. Therefore, as
the spectrum of the controlled pyrolysis (Figure 5C) failed to present any cyan functional groups, it can be concluded that
the water extraction was more effective for the identification of cyan hardener, probably due to higher concentration of this compound in extract than in pyrolysis product of prepreg, which contains traces of compound.
3.2 FT-IR analysis of the prepreg after solvent treatment
Literature[27] states that the cure of epoxy systems
with cyan hardener compound often requires the presence of a additional compound in the formulation, such as an accelerator. Its function is to work as the system activator.
The prepreg composition is not completely known and it is reasonable that another CA or additives were added to the formulation along with the cyan hardener compound. For this reason, the prepreg was treated with pyridine[23],
which is a solvent currently used for extracting sulfur curing accelerator in prepregs at the Brazilian Institute, IAE.
Figure 6 shows the FT-IR spectra obtained after extraction with pyridine and previously treated with acetone. Absorptions at 3459 and 3367 cm-1 can be attributed[19] to NH groups,
those at 1285, 1144, 1105 and 600 cm-1 suggest the presence
of sulfone groups, and the one at 3060 cm-1 is likely due
to the CH aromatic group. The doublet at 1593-1502 cm-1
can be assigned to the C-C aromatic group, while the band at 830 cm-1 assigned to the para-substituted CH aromatic.
Figure 6 shows also the reference spectrum for an amine-sulfur curing accelerator[26]. The similarities observed indicate this
compound is in the curing system. Hence, it can be concluded that the epoxy resin is of the DGEBA type containing cyan and sulfur compounds, codified in industry, as hardener components of #2511 system.
3.3 Evaluation of resin curing behavior
The resin curing cycle as recommended by the manufacturer was simulated by DMA (Figure 7). Initially, as temperature increases, the storage modulus (E’) profile shows a decrease. This happens prior to the curing reaction,
Figure 6. Transmission FT-MIR spectra of: (A) Extract- residue
obtained after treatment with acetone and pyridine (KBr pellet 0.8: 400 mg); (B) amine-sulfur curing accelerator (cast) (KBr pellet- 0.8: 400 mg KBr).
Figure 7. Initial characterization of Prepreg DMA curves: storage modulus curve (__), loss modulus (---) and tan δ (-.-.-) of CF/ EP
due to the reduction of resin viscosity as it is heating up. This behavior contributes to a better spread of the resin into the prepreg fibers.
After 150 min, it was noted that the storage modulus increased gradually. It indicates that the resin is gelling, what decreases the polymeric matrix flowability[18]. As time goes
by, E’ increases continuously until it reaches a stable value around 190 min what indicates that the cure reactions are completed at 132°C.
The curing behavior was also monitored by DSC, at constant heating rate of 10 °C/min. The DSC curve (Figure 8) of the CF/EP prepreg reach its maximum exothermic peak at 158 °C. The enthalpy regarding the curing reaction of the epoxy resin is 164 J/g. In Figure 8, the partial Tg of the system can be observed close to 0 °C of the uncured prepreg sample and this Tg disappears with the thermal cycles shown in Figure 9.
Aeronautical parts manufactured from OOA systems can have its curing cycles unintentionally interrupted for several reasons. Interruptions of curing cycles at different temperatures can be simulated in DMA and consequences in their chemical structure can be evaluated by FT-IR and DSC.
DMA analysis initially made with prepreg in constant heating rate was used as a reference for choosing the temperatures in which to interrupt cycles, in accordance to the variation of storage modulus (as shown in Figure 7).
The temperature chosen for the first curing interruption was 66 °C (sample A), because the material at this point had not undergone a significant change in its composition, only variation of resin viscosity without changes in storage modulus (E’). An interruption at this temperature probably does not affect the material curing process. DSC (Figure 9) and FT-IR (Figure 10) analysis on sample A shows that there was practically no variation from the raw material results.
Sample B was obtained after the second interruption of the curing cycle at 88 °C. FT-IR and DSC results of sample B also showed a similar profile to the prepreg prior to curing process. This behavior was expected due to the storage modulus curve, which only presents an increase after 140 minutes after starting the analysis.
Storage modulus of samples C and D, from interruptions at 100 °C (140 min) and 120 °C (155 min), respectively, showed an increase in value. Sample C showed a slight reduction in the residual cure in comparison with samples A and B, showing the degree of cure of 0.3. Sample D results indicate that the curing process is almost complete. It can be evid.enced by the observation of the DSC curves, as samples D and E reached a degree of cure of 0.8 and 0.85, respectively. FT-IR analysis of samples D and E (Figure 10 - D and E) showed that the band assigned to the epoxy group (around 910 cm-1) is
not observed at 120 °C. These findings are in accordance to the decrease of curing reaction accompanied by DSC. This curing temperature is coincident with the one cited by Ferrari et al.[16] for a prepreg used in the aeronautical industry.
In temperatures higher than 120°C, bands of CO/CN in the region between 1000-1200 cm-1, and of aromatic substitution
around 800 cm-1, suffer modifications in position, shape
and intensity, suggesting changes in chemical structures[19].
4. Conclusion
FT-IR analysis of OOA epoxy system in the form of prepreg and film showed that the resin has a structure similar to the one found in DGEBA-based polymers and that the curing system used is based on cyan hardener and
Figure 8. Prepreg DSC curves of CF/EP at 10 °C/min in N2
atmosphere.
Figure 9. DSC curves of CF prepreg with EP obtained after
isothermal treatment (curing interruptions). Delta H was corrected in relation to the mass of resin.
Figure 10. UATR spectra of the OOA epoxy system: all samples
will start at 25 oC: (A) until 66 °C; (B) 88 °C; (C) until 100 °C;
amine-sulfur compounds, codified by industry as hardener components of #2511 system.
The DSC evaluation of interruptions in the curing cycle at different temperatures, showed that interruptions in temperatures up to 100 °C should not interfere with the continuity of the cure process, since it was observed a low degree of cure (0.3 at 100 °C). The FT-IR spectra of these samples detected the same characteristic bands as the FT-IR spectrum of the resin prior to the cure process, evidencing minor or no changes whatsoever in the chemical composition.
On the other hand, DSC results of samples collected from interruptions at temperatures higher than 120 °C showed that the resin was almost completely cured, with a degree of cure between 0.8 and 0.85. Furthermore, the FT-IR spectra of these samples did not evidenced the band related to the epoxy functional group, validating the DSC findings.
Based on the results found, we consider that the methodology developed in our laboratories, by using of these spectroscopic techniques, FT-MIR (transmission and reflection modes, including UATR) and FT-NIR (transmission mode), associated to thermal analyses such as TGA, DSC and DMA, can be an important contribution for studying of epoxy systems composition and evaluation of OOA curing behavior.
5. Acknowledgements
This paper was supported in part by PVNS (National Senior Visiting Professor Program) and PROAP (Postgraduate Support Program) from CAPES and ADC/DCTA (Classical sports association of civil and military servants of the Aerospace Technical Center).
6. References
1. Harshe, R. (2015). A review on advanced out-of-autoclave composites processing. Journal of the Indian Institute of Science,
95(3), 207-220. Retrieved in 2015, June 25, from http://journal. library.iisc.ernet.in/index.php/iisc/article/view/4567 2. Costa, M. L., Rezende, M. C., & Botelho, E. M. (2005).
Estabelecimento de ciclo de cura de pré-impregnados aeronáuticos. Polímeros: Ciência e Tecnologia, 15(3), 224-231. http://dx.doi.org/10.1590/S0104-14282005000300014. 3. Grunenfelder, L. K., Centea, T., Hubert, P., & Nutt, S. R. (2013).
Effect of room-temperature out-time on tow impregnation an out-of-autoclave prepreg. Composites. Part A, Applied Science and Manufacturing, 45, 119-126. http://dx.doi.org/10.1016/j.
compositesa.2012.10.001.
4. CW Composites World. (2015). The market for OOA aerocomposites. Retrieved in 2015, June 25, from http://www.compositesworld. com/articles/the-market-for-ooa-aerocomposites-2013-2022 5. Thomas, A. C., John, J. G. Jr., Pavel, S., & Suresh, G. A. (2014).
Void reduction during out-of-autoclave thermoset prepreg composite processing. In: Proceedings of the Conference Society for the Advancement of Material and Process Engineering. Seattle: SAMPE Noth America.
6. ETH Zuric. (2012). Composite materials and processing. Zürich: ETH Zuric. Retrieved in 2012, June 31, from http:// www.structures.ethz.ch/research/composite-materials-and-processing.html
7. Fan-Long, J., Xiang, L., & Soo-Jin, P. (2015). Synthesis and application of epoxy resins: a review. Journal of Industrial and
Engineering Chemistry, 29, 1-11. http://dx.doi.org/10.1016/j. jiec.2015.03.026.
8. Sugita, T., & Ito, M. (1965). Studies of thermosetting resin. the infrared analysis of cured epoxy resins. Bulletin of the Chemical Society of Japan, 38(10), 1620-1627. http://dx.doi. org/10.1246/bcsj.38.1620.
9. Dutra, R. C. L. (1997). Modificação de fibras de polipropileno com EVA funcionalizado (Doctoral thesis). Universidade Federal
do Rio de Janeiro, Rio de Janeiro.
10. Romão, B. M. V., Dutra, R. C. L., Diniz, M. F., & Ribeiro, A. P. (2001). Aplicação de técnicas FTIR à caracterização de materiais utilizados na indústria aeroespacial. Pesquisa Naval,
14(14), 273-282.
11. Romão, B., Diniz, M. F., Azevedo, M. F. P., Lourenço, V. L., Pardini, L. C., Dutra, R. C. L., & Burel, F. (2003). Caracterização por FT-IR de agentes de cura utilizados em resinas epoxídicas-II-polimercaptana, poliaminoamida e amina modificada. Polímeros: Ciência e Tecnologia, 3(3), 173-180. http://dx.doi.org/10.1590/S0104-14282003000300007. 12. Romão, B. M. V., Diniz, M. F., Pardini, L. C., & Dutra, R.
C. L. (2004). Aplicação de FT-MIR e FT-NIR ao estudo de reação de cura de sistemas epoxídicos. Polímeros: Ciência e Tecnologia, 14(3), 142-149.
http://dx.doi.org/10.1590/S0104-14282004000300008.
13. Romão, B. M. V., Diniz, M. F., Azevedo, M. F. P., Lourenço, V. L., Pardini, L. C., Dutra, R. C. L., & Burel, F. (2006). Characterization of the curing agents used in epoxy resins with TG/FT-IR technique. Polímeros: Ciência e Tecnologia, 16(2), 94-98. http://dx.doi.org/10.1590/S0104-14282006000200007. 14. Andrade, H. P. C., Diniz, M. F., Azevedo, M. F. P., Cassu, S.
N., Lourenço, V. L., Pardini, L. C., & Dutra, R. C. L. (2008). Comportamento de cura de adesivo epoxídico contendo grupo mercaptana avaliado por espectroscopia no infravermelho (MIR/NIR) e calorimetria exploratória diferencial (DSC).
Polímeros: Ciência e Tecnologia, 18(4), 359-365. http://dx.doi. org/10.1590/S0104-14282008000400017.
15. Sales, R. C. M., Diniz, M. F., Dutra, R. C. L., Thim, G. P., & Dibbern-Brunelli, D. (2010). Thermal curing of glass-epoxy prepregs by luminescence spectroscopy. Journal of Applied Polymer Science, 117(1), 664-671. http://dx.doi.org/10.1002/ app.31953.
16. Ferrari, V. C. G. M., Lourenço, V. L., Dutra, R. C. L., Diniz, M. F., Azevedo, M. F. P., & David, L. H. (2012). caracterização de um pré-impregnado aeronáutico por FT-IR e análise térmica.
Polímeros: Ciência e Tecnologia, 22(4), 369-377. http://dx.doi. org/10.1590/S0104-14282012005000048.
17. Pardini, L. C., & Peres, R. J. C. (1996). Tecnologia de fabricação de pré-impregnados para compósitos estruturais utilizados na indústria aeronáutica.Polímeros: Ciência e Tecnologia,
6(2), 32-42. Retrieved in 2015, June 25, from http://www.
revistapolimeros.org.br/PDF/v6n2/v6n2a02.pdf
18. Hexcel. (2017). Prepreg technology. Stamford: Hexcel. Retrieved in 2017, February 22, from https://www.ethz.ch/content/ dam/ethz/special-interest/mavt/design-materials-fabrication/ composite-materials-dam/Education/Manufacturing_of_ Polymer_Composites/FS2017/Prepreg_Technology.pdf 19. Smith, A. L. (1979). Applied infrared spectroscopy: fundamentals,
techniques, and analytical problem-solving. New York: John Wiley & Sons.
20. Graf, R. T., Koenig, J. L., & Ishida, H. (1987). Fourier transform infrared characterization of polymers. New York: Plenum Press.
spectroscopies. Spectrochimica Acta Part A: Molecular and Biomolecular Spectroscopy, 124, 308-314. http://dx.doi. org/10.1016/j.saa.2014.01.017.
22. Noureddine, A., Hequet, E., Turner, C., & Sari-Sarraf, H. (2005). FTIR analysis of crosslinked cotton fabric using a ZnSe–universal attenuated total reflectance. Journal of Applied Polymer Science, 96(2), 392-399. http://dx.doi.org/10.1002/ app.21449.
23. Hawley, G. G. (1981). The condensed chemical dictionary
(10th ed.). New York: Van Nostrand Reinhold Company.
24. Salzer, R., Junior, W., & Weyer, L. (2008). Practical guide to interpretive near-infrared spectroscopy. Angewandte Chemie International Edition, 47(25), 4628-4629. http://dx.doi. org/10.1002/anie.200885575.
25. Urbanski, J., Czerwinski, W., Janicka, K., Majewska, F., & Zowall, H. (1977). Uncured epoxy resin: handbook of analysis of sinthetic polymers and plastics. New York: John Wiley & Sons.
26. Hummel, D. O., & School, F. (1981). Spectra and methods of identification: atlas of polymer and plastics analysis (Vol. 3). Deerfield Beach: Dr. Hans F. Ebel.
27. Henry, L. H., & Neville, K. (1967). Handbook of epoxy resins. New York: McGraw-Hill.
![Figure 6 shows also the reference spectrum for an amine-sulfur curing accelerator [26]](https://thumb-eu.123doks.com/thumbv2/123dok_br/18870085.419852/6.765.122.583.720.1009/figure-shows-reference-spectrum-amine-sulfur-curing-accelerator.webp)