A
R
T
I
G
O
T
É
C
N
I
C
O
C
I
E
N
T
Í
F
I
C
O
in Epoxy Resins with TG/FT-IR Technique
Benedita M. V. Romão
Instituto Tecnológico da Aeronáutica, CTA
Milton F. Diniz, Margarete F. P. Azevedo, Vera L. Lourenço, Luiz C. Pardini, Rita C.L. Dutra Instituto de Aeronáutica e Espaço, CTA
Fabrice Burel
Institut National des Sciences Appliquées de Rouen, France
Abstract: Samples of epoxy resin (EP) based on the diglycidyl ether of bisphenol A (DGEBA), cured with nadic methyl anhydride (NMA) and mercaptan (CAPCURE 3-800), or amine-phenol (CAPCURE EH-30), respectively, SE 4 and SE 5, were prepared in the stoichiometric ratio determined by the supplier. The curing behaviour of the epoxy systems SE 4 and SE 5 was followed by DSC (Differential Scanning Calorimetry). These SE and their ingredients were analyzed using FT-IR transmission techniques (KBr pellets, pyrolysis without control and controlled pyrolysis-FT-IR, the CONTROLPIR/ FT-IR) for characterizing the curing agents (CA). The temperature range used for samples pyrolysis was found from TG (thermogravimetry). Thus, the FT-IR bands of liquid pyrolysate obtained by CONTROLPIR/FT-IR were evaluated, in comparison to the reference spectrum of CA. The characterization of CA was also possible, by the analysis of such SE with the TG/FT-IR technique.
Keywords: Epoxy resins, curing agents, TG/FT-IR technique, controlled pyrolysis-FT-IR.
Corresponding author: Rita C. L. Dutra, Instituto de Aeronáutica e Espaço, Centro Técnico Aeroespacial, Praça MarechalEduardo Gomes 50, CEP: 12228-904, S. José dos Campos, SP. E-mail: jrdutra@directnet.com.br
Introduction
The use of several materials in aerospace industry composites stimulates the development of new method-ologies that establish the relationship structure/property, an important factor for the suitable application of these composites in aerospace researches, as those developed in our laboratories in Brazil[1,2]. Epoxy systems are used as matrix in aerospace composites and properties of their formulations such as CA type and the EP/CA stoichiometric ratio have influence over mechanical properties of the composite[3-5]. The identification of the types of CA is important to get the suitable properties. Sugita et al.[6] showed that carbonylic CA are more easily identified because in the analysis by FT-IR pellet technique of sample as received the presence of C=O ester group resulting of the curing reaction of epoxy ring with anhydride can be observed. However, for the identification of CA structure more complex methodologies with several steps were needed. We developed in CTA laboratories in Brazil an analytical method based on FT-IR for the separation and characterization of anhydride and amide-amine CA used in epoxy systems with a simple methodology, controled pyrolysis FT-IR (CONTROLPIR/FT-IR), that analyse the liquid product resulting from the sample decomposition at
a defined temperature[1]. It is interesting to point out that this method is also applicable even with composites, where the presence of others compounds add some difficulties.
The aim of this previous work[1] was to ensure that the methodology CONTROLPIR/FT-IR and TG/FT-IRcoupled analysis, in comparison to usual FT-IR techniques, present the advantage of separate and identify the curing agent in these epoxy systems, in suitable conditions. This permits its characterization, even if the organic function has not been evidenced in the analysis of cured sample without further sample treatment.
The methodologie of TG/FT-IR was successfully applied to study DGEBA systems with mercaptan (SH), SH in the presence of polyamine amide, and polyamine modified compounds as CA[8].
Now, in this article, are described the results of the technique CONTROLPIR/FT-IR for liquid pyrolysis products of DGEBA epoxy and two others differents CA and the results of the TG/FT-IR technique for the gaseous pyrolysis products. The last results were obtained by researchers of INSA (France), which are collaborating in this study.
Experimental
GENEPOXY 190 and NMA, CAPCURE 3-800 and CAPCURE EH-30 were kindly supplied by Cognis S.A, and EPON 828 by Shell. The Figure 1 shows the chemical structures of compounds used in this work. DSC analyses were carried out in a DSC-910/TA2100 TA Instruments analyser. Mixtures SE 4 (EPON/NMA/CAPCURE 3-800 (1:1:0.2)) and SE 5 (EP190/CAPCURE EH-30 (100:10)) were prepared, mixed and analysed imediately by DSC, in hermetic aluminum pans, under nitrogen (<5 ppm H2O, 50 ml/min) at 10 °C/min, from room temperature to the end the of the cure exotherm (350 °C and 300 °C, respectively), to define the cure cycle. Mixtures freshly prepared were cured in a stove at 110 °C/ 1 h + 150 °C/2 h + 190 °C/ 1 h (SE 4) or 50 °C/ 1 h + 70 °C/1 h + 100 °C/ 1 h. (SE 5). TG analyses were carried out in a TGA-951/TA2100 TA Instruments analyser. The samples EP, CA e SE (~20 mg) were analysed in a platinum pan, under synthetic air (<5 ppm H2O, 50 ml/min) at 10 °C/min from room temperature to 700 °C. The results represent the average of duplicates for each sample. FT-IR analyses were performed with a 2000 Spectrum PerkinElmer spectrometer (resolution 4 cm-1, gain 1, 4000 to 400 cm-1, 40 scans). The samples of EP cured (SE 4 and SE 5) were analysed by potassium bromide (KBr) technique (1:400 mg) and also pyrolysed without control and the
condensed phase was analysed as liquid f ilm. In the CONTROLPIR/FT-IR methodology, 0.5 g of SE samples was pyrolysed at the apparatus of pyrolyse SPECTRA-TECH PY-2 (SE 4: 400 °C/ 10 min; SE 5: 450 °C/10min) by using the suitable support for collecting the condensed phase, that was analysed as liquid films.. TG/FT-IR analyses were carried out in a TG7/FT-IR SPECTRUM 2000 PerkinElmer, in a platinum pan under synthetic air (50ml/min), at 10 and 40 °C/min from 150 °C to 700 °C. Two aliquots were analysed for each sample. The identification of gaseous products was performed on line by coupled FT-IR.
Results and Discussion
FT FT FT FT
FT-IR analyses of EP and CA-IR analyses of EP and CA-IR analyses of EP and CA-IR analyses of EP and CA-IR analyses of EP and CA
The main IR bands of epoxy resins are in 3504 cm-1 (ν OH), 1247 cm-1 (ν aromatic C-O), 1035 cm-1 (ν aromatic C-O), 915 cm-1 (ν epoxy group). Characteristics bands of NMA are at 1857 and 1780 cm-1 (ν C=O), 1227, 1083 and 914 cm-1 (ν C-O)[10]. The intensity of bands at 1857 and 1780 cm-1, weak and strong, respectively, is characteristic of cyclic, five-membered ring, nonconjugated anhydride, and this is also used for characterization of this compound in the SE 4. Characteristics bands of CAPCURE 3-800 are at 2559 cm-1 (ν SH), 1416 and 1299 cm-1 (δ
a CH3 S) and 1106 cm-1 (ν C-O), and for CAPCURE EH 30 are at 1612 cm-1 (ν Ar C-C), 1280 cm-1 (ν C-N), 1258 cm-1 (ν phenolic C-O), 888 to 754 cm-1 (δ Ar C-H).
D S D S D S D S
D SC analyses of EP/CA mixturC analyses of EP/CA mixturC analyses of EP/CA mixturC analyses of EP/CA mixturC analyses of EP/CA mixture se se se se s
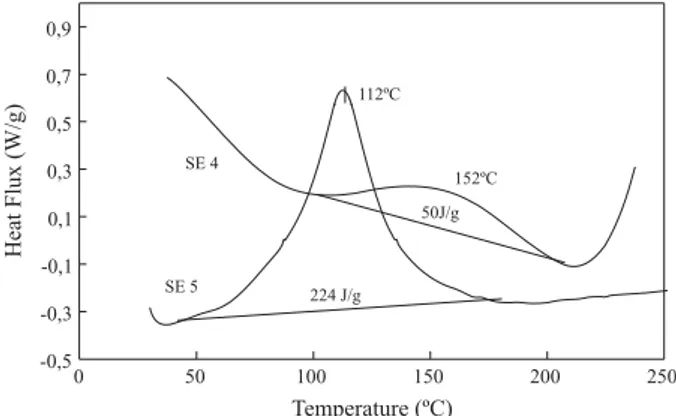
The DSC curves (Figure 2) showed one exothermic peak between 110 °C and 190 °C, with maximum at 152 °C for SE 4 mixture, and one between 30 °C and 180 °C with maximum temperature at 112 °C for SE 5 mixture, indicating the cure of the epoxy system. The DSC curves were used to design the temperature program for the cure process of the molded epoxy systems.
TG analyses of EP TG analyses of EP TG analyses of EP TG analyses of EP
TG analyses of EP, CA e SE, CA e SE, CA e SE, CA e SE, CA e SE
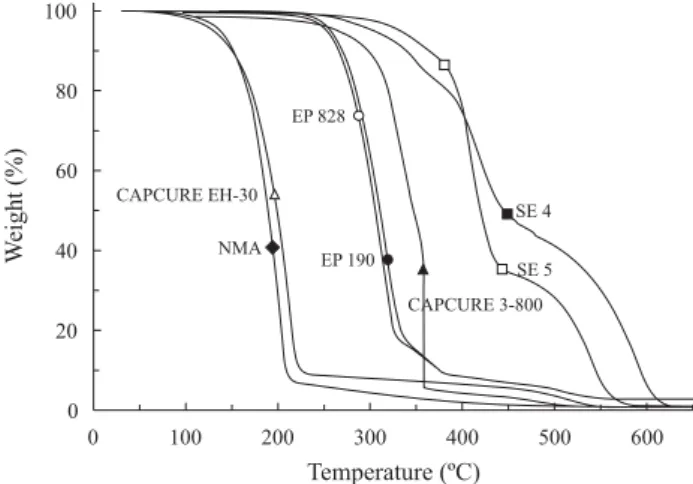
TG curves of SE and its ingredients are shown at Figure 3 and Table 1 contains the interval of temperature (∆T) where mass loss (∆m) was observed, averaged values of duplicates.
Epon 828 and Genepoxy 190 resins showed the same TG profile. The residue at the end of heating was less than 1% for all samples, except for the resins. CAPCURE 3-800 exhibited a fast weight loss after 320 °C, and the curve time/temperature (not showed here) had a peak, revealing that it was very exothermic. The TG curves of SE samples were different from expected by overlapping the curves of pure compounds what does not allow to presume which is being evoluted in each region. The derivative thermogravimetric curve (DTG) is proportional to decomposition rate and the maximum peak temperature indicates where the decomposition is faster. This temperature is presented in Table 1 for the steps where the weight loss was above 10% and was used to estimate the temperature range to be used in the techniques CONTROL-PIR or TG/FT-IR.
FT FTFT
FTFT-IR (CONTROL-IR (CONTROL-IR (CONTROL-IR (CONTROL-IR (CONTROL-PIR) analyses of SE-PIR) analyses of SE-PIR) analyses of SE-PIR) analyses of SE-PIR) analyses of SE
DTG data for SE (Table 1) show DTG peaks in the region 350 and 550 ºC, that were used to establish the temperature
for the analysis CONTROL-PIR and 10 min was suitable to produce enough quantity of pyrolysate for analysis.
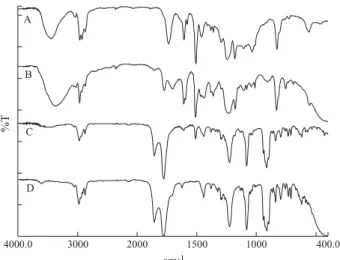
Figure 4 shows spectra of SE 4, obtained by KBr pellet technique (A), pyrolysis without control (B) and controled to 400 °C/10min (C). The pellet technique (A) shows that the resin is cured due the lack of band at 917 cm-1 assigned to terminal epoxy group, that is the main difference between the spectra of epoxy cured or not. The ester carbonyl band suggests that the resin is cured with anhydride, but the other bands of this anhydride, 1227 cm-1, 1083 cm-1 and 914 cm-1 (ν C-O) are not observed. The pyrolysis without control (B) still shows the epoxy resin bands between 1300 cm-1 and 930 cm-1 (ν COC, ring bands). The CONTROLPIR/FT-IR technique (C) is suitable for identification of NMA, due to bands at 1857 cm-1 (ν C=O), 1780 cm-1 (ν C=O), 1227 cm-1, 1083 cm-1 e 914 cm-1 (ν C-O). Thus, the CONTROLPIR/ FT-IR technique shows the advantage in relation to others conventional IR due to it be able to separate the curing agent, allowing its characterization, avoiding complex steps for sample preparation. The observation of NMA bands only is considered normal, because it is in higher proportion than CAPCURE 3-800 in the epoxy system.
The same methodology was used for the analysis of SE 5 and the spectra obtained at 450 °C are presented in Figure 5. KBr pellet technique spectra (A) of system cured not allowed to identify the CA, cause only epoxy bands are seen. However, in the C spectrum, it is possible to observe bands of CAPCURE EH-30 in the finger-print region, but as expected, some bands are in same wave numbers of decomposition products of resin (B spectrum) due the C-O and aromatic groups, although they were sharper in the C spectrum.
It is possible to observe by Figures 4 and 5 that the spectra of pyrolysates obtained by CONTROL-PIR/FT-IR for SE 4 and SE 5 are differents and allow the characterization of CA Figure 3. TG curves of SE 4, SE 5 and its ingredients (air, 10 °C/min)
e l p m a
S ∆∆∆∆∆T ) C ° ( ∆ ∆ ∆ ∆∆m
) % ( ∆ ∆ ∆ ∆ ∆T ) C ° ( ∆ ∆ ∆ ∆∆m
) % ( ∆ ∆ ∆ ∆ ∆T ) C ° ( ∆ ∆ ∆ ∆∆m
) % ( ∆ ∆ ∆ ∆ ∆T ) C ° ( ∆ ∆ ∆ ∆∆m
) % ( N I S E
R a — 200-346 (85) 346-420 (8) 420-600 (4)
0 4
3 b
A M
N 50-250 (94) 250-500 (5) — —
0 2 2 b 0 0 8 -3 E R U C P A
C 26-206 (2) 206-370 (93) 370-600 (4) —
0 2 3 b,c
4 E
S 28-200 (0.6) 200-373 (18) 373-477 (36) 477-671d (44)
0 5
3 b 425b 590b
0 3 -H E E R U C P A
C 27-300 (92) 300-660 (7) — —
0 2
2 b
5 E
S 24-200 (0.6) 200-448 (68) 448-695 (30) —
0 0
4 b 550b
Table 1. TG results of EP, CA e SE
in the epoxy systems. Thus, we can conclude that CONTROL-PIR/FT-IR methodology, developed in our laboratories, is suitable for the study of CA of epoxy systems based on anhydride, pure or in presence of small quantity of mercaptan, amine-phenol, in specific conditions, as was possible for mercaptan pure or in the presence of polyamine amide and polyamine[8].
TG/FT TG/FT TG/FT TG/FT
TG/FT-IR analysis of EP and CA-IR analysis of EP and CA-IR analysis of EP and CA-IR analysis of EP and CA-IR analysis of EP and CA
The Figure 6 shows the FT-IR spectra of decomposition products of EP and CA used in this work. It can be observed that the spectra show differences in some characteristics regions, suggesting that bands of decomposition products of resin will not influence in a significant way the character-ization of CA in the epoxy systems.
The main bands of decomposition products of EP are at 3015 cm-1, 1731 cm-1 and 1018 cm-1, probably assigned[10], to C-H groups aromatic, C=O and C-O (aromatic ether), respectively, in according to decomposition process established for epoxy resins and epoxy system by Dyakonov[11]. The main Figure 4. FT-IR spectra of SE 4 by techniques:A) KBr pellets 1:400mg; B) pyrolysis without control; C) CONTROLPIR/FT-IR 400 °C/10 min; D) curing agent NMA (liquid film).
Figure 5. FT-IR spectra of SE 5:A) KBr pellets 1:400mg; B) pyrolysis without control; C) CONTROLPIR/FT-IR 450 °C/10 min; D) curing agent CAPCURE EH-30 (liquid film)
absorptions[12] of decomposition products of CAPCURE 3-800, are at 3566 cm-1 (H
2O), 2978 cm-1 and 2937 cm-1 (C-H), 2355 cm-1 (CO
2), 1732 cm-1 (C=O) and 1110 cm-1 (C-O). The main absorptions[6,11] of decomposition products of CAPCURE EH 30 are at: 2951, 2821 and 2778 cm-1 (C-H), 1257cm-1 (C≡N), and 837 cm-1 (NH
2).
TG/FT TG/FT TG/FT TG/FT
TG/FT-IR analysis of SE-IR analysis of SE-IR analysis of SE-IR analysis of SE-IR analysis of SE
The Figure 7 shows that it is possible to identify NMA in SE 4 by absorption at 1800 cm-1 (C=O). It is interesting to Figure 6. FT-IR spectra of decomposition products of: A) EP, B) CAPCURE 3-800, C) CAPCURE EH-30.
Figure 7. FT-IR spectra of decomposition products of A) Capcure 3-800, B) SE 4.
observe that is also possible identify the presence of CAPCURE 3-800, by others bands assigned in this Figure, besides of his low content in this system, probably because its bands are strong . The Figure 8, as observed for the SE 4, shows that is possible to identify the curing agent CAPCURE EH-30 in the epoxy system SE 5.
Conclusions
It was possible by CONTROLPIR/FT-IR methodology developed in our laboratory, identify curing agents used in epoxy resin DGEBA, based on anhydride, pure or in the presence of small quantity of mercaptan, amine-phenol, in specific conditions and suggest that by suitable conditions, it can evaluated for the investigation of others kinds of curing agents. TG/FT-IR technique allows to identify the differents CA independent of its low content in the epoxy systems as at SE 4.
References
1. Romão, B. M. V.; Dutra, R. C. L.; Diniz, M. F. & Ribeiro A. P. - Pesquisa Naval 14; p.273 (2001).
2. Sciamareli, J.; Holanda, J. A. S.; Dutra, R. C. L.; Lourenço, V. L. & Iha, K. - Anais Assoc. Bras. Quim. 51, 3;83 (2002).
3. Jiawu, G. K. & Mong, G. Z. - Termochimica Acta 352:153 (2000).
4. Sugita, T. & Ito M. - Bull Chem Soc Japan 38,10:1620, (1965).
5. Herrera, M.; Matuschek, G. & Kettrup, A. - Thermochim. Acta 361:69 (2000).
6. May, C. A.; Hadad, D. K. & Browning, C. E. - Polym. Eng. Sci. 19, 8:545 (1979).
7. Varley, R. J.; Hawthorne, D. G.; Hodghin, J. H. & Simon, G. P. - Polymer 36, 7:1347 (1995).
8. Romão, B. M. V.; Dutra, R. C. L.; Diniz, M. F.; Azevedo, M. F. P.; Lourenço, V. L.; Pardini, L. C. & Burel, F. -Polímeros: Ciência e Tecnologia, 13, p.173-180 (2003).
9. Urbanski, J.; Czerwinski, W.; Janicka, K.; Majewska, F. & Zowall, H. - Handbook of analysis of synthetic polymers and plastics, John Wiley, New York (1977).
10. Smith, A. L. - Applied Infrared Spectroscopy. John Wiley, New York (1979).
11. Dyakonov, T.; Patrick, J.; Mann, Y.; Chen, & Stevenson, W. T. K. - Polymer Degradation and Stability 54:67 (1996).
12. Reggers, G.; Ruysen, M.; Carleer, R. & Mullens J. -Thermochim. Acta 295:107 (1997).