www.jped.com.br
ORIGINAL
ARTICLE
Nutritional
evaluation
of
children
with
chronic
cholestatic
disease
夽
Francislaine
Veiga
da
Silva
a,b,
Priscila
Menezes
Ferri
b,c,
Thaís
Costa
Nascentes
Queiroz
b,d,
Pamela
de
Souza
Haueisen
Barbosa
e,
Maria
Cristina
Cassiano
de
Oliveira
f,
Laura
Jácome
de
Melo
Pereira
d,
Ana
Cristina
Simões
e
Silva
c,g,
Francisco
José
Penna
b,c,
Eleonora
Druve
Tavares
Fagundes
b,c,
Alexandre
Rodrigues
Ferreira
b,c,∗aGroupofPediatricHepatologyandGastroenterology,HospitaldasClínicas,UniversidadeFederaldeMinasGerais(UFMG),Belo
Horizonte,MG,Brazil
bPediatricGastroenterologyGroup,SchoolofMedicine,HospitaldasClínicas,UniversidadeFederaldeMinasGerais(UFMG),
BeloHorizonte,MG,Brazil
cDepartmentofPediatrics,SchoolofMedicine,UniversidadeFederaldeMinasGerais(UFMG),BeloHorizonte,MG,Brazil dMedicalPediatricGastroenterologist,Brazil
eSchoolofMedicine,UniversidadeFederaldeMinasGerais(UFMG),BeloHorizonte,MG,Brazil fHospitaldasClínicas,UniversidadeFederaldeMinasGerais(UFMG),BeloHorizonte,MG,Brazil
gInterdisciplinaryLaboratoryofMedicalInvestigation,UniversidadeFederaldeMinasGerais(UFMG),BeloHorizonte,MG,Brazil
Received6April2015;accepted13July2015 Availableonline26November2015
KEYWORDS
Neonatalcholestasis; Nutrition;
Chronicliverdisease; Anthropometry
Abstract
Objective: Toevaluate thenutritional statusofchildrenwith persistentcholestasis andto compare the anthropometricindices betweenchildren withand withoutliver cirrhosis and childrenwithandwithoutjaundice.
Methods: Childrenwith persistentcholestasis, i.e.increaseddirect bilirrubinorchanges in thecanalicularenzymegamma-glutamyltransferase(GGT),wereincluded.The anthropomet-ricmeasureswereweight(W),heightorlength(H),armcircumference(AC),tricepsskinfold thickness(TST),armmusclecircumference(AMC),andbodymassindex(BMI).
Results: Ninety-one childrenwith cholestasis,with currentmedianageof12 months,were evaluated. W/age (A)and H/A indicesbelow −2Z-scoreswere observed in33% and30.8% ofpatients,respectively.Concerning theW/HindexandBMI,only12%and16%ofpatients, respectively,werebelow−2Z-scores.RegardingAC,43.8%of89evaluatedpatientshadsome depletion.ObservingtheTST,64%ofpatientshaddepletion,and71.1%ofthe45evaluated patientshadsomedegreeofdepletionregardingtheACMindex.
夽
Pleasecitethisarticleas:SilvaFV,FerriPM,QueirozTC,BarbosaPS,OliveiraMC,PereiraLJ,etal.Nutritionalevaluationofchildren withchroniccholestaticdisease.JPediatr(RioJ).2016;92:197---205.
∗Correspondingauthor.
E-mails:[email protected](P.M.Ferri),[email protected](A.R.Ferreira).
http://dx.doi.org/10.1016/j.jped.2015.07.006
Conclusion: Evaluationusingweightinpatientswithchronicliverdiseasesmayoverestimate thenutritionalstatusduetovisceromegaly,subclinicaledema,orascites.Indicesthatcorrelate weightandheight,suchasW/HandBMI,mayalsonotshowdepletionbecauseofthechronic conditioninwhichtherearedepletionofbothweightandheight.TST,AC,andACMare param-etersthatbetterestimatenutritionalstatusandshouldbepartofthemanagementofpatients withliverdiseasesandcholestasis.
©2015SociedadeBrasileiradePediatria.PublishedbyElsevierEditoraLtda.Allrightsreserved.
PALAVRAS-CHAVE
Colestaseneonatal; Nutric¸ão;
Doenc¸ahepática crônica;
Antropometria
Avaliac¸ãonutricionaldecrianc¸ascomcolestasecrônica
Resumo
Objetivo: Avaliarasituac¸ãonutricionaldecrianc¸ascomcolestasepersistenteecompararos índices antropométricosentre crianc¸as com e sem cirrosehepática e crianc¸as come sem icterícia.
Métodos: Foram incluídas crianc¸as comcolestase persistente, ouseja, aumento da bilirru-binadiretaoualterac¸ões naenzimacanalicular, gamaglutamiltransferase(GGT).Asmedidas antropométricasforampeso(P),estaturaoualtura(A),circunferênciadobrac¸o(CB),espessura dapregacutâneadotríceps(TST),circunferênciamusculardobrac¸o(CMB)eíndicedemassa corporal(IMC).
Resultados: Foramavaliadasnoventaeumacrianc¸ascomcolestase,comidademédiade12 meses. 33% e30,8% dos pacientes apresentaram índicesP/I e A/Icom escoreZ abaixo de -2, respectivamente.Com relac¸ãoao índice P/Ae IMC,somente 12% e16% dos pacientes, respectivamente,apresentaramescoreZabaixode-2.Comrelac¸ãoàCB,43,8%de89pacientes avaliadosapresentaramalgumadeplec¸ão.ObservandoaTST,64%dospacientesapresentaram deplec¸ão,e71,1%dos45pacientesavaliadosapresentaramalgumgraudedeplec¸ãocomrelac¸ão aoíndicedeCMB.
Conclusão: Aavaliac¸ãodopesoempacientescomdoenc¸ashepáticascrônicaspoderá super-estimarasituac¸ãonutricionaldevidoavisceromegalia,edemasubclínicoouascite.Osíndices quecorrelacionampesoealtura,comoP/AeIMC,tambémpodemnãomostrardeplec¸ão de-vidoàdoenc¸acrônicaemquehádeplec¸ãotantodopesoquantodaaltura.ATST,BCeCMB sãoparâmetrosqueestimammelhorasituac¸ãonutricionaledevemfazerpartedomanejode pacientescomdoenc¸ashepáticasecolestase.
©2015SociedadeBrasileiradePediatria.PublicadoporElsevierEditoraLtda.Todososdireitos reservados.
Introduction
Cholestasis is a common manifestation of liver disease in children, which occurs in approximately 65% of these patients.Itistheimpairmentofbileflowduetobiliarytract obstructionorimpairmentofbileaciduptake,conjugation, orexcretion.1,2Cholestasisimpairsthenutritionalstatusof
thesechildren.3 Malnutrition leads toincreasedmorbidity
andmortalityinpatientswithchronicliverdisease.Barches
et al.4 reported that malnutrition in the pre-transplant
periodis associated with longer hospitalstay and
spend-ing.Besides,Moukarzeletal.5showedanarrowcorrelation
betweennutritionalstatusandoutcomesoflivertransplant
inchildren. Inthatstudy,children withZ-scorebelow −2
standarddeviations had ahigherincidenceof infectionin
thepost-transplantperiod,moresurgicalcomplications,and
highermortality.
Approximately60%ofchildrenwithchronicliverdisease
areundertheexpectedweightandheightfortheirage.6,7
An appropriatenutritional support couldprevent thefast
progression of the underlying disease, with improvement
oftheimmunefunction.6,8,9Nutritionalevaluationofthese
childrenisessential,buttheweightcanbeoverestimated
in casesof visceromegaly,ascites, and peripheraledema;
therefore, when considered separately, this evaluation is
not a good parameter to identify malnutrition. The most
sensitive measures todetermine the nutritional status in
chronic liver disease arearm circumference (AC) and
tri-cepsskinfold(TST).10 Ameticulousphysical exam,several
physicalanthropometricmeasures,andindividualized
com-plementary tests are indispensable. Because malnutrition
isaconsequence ofchroniccholestasis,knowledgeonthe
impactofthisconditionincommittedchildrenmayhelpin
recommendingearlynutritionalintervention.
Thisstudyaimedtoevaluatethenutritionalstatusof
chil-dren diagnosed with cholestasis followed at the Pediatric
HepatologyUnitofthisinstitutionandtocorrelatethefood
intakewithnutritionalstatus.Inaddition,anthropometric
indiceswerecomparedbetweenpatientswithandwithout
livercirrhosisandchildrenwithandwithoutjaundice.
Patients
and
methods
2009 to December of 2013. Children with clinical and/or laboratorypersistent cholestasiswereincluded.Persistent cholestasiswasdefinedasincreaseddirectbilirubin(direct bilirubin of more than 20% of the total bilirubin or more than2mg/dL,whenthelevelsarehigherthan5mg/dL;or directbilirubingreaterthan1mg/dLwhentotalbilirubinis lessthan5mg/dL)ortheraiseofthecanalicularenzyme, gamma-glutamyl transferase (GGT), above the reference valuefor age.11 Allpatients underwentliverbiopsy,which
wasindicatedonthepatientinitialevaluationfor
differen-tialdiagnosisofcholestasisand/orduringthecourseofthe
diseaseformonitoringhistopathologicalfindings.
ThestudywasapprovedbytheEthicsCommitteeofthe
institution(protocolnumberETIC310/08).
Anthropometric measures collected were weight (W),
lengthorheight(H),armcircumference(AC),triceps
skin-foldthickness(TST),armmusclecircumference(AMC),and
bodymassindex(BMI).Theanalyzedvariableswere:gender,
ageinmonthsatthetimeofclinicalevaluation,
classifica-tion ashaving cirrhosis or not (based on histopathology),
classificationofcirrhosis bytheChild---Pughcriteria,
labo-ratorytests(albuminandbilirubin),andthecaloricintake
throughthe72-hfoodrecord.Clinicalandlaboratory data
wereobtainedat thesametimeof nutritionalevaluation,
i.e.,inasinglemoment.Foodintakewasrecordedfor72h
afternutritionalevaluation.
Children younger than 2 years and weighing up to
16kg were measured in horizontal anthropometer
(Pedi-atric AnthropometricRuler; NutriVida®,São Paulo, Brazil)
andweighed, without clothesor diaper, onan electronic,
digital,andcalibratedscale(DigitalInfantScale;Welmy®,
São Paulo, Brazil). The vertical stadiometer (Vertical
sta-diometer; Physical Nutrivida®, São Paulo, Brazil) and an
electronic,digital, and calibrated platform (DigitalScale;
Balmak®,SãoPaulo,Brazil)wereusedtomeasurechildren
olderthan2years.Patientswereevaluatedbarefootand,
usually,onlywithunderwear.The equipmentwaschecked
beforeuse.Thesemeasureswereclassifiedthroughthe2008
SISVAN(FoodandNutritionSurveillanceSystems)12protocol
per life phase, adapted from the World Health
Organiza-tion(WHO)13;thecutoffpointsusedhadtheWHOchartsas
referenceandwerecalculatedbytheWHOAnthro,version
3.2.2.14
An inelastic tape was used tomeasure the AC, and a
plicometer was used for the measurement of TST. These
parameters werecalculated and classified based onWHO
standardsaccordingtoageandheight.15Themeasureswere
performedontheright sideofthechild.Patientsyounger
than 2 years were evaluatedin standingposition, on the
lapofthemotherorguardian.ACwasmeasuredatmidway
betweentheacromionandtheinferiorborderofthe
olecra-non.TSTwasmeasuredatthesamepositionofAC,i.e.,the
posteriorfaceofthearm.Themeasurementwascarriedout
followinglongitudinalaxisofthelimb.Threemeasureswere
performedatthesameposition,withadifferenceofthree
seconds betweeneach other, andthe meanof the values
wascalculatedtoavoidpossibleerrors,asrecommendedby
theliterature.12
Patients were classified based on WHO Anthro14
cal-culation by using the following values: severe depletion
(less than 70%), moderate depletion (between 70% and
80%), mild depletion (between 80% and 90%), eutrophy
(between 90% and 110%), overweight (between 110%
and 120%), and obesity (more than 120%). The
for-mulas for these calculations were: adequacy of AC
(%)=[obtained AC (cm)/AC50 percentile]×100; adequacy
of TST (%)=[obtained TST (cm)/TST 50 percentile]×100;
andAMC(cm)=AC(cm)−3.14×TST(cm).
AMCvalues,accordingtogenderandage,werecompared
with reference values of the National Health and
Nutri-tionExaminationSurvey(NHANES),expressedinpercentile
tablesbyFrisancho,startingfrom1yearofage.16 Patients
youngerthan1yearwereexcludedfromthisanalysisdueto
thelackofreferencevaluesforthisagegroup.
After clinical evaluation, the caregiver of the child
reportedall foodingestedbythechild forthree
consecu-tivedays.Thenumberofdays,time,kind, andamountof
foodingestedbythechildwereinformed.Forchildrenwho
wereexclusivelybreast-fed,themothertooknoteof
breast-feeding time to estimate, according to age and suckling
time,thevolumeofmilkingestedbytheinfant.
Thecalculationofcalorie-proteinintakewascarriedout
bythesoftwareDietProversion4.0(AgromídiaSoftwares®,
Minas Gerais, Brazil),17 as well as the Food
Composi-tionTable18 andthehomemeasurestable,19 includingthe
macronutrientscarbohydrates, proteins, and lipids.Then,
the daily recommendations of calories were calculated
accordingtoage bythe FAO/WHO/UN 1985report,based
oncaloriesrequirementfortotalenergyconsumptionplus
growthofbreast-fedchildren.20
DatawereanalyzedbythesoftwareEpiInfoversion6.04
(CentersforDiseaseControlandPrevention,Atlanta,USA).
Continuous variables with non-Gaussian distribution were
shown as mediansand interquartile range (IQ 25th---75th)
andcomparedwiththenonparametricKruskal---Wallistest.
Thedistributionofdichotomousvariableswascomparedby
thechi-squared test, withYates correction,or two-tailed
Fisher’sexacttest,ifnecessary.Theprobabilitywas
consid-eredsignificantwhenp<0.05.
Results
Ninety-onechildrenwithinitialdiagnosisofcholestasiswere evaluated.Themedianagewas12months,and52.7%were male. The etiologies of cholestasis were: biliary atresia in31 patients (34.1%),idiopathic neonatalhepatitisin 25 (27.5%),multifactorialcholestasis in eight(8.8%),Alagille syndromeineight(8.8%),deficiencyofalpha-1-antitrypsin in six (6.6%),hypoplasia of bileducts in four(4.4%), and otherdiagnosesinsixpatients(6.6%).Twenty-fivepatients (27.5%)showedcirrhosisonthehistopathologicalexam(18 withbiliaryatresiaandsevenwithidiopathicneonatal hep-atitis); 11 patients were classified as Child---Pugh class A (44%),12asclassB(48%),andtwoasclassC(8%).Seventy patients(76.9%) hadjaundicewithabnormally high levels ofbilirubin,GGT,andaminotransferase,while 21children (23.1%)hadnormallevelsofbilirubin,withoutjaundice,but withincreasedlevelsofGGT.
Clinical,laboratory,nutritional,andanthropometricdata of the patients areshown in Tables 1 and2. The
follow-ingindexeswerecalculated:weight/age(W/A);height/age
index(H/A);weight/height(W/H);bodymassindex(BMI).
Table1 Clinical,laboratory,nutritional,andanthropometricdataofchildrendiagnosedasneonatalcholestasisingeneraland dividedaccordingtothepresenceofcirrhosis.
General(91children) Withcirrhosis (25children)
Withoutcirrhosis (66children)
Age(months)a 12[6.0to40.0] 11[5.0to38.5] 12[6to40.5]
Visceromegaly,n(%) 61(67%) 24(96%) 37(56.1%)
Splenomegaly,n(%) 42(46.2%) 21(84%) 21(31.8%)
Hepatomegaly,n(%) 57(62.6%) 22(88%) 35(53%)
Hepatosplenomegaly,n(%) 38(41.8%) 17(68%) 19(28.8%)
Ascites,n(%) 7(7.7%) 5(20%) 2(3%)
Albumin(g/dL) 4.1[3.8to4.5] 4[3.47to4.40] 4.2[3.8to4.5]
Z-scoreW/Aa −1.10[−2.40to0.36] −1.39[−2.72to0.12] −0.93[−2.2to0.54]
Z-scoreH/Aa −0.80[−2.30to−0.03] −1.6[−2.57to−0.62] −0.70[−2.4to0.30]
Z-scoreW/Ha −0.05[−1.30to0.80] −0.52[−1.85to0.76] −0.03[−1.23to0.86]
Z-scoreBMIa −0.24[−1.40to0.90] −0.52[−2.24to0.87] 0.03[−1.30to0.87]
Z-scoreTSTa −0.40[−1.70to0.80] −1.35[−2.65to0.30] −0.12[−1.43to1.00]
Dietaryrecorda 91.4%[79.0%to104.6%] 92.9%[72.9%to105.8%] 90.5%[80.8%to103.4%]
Dietaryrecord,n(%)
<60% 2(2.2%) 1(4%) 1(1.5%)
60%to<95% 50(55%) 13(52%) 37(56.1%)
95%to105% 17(18.7%) 4(16%) 13(19.7%)
105%to<140% 20(22%) 7(28.0%) 13(19.7%)
>140% 2(2.2%) 0(0.0%) 2(3.0%)
W/A,weight/ageindex;H/A,height/ageindex;W/H,weight/heightindex;BMI,bodymassindex;TST,tricepsskinfoldthickness. aForsomedata,medianandinterquartilerange(IQ25th---75th)wereused;fordietaryrecordthecalculationusedwas:(dietaryintake
record/recommendedforage)×100.
Table2 Clinical,laboratory,nutritional,andanthropometricdataofchildrendiagnosedasneonatalcholestasisingeneraland dividedaccordingtothepresenceofjaundice.
General(91children) Withjaundice (70children)
Withoutjaundice (21children)
Age(months)a 12[6.0to40.0] 10[5.0---34.25] 31[10---56.5]
Cirrhosis 25 22 3
Visceromegaly,n(%) 61(67%) 51(72.9%) 10(47.6%)
Splenomegaly,n(%) 42(46.2%) 37(52.9%) 05(23.8%)
Hepatomegaly,n(%) 57(62.6%) 48(68.6%) 09(42.9%)
Hepatosplenomegaly,n(%) 38(41.8%) 29(41.4%) 09(42.9%)
Ascites,n(%) 7(7.7%) 7(10%) 0(0%)
Totalbilirubin(md/dL) 2.1[0.5to5.68] 3.4[1.7to7.45] 0.5[0.25to0.7]
Directbilirubin(mg/dL) 1.4[0.2to3.3] 2.0[1.37to5.6] 0.2[0.1to0.32]
GGT(U/L) 495[244to587] 402[180to686.8] 234[180to554]
Albumin(g/dL) 4.1[3.8to4.5] 4.1[3.7to4.45] 4.2[4.0to4.6]
Z-scoreW/Aa −1.10[−2.40to0.36] −1.52[−2.5to−0.95] 0.36[−0.46to1.14]
Z-scoreH/Aa −0.80[−2.30to−003] −1.15[−2.53to−0.28] −0.12[−1.18to0.44]
Z-scoreW/Ha −0.05[−1.30to0.80] −0.71[−1.4to0.45] 0.83[0.02to1.3]
Z-scoreBMIa −0.24[−1.40to0.90] −0.52[−2.24to0.87] 0.87[0.11to1.13]
Z-scoreTSTa −0.40[−1.70to0.80] −0.71[−1.41to0.67] 0.15[−0.39to1.08]
Dietaryrecorda 91.4%[79.0%to104.6%] 89.9%[77.6%to105.6%] 93.14%[86.2%to100.8%]
Dietaryrecord,n(%)
<60% 2(2.2%) 1(1.4%) 1(4.8%)
60%to<95% 50(55%) 39(55.7%) 11(52.4%)
95%to105% 17(18.7%) 11(15.7%) 6(28.6%)
105%to140% 20(22%) 17(24.3%) 3(14.3%)
>140% 2(2.2%) 2(2.9%) 0(0%)
W/A,weight/ageindex;H/A,height/ageindex;W/H,weight/heightindex;BMI,bodymassindex;TST,tricepsskinfoldthickness. aForsomedata,medianandinterquartilerange(IQ25th---75th)wereused;fordietaryrecordthecalculationusedwas:(dietaryintake
interquartile range (IQ 25th---75th) were used. Dietary intake was calculated using the formula (dietary intake record/recommendedforage)×100.
Regarding nutritional intake, 57.2% of the 91 patients were below 95% of the recommended calories, with no statisticallysignificant differencebetweenthosewithand withoutcirrhosis (p=0.32)andbetweenchildrenwithand withoutjaundice(p=0.80).When comparingpatientswith ingestionbelow95%oftherecommendedwithpatientswith nutritionaldepletion,nostatisticallysignificantdifferences were observed on AC (p=0.14), TST (p=0.09), and AMC (p=0.09).
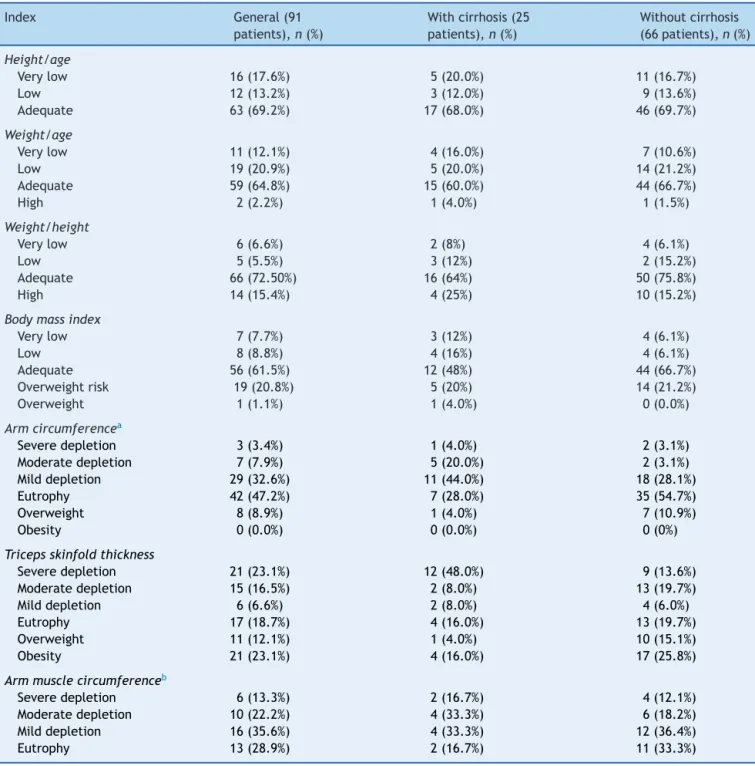
Table 3 presentsthe nutritionalclassification basedon
anthropometricindicesin theentire groupandinpatients
stratifiedaccordingtothepresenceofcirrhosis.Therewas
nostatisticallysignificantdifferencebetweenpatientswith
andwithoutcirrhosisfortheW/A(p=0.48),H/A(p=0.92),
W/H(p=0.28),andBMI(p=0.07)indices,aswellasforTST
and AMC (p=0.07 for TST; and 83.3% vs. 66.7%, p=0.24
for AMC). Regarding AC, there was a statistically
signifi-cantdifferencebetweenpatientswithandwithoutcirrhosis
(p=0.006).
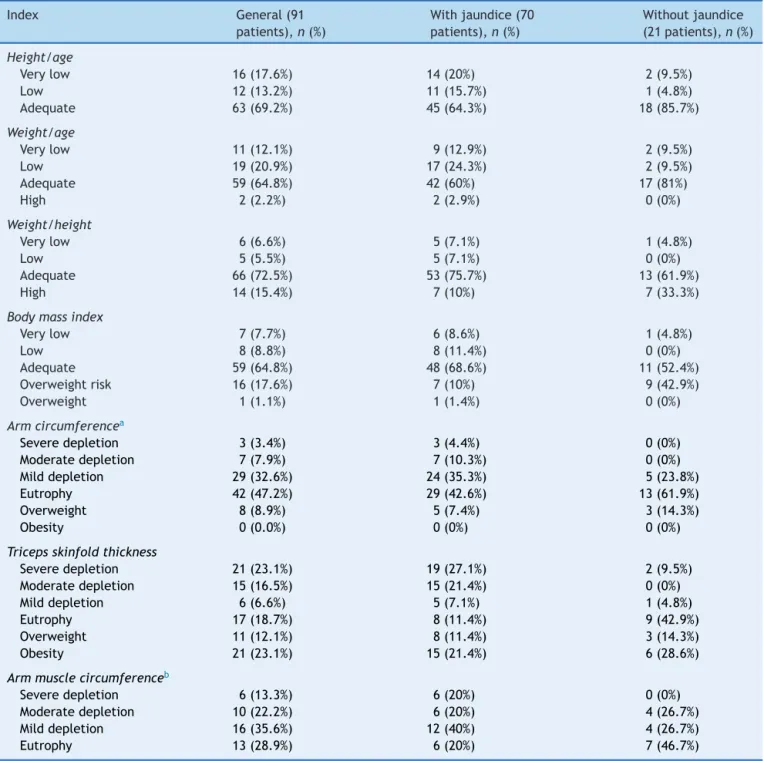
Table 4 shows the nutritional classification based on
anthropometricindicesin theentire groupandinpatients
stratifiedaccordingtothepresenceofjaundice.No
differ-enceswereobservedinthecomparisonbetweenthedataof
childrenwithandwithoutjaundiceforW/A(p=0.18),H/A
(p=0.92),W/H(p=0.45),BMI(p=0.07),andAMC(p=0.08).
Regarding the presence of any degree of depletion in AC
and TST, patients with jaundice had significantly higher
frequencyofdepletioninbothparametersthanthose
with-out jaundice(p=0.045 and p=0.001,respectively). When
comparingpatientswithnutritionaldepletion byTSTwith
those with low weight for height or age, a statistically
significant difference was observed for both parameters
(p=0.000).
RegardingtheevaluationofAC,39(43.8%)of89patients
hadsomedegree ofdepletion.Conversely,only11(12.3%)
of89patientshadlowW/H(p=0.001)andonly28(31.5%)
hadlowW/A(p=0.000).
Similarly,whenassessingAMC,32(71.1%)of45patients
hadsome degree of depletion, while only two(4.4%) had
lowW/H (p=0.000)and onlyseven(15.6%) of45patients
hadlowW/A(p=0.000).
Discussion
Nutritional evaluation of these children is essential, but it has several challenges. The presence of visceromegaly, ascites,andperipheraledemacanlimittheuseofweight, themost commonindexfornutritionalevaluation. There-fore,a meticulousphysical exam, several anthropometric measures,andindividualizedcomplementarytestsare indis-pensible for a reliable nutritional evaluation of these patients. TST and AC measures are more reliable, as theseparametersdonotconsidertheweightandcouldbe extremely important in clinical practice, allowing for an early diagnosis ofnutritional deficits.The estimate offat depositsthroughTSTandofproteincontentbyAMCandAC arecomplementarydatathat allowfor an accurate nutri-tionalevaluationofthesepatients.3,21,22
Inthepresentstudy,one-thirdofpatientsshowedW/A
andH/A indices under−2 Z-scores. Considering the W/H
index,only12.1%ofpatientshadZ-scorelowerthan−2;in
relationtotheBMI,thepercentagewas16.5%.This
demon-stratesthatW/Hshouldalwaysbeusedincombinationwith
H/A,sincetheproportionaldeficitsinweightandheightare
notidentifiedbythisfirstmethod.ItalsoshowsthatBMIis
notagoodmeasureofbodycompositioninthispopulation.
Similarly,inanotherBrazilianstudywith22childrenand
adolescentswithcholestasis, 23.8% and33.3% of patients
were malnourished according to W/A and H/A criteria,
respectively, andnone of them was under−2 Z-scores in
relationtoW/Hindex.23
NutritionalinadequacywashigherwhenAC,TST,andAMC
indiceswereused.RegardingAC,43.9%ofpatientshadsome
degreeofdepletion;TST,46.2%;andAMC,71.1%.Although
theW/AandH/Aindicesrevealedthatalmostone-thirdof
patientshadnutritionaldepletion,AC,TST,andAMC
indi-catedahigherfrequencyofmalnutrition.
AMCprobably showeda greater proportion of patients
withinadequate nutritional when compared with AC and
TST,duetotheageoftheevaluatedpatientsinthisstudy.
AMChadonlybeenreportedinpatientsolderthan1year,
i.e.,withalongertimeofevolutionofcholestaticdisease.
Schneider et al.24 reported in their study on children
withcirrhosisthattheindexthatbestreflectedthe
nutri-tionalriskwasTST,confirmingthatitcanmeasurethebody
fatmass,showingthelengthandseverityofmalnutrition.
Therefore,thismeasureisveryimportantinthenutritional
evaluationofthesepatients.Sokoletal.25 emphasizedthe
importanceofTSTandACmeasuresasmoreaccurate
meth-odstoevaluatefatdepositsandproteincontentinpatients
withchronicliverdisease.
RegardingW/HandBMI,animportantflawoccurs,which
can be explained at least in part by the chronic pattern
ofnutritionalimpairmentobservedinthesepatientswhen
bothweightandheightareinvolved.Thisreinforcesthatthe
useof conventionalanthropometricindices, suchasW/A,
H/A,W/H,andBMI,mayoverestimatethenutritionalstatus
ofpatientswithcholestasis,evenwhenedemaandascites
arenot evident.Inaddition,visceromegaly contributesto
weightincreaseof thesepatients,whichcompromisesthe
useofindicesthatincludeweight.2
Theinadequacyoftheseindicescanalsobenoticedwhen
comparing patients with and without jaundice, and with
andwithout livercirrhosis.Nostatisticaldifferenceswere
detectedbetween thesesubgroupsforW/A, H/A,W/H or
BMI.On theother hand,theevaluationofACshowed
sta-tisticallysignificant differencebetween patientswithand
without cirrhosis and between children with and without
jaundice.
The evaluationof TST andAMChasnot shown
statisti-caldifferencebetweenpatientswithandwithoutcirrhosis.
Thiscanbeexplainedbythe factthatthepatient
assess-menthasbeenperformedinasinglemoment.Summingup,
in the majority of cases, malnutrition wasonly detected
whentheevaluationwasnotrestrictedtoweightandheight
measures.
ThefrequencyofnutritionaldepletionbasedonACand
TSTevaluation wassimilar,indicating similardepletion of
fat and lean mass. This finding differed from the results
Table3 Nutritionalclassificationbasedonanthropometricindicesinthewholegrouppatientsandstratifiedaccordingtothe presenceofcirrhosis.
Index General(91
patients),n(%)
Withcirrhosis(25 patients),n(%)
Withoutcirrhosis (66patients),n(%)
Height/age
Verylow 16(17.6%) 5(20.0%) 11(16.7%)
Low 12(13.2%) 3(12.0%) 9(13.6%)
Adequate 63(69.2%) 17(68.0%) 46(69.7%)
Weight/age
Verylow 11(12.1%) 4(16.0%) 7(10.6%)
Low 19(20.9%) 5(20.0%) 14(21.2%)
Adequate 59(64.8%) 15(60.0%) 44(66.7%)
High 2(2.2%) 1(4.0%) 1(1.5%)
Weight/height
Verylow 6(6.6%) 2(8%) 4(6.1%)
Low 5(5.5%) 3(12%) 2(15.2%)
Adequate 66(72.50%) 16(64%) 50(75.8%)
High 14(15.4%) 4(25%) 10(15.2%)
Bodymassindex
Verylow 7(7.7%) 3(12%) 4(6.1%)
Low 8(8.8%) 4(16%) 4(6.1%)
Adequate 56(61.5%) 12(48%) 44(66.7%)
Overweightrisk 19(20.8%) 5(20%) 14(21.2%)
Overweight 1(1.1%) 1(4.0%) 0(0.0%)
Armcircumferencea
Severedepletion 3(3.4%) 1(4.0%) 2(3.1%)
Moderatedepletion 7(7.9%) 5(20.0%) 2(3.1%)
Milddepletion 29(32.6%) 11(44.0%) 18(28.1%)
Eutrophy 42(47.2%) 7(28.0%) 35(54.7%)
Overweight 8(8.9%) 1(4.0%) 7(10.9%)
Obesity 0(0.0%) 0(0.0%) 0(0%)
Tricepsskinfoldthickness
Severedepletion 21(23.1%) 12(48.0%) 9(13.6%) Moderatedepletion 15(16.5%) 2(8.0%) 13(19.7%)
Milddepletion 6(6.6%) 2(8.0%) 4(6.0%)
Eutrophy 17(18.7%) 4(16.0%) 13(19.7%)
Overweight 11(12.1%) 1(4.0%) 10(15.1%)
Obesity 21(23.1%) 4(16.0%) 17(25.8%)
Armmusclecircumferenceb
Severedepletion 6(13.3%) 2(16.7%) 4(12.1%)
Moderatedepletion 10(22.2%) 4(33.3%) 6(18.2%)
Milddepletion 16(35.6%) 4(33.3%) 12(36.4%)
Eutrophy 13(28.9%) 2(16.7%) 11(33.3%)
Note:Forevaluationofheight/ageindex,Z-scorewascategorizedasverylow(Z-score<−3);low(Z-score≥−3and<−2);adequate
(Z-score≥−2).Fortheweight/ageindex,asverylow(Z-score<−3);low(Z-score≥−3and<−2);adequate(Z-score≥−2and≤+2);
high(Z-score>+2).Forweight/height,asverylow(Z-score<−3);low(Z-score≥−3and<−2);adequate(Z-score≥−2and≤+1);high(Z
-score>+1).Forbodymassindex,Z-scorewascategorizedasverylow(Z-score<−3);low(Z-score≥−3and<−2);adequate(Z-score≥−2
and≤+1);overweightrisk(>Z-score+1and≤Z-score+2)and(Z-score>+2and<+3).Forarmcircumference,tricepsskinfoldthickness,
andarmmusclecircumference,theusedclassificationwasseveredepletion:<70%ofexpected;moderatedepletion:≥70%and<80%
ofexpected;milddepletion:≥80%and<90%ofexpected;eutrophy:≥90%and≤110%ofexpected;overweight:>110%and≤120%of
expected;andobesity:>120%ofexpected.
aThetotalnumberofpatientsevaluatedinthisindexwas89. b Thetotalnumberofpatientsevaluatedinthisindexwas45.
offat. Thisdifferencecanbeattributedtopatients’age, sinceinthestudyofCardosoetal.21 patientswereyounger
withmean age of nine months. AMCseemed to
overesti-matemalnutrition,since71.1%ofpatientshadsomedegree
ofdepletion,with83.3%amongpatientswithcirrhosisand
66.7%amongthegroupwithoutcirrhosis.TheAMC
evalua-tionperformed onlyinpatientsolderthanoneyearofage
Table4 Nutritionalclassificationbasedonanthropometricindicesinthewholegrouppatientsandstratifiedaccordingtothe presenceofjaundice.
Index General(91
patients),n(%)
Withjaundice(70 patients),n(%)
Withoutjaundice (21patients),n(%)
Height/age
Verylow 16(17.6%) 14(20%) 2(9.5%)
Low 12(13.2%) 11(15.7%) 1(4.8%)
Adequate 63(69.2%) 45(64.3%) 18(85.7%)
Weight/age
Verylow 11(12.1%) 9(12.9%) 2(9.5%)
Low 19(20.9%) 17(24.3%) 2(9.5%)
Adequate 59(64.8%) 42(60%) 17(81%)
High 2(2.2%) 2(2.9%) 0(0%)
Weight/height
Verylow 6(6.6%) 5(7.1%) 1(4.8%)
Low 5(5.5%) 5(7.1%) 0(0%)
Adequate 66(72.5%) 53(75.7%) 13(61.9%)
High 14(15.4%) 7(10%) 7(33.3%)
Bodymassindex
Verylow 7(7.7%) 6(8.6%) 1(4.8%)
Low 8(8.8%) 8(11.4%) 0(0%)
Adequate 59(64.8%) 48(68.6%) 11(52.4%)
Overweightrisk 16(17.6%) 7(10%) 9(42.9%)
Overweight 1(1.1%) 1(1.4%) 0(0%)
Armcircumferencea
Severedepletion 3(3.4%) 3(4.4%) 0(0%)
Moderatedepletion 7(7.9%) 7(10.3%) 0(0%)
Milddepletion 29(32.6%) 24(35.3%) 5(23.8%)
Eutrophy 42(47.2%) 29(42.6%) 13(61.9%)
Overweight 8(8.9%) 5(7.4%) 3(14.3%)
Obesity 0(0.0%) 0(0%) 0(0%)
Tricepsskinfoldthickness
Severedepletion 21(23.1%) 19(27.1%) 2(9.5%) Moderatedepletion 15(16.5%) 15(21.4%) 0(0%)
Milddepletion 6(6.6%) 5(7.1%) 1(4.8%)
Eutrophy 17(18.7%) 8(11.4%) 9(42.9%)
Overweight 11(12.1%) 8(11.4%) 3(14.3%)
Obesity 21(23.1%) 15(21.4%) 6(28.6%)
Armmusclecircumferenceb
Severedepletion 6(13.3%) 6(20%) 0(0%)
Moderatedepletion 10(22.2%) 6(20%) 4(26.7%)
Milddepletion 16(35.6%) 12(40%) 4(26.7%)
Eutrophy 13(28.9%) 6(20%) 7(46.7%)
Note:Forevaluationofheight/ageindex,Z-scorewascategorizedasverylow(Z-score<−3);low(Z-score≥−3and<−2);adequate
(Z-score≥−2).Forweight/ageindex,asverylow(Z-score<−3);low(Z-score≥−3and<−2);adequate(Z-score≥−2and≤+2);high
(Z-score>+2).Forweight/height,asverylow(Z-score<−3);low(Z-score≥−3and<−2);adequate(Z-score≥−2and≤+1);high(Z
-score>+1).Forbodymassindex,Z-scorewascategorizedasverylow(Z-score<−3);low(Z-score≥−3and<−2);adequate(Z-score≥−2
and≤+1);overweightrisk(>Z-score+1and≤Z-score+2)and(Z-score>+2and<+3).Forarmcircumference,tricepsskinfoldthickness
andarmmusclecircumference,theusedclassificationwasseveredepletion:<70%ofexpected;moderatedepletion:≥70%and<80%
ofexpected;milddepletion:≥80%and<90%ofexpected;eutrophy:≥90%and≤110%ofexpected;overweight:>110%and≤120%of
expected;andobesity:>120%ofexpected.
a Thetotalnumberofpatientsevaluatedinthisindexwas89. b Thetotalnumberofpatientsevaluatedinthisindexwas45.
Regardingdietaryintake,57.2%of91 patientsingested lowerthan95%ofdietrecommendations,withoutsignificant differences between patients with and without cirrhosis (p=0.32)andbetweenchildrenwithandwithout jaundice
the AC,TST, or AMC, there wasno statistical difference. Thesemethods proved tobe similarandimportant inthe nutritionalassessmentof patientswithchroniccholestatic liver disease. Accordingly, Cardoso et al.21 showed even
higherindices of inadequatediet (90%) when food intake
wasevaluatedqualitativelyandquantitatively.Thisiseven
moreworrying,sincecaloricintakeshouldbeoptimizedto
up140%oftheexpected.Consideringthisrecommendation,
only2.2%ofpatientshadappropriatecaloricintake.After
thisevaluation,thefamilieswereorientatedregardingfood
intakeanddieteticneeds,buttheresultsofthe
interven-tionshavenotbeenstudiedyet.
Theauthorsareawareofthelimitationsofthepresent
study.Themostimportantofthemisthatnutritional
assess-ment was performed in a single moment, which makes
comparisonsbetweenpatientswithorwithoutcirrhosisand
withorwithout jaundicedifficult,sincethepatientswere
at different stages in the disease course. Another
limita-tion was related to the dietary record, because, even if
datacollectionis strict,this record canalways be faulty,
sinceitdependsonpatient’s memoryandcooperation.In
addition,an importantissueis thatthenutritional
assess-mentwasperformedbythesamedietitian;ideally,itwould
beperformedbytwodietitianswithasubsequent
compar-isonoftheresults.Nevertheless,theauthorsbelievethese
limitationsdonotdecreasetheimportanceofthepresent
findings.
Inconclusion,theuseofweightfornutritionalevaluation
mayunderestimatethedetectionofmalnutritioninpatients
withchronic liverdiseases due tovisceromegaly,
subclini-cal edema, and/or ascites.21 The anthropometric indices
thatconsiderweightandheight,suchasW/HandBMI,may
also not reveal the real degree of depletion attributable
to chronic clinical condition of these patients, in which
bothweightandheightareimpaired.TSTandACmeasures
appeartobemoreaccurateparametersfornutritional
eval-uationofpatientswithliverdiseasesandcholestasis.
Conflicts
of
interest
Theauthorsdeclarenoconflictsofinterest.
Acknowledgments
This study waspartially supported by the National Coun-cil of Scientific and Technological Development (CNPq, Brazil), Foundation of Support to Research of the State of Minas Gerais (FAPEMIG,Brazil) and by the Grant INCT-MM (from National Institute of Science and Technology of Molecular Medicine, FAPEMIG/CBB-APQ-00075-09 and CNPq/573646/2008-2).
References
1.EuropeanAssociationfortheStudyoftheLiver.EASLClinical PracticeGuidelines:managementofcholestaticliverdiseases. JHepatol.2009;51:237---67.
2.NguyenKD,SundaramV,AyoubWS.Atypicalcausesof cholesta-sis.WorldJGastroenterol.2014;20:9418---26.
3.FeranchakAP,SokolRJ.Medicalandnutritionalmanagement ofcholestasisininfantsandchildren.In:SuchyFG,SokolRJ,
Balistreri WF, editors. Liver disease in children. New York: CambridgeUniversityPress;2007.p.190---218.
4.BarchesNR,ChangI,KarpenSJ,CarterBA,GossJA.Impactof pretransplantgrowthretardationinpediatricliver transplanta-tion.JPediatrGastroenterolNutr.2006;43:89---94.
5.Moukarzel AA, Najm I,Vargas J, McDiarmid SV, Busuttil RW, AmentME.Effectsofnutritionalstatusonoutcomeof ortho-topiclivertransplantationinpediatricpatients.TransplProc. 1990;22:1560---3.
6.RamaccioniV,SorianoHE,ArumugamR,KlishWJ.Nutritional aspects ofchronic liver disease and liver transplantation in children.JPediatrGastroenterolNutr.2000;30:361---7. 7.ProtheroeSM. Feeding the child with chronic liver disease.
Nutrition.1998;14:796---800.
8.Pawlowska J, Matusik H, Socha P, Ismail H, Ryxko J, Karcz-marewiczE,etal.Beneficialeffectoflivertransplantationon bonemineraldensityinsmallinfantswithcholestasis.Transpl Proc.2004;36:1479---80.
9.UlivieriFM,LisciandranoD,GridelliB,LucianettiA,RoggeroP, NebbiaG,etal.Bonemassandbodycompositioninchildren withchroniccholestasisbeforeandafterlivertransplantation. TransplProc.1999;31:2131---4.
10.SaronML,GodoyHT, HesselG. Nutritionalstatusofpatients withbiliaryatresiaandautoimmunehepatitisrelatedtoserum levels of vitamins A, D and E. Arq Gastroenterol. 2009;46: 62---8.
11.MoyerV,FreeseDK,WhitingtonPF,OlsonAD,BrewerF,Colletti RB,etal.Guidelinefortheevaluationofcholestaticjaundice ininfants:recommendationsoftheNorthAmericanSocietyfor PediatricGastroenterology,HepatologyandNutrition.JPediatr GastroenterolNutr.2004;39:115---28.
12.MinistériodaSaúdedoBrasil.SecretariadeAtenc¸ãoàSaúde, DepartamentodeAtenc¸ãoBásica.ProtocolosdoSistemade Vig-ilânciaAlimentareNutricional---SISVANnaassistênciaàsaúde ---CadernodeAtenc¸ãoBásica.SérieB---TextosBásicosdeSaúde. Brasília:MinistériodaSaúde;2008.
13.World Health Organization. WHO child growth standards: length/height-for-age, weight-for-age, weight-for-length, weight-for-height, and body mass index-for-age. Methods and development. WHO (nonserial publication). Geneva, Switzerland:WHO;2006.
14.WHOAnthroPlusforpersonalcomputers:softwareforassessing growthoftheworld’schildrenandadolescents.Version3.2.2. Geneva:WHO;2011.
15.WHO Multicentre Growth Reference Study Group. WHO Child Growth Standards: head circumference-for-age, arm circumference-for-age,tricepsskinfold-for-ageand subscapu-larskinfold-for-age:methodsanddevelopment.Geneva:World HealthOrganization;2007.
16.Frisancho AR. Triceps skin fold and upper arm muscle size norms for assessment of nutritional status. Am J ClinNutr. 1974;27:1052---8.
17.BressanJ, EstevesE.Sistema desuporte deavaliac¸ão nutri-cionaleavaliac¸ãodedietas.DietPro[software].Version4.0. MinasGerais:AgromídiaSoftware;2001.
18.PhilippiST.Tabeladecomposic¸ãodealimentos---Suportepara decisãonutricional.2nded.SãoPaulo:Coronário;2002. 19.UNICAMP/NEPA.Tabelabrasileiradecomposic¸ãodealimentos
---TACO.Campinas:UNICAMP[cited2015Jan20].Availablefrom: http://www.unicamp.br/nepa/taco/contar/tacoversao2.pdf. 20.WorldHealthOrganization.Energyandproteinrequirements:
reportofajointFAO/WHO/ONUexpertconsultation.Geneva: WHO;1985.Technicalsupportseriesn.:724.
21.Cardoso AL, Porta G, Vieira MA,Carraza FR. Caracterizac¸ão nutricionaldecrianc¸ascom colestasecrônica.JPediatr (Rio J).1997;73:43---50.
comdoenc¸ahepáticacrônicacomesemcolestase.JPediatr (RioJ).2005;81:317---24.
23.BastosMD,Silveira TR.Níveisplasmáticosde vitamina Dem crianc¸as e adolescentes com colestase. J Pediatr (Rio J). 2003;79:245---52.
24.SchneiderAC,PintoRB,Silveira TR.Nutritionalriskand mal-nutritiondeterminationbyanthropometryincirrhoticchildren andadolescents.ArqGastroenterol.2007;44:345---9.