Engineering
ISSN: 1809-4430 (on-line)
_________________________
2 Universidade Federal de Lavras/Lavras - MG, Brasil. 3 Aviário Santo Antônio/Nepomuceno - MG, Brasil.
SPACIAL ILLUMINANCES VARIABILITY AND ENERGY CONSUMPTION IN AVIARIES FOR LAYING HENS EQUIPED WITH COMPACT FLUORESCENT LAMPS
AND LIGHT EMITTING DIODE Doi:http://dx.doi.org/10.1590/1809-4430-Eng.Agric.v36n6p962-971/2016
PRISCILLA A. P. RIBEIRO1*, TADAYUKI YANAGI JUNIOR2,
DANIELA D. DE OLIVEIRA3, GABRIEL A. E. S. FERRAZ2, DIAN LOURENÇONI2
1*Corresponding author. Universidade Federal de Lavras/ Lavras - MG, Brasil. E-mail: [email protected]
ABSTRACT: The spatial illuminance distribution interferes in the commercial production of eggs and electric energy consumption, being considered the second major source of costs in the production chain. Therefore, in this study the objective was to evaluate the spatial distribution of the illuminance level and electric energy consumption in two commercial aviaries for egg production. The first aviary was equipped with compact fluorescent lamps (CFL) and the second, with light-emitting diode (LED) lamps. The illuminances in the aviaries were analyzed using descriptive statistics and their spatial distribution through geostatistics. It was found that the aviary equipped with CFL showed better uniformity in the illuminances distribution and better results in attending the luminance levels of 5 lux. On the other hand, the one equipped with LED lamps showed electric energy consumption 43.52% less than the one equipped with compact fluorescent lamps (CFL).
KEYWORDS: electric energy, geostatistics, artificial illumination, aviary.
INTRODUCTION
The egg is a major source of animal protein for human consumption, and its production is one of the agriculture segments in expansion in Brazil. The improved growth performance of the poultry industry is due to factors such as genetic improvement, nutrition and health care and ambience, with emphasis on artificial lighting.
According to BORILLE et al. (2013), the use of artificial lighting for laying hens is essential to the egg production management and it can be used to improve laying rate and to optimize the feed efficiency.
The light interferes in laying hens welfare, and its effect is quite complex because it involves the different light wavelengths analysis in the birds health and behaviour. According to NORTH & BELL (1990), the minimum luminous intensity for laying hens is 5 lux, however, several recommendations are reported in the literature, such as 10 lux (MORRIS, 2004), between 35 and 55 lux (YILDIZ et al., 2006).
In this context, the illuminance levels evaluation is important for planning the lighting program. Among the methodologies for this analysis, there is the geostatistics, which allows the study of the spatial variability of illuminance levels in aviaries by kriging interpolation. Thus, it is possible to obtain maps to understand the spatial distribution aiding in the planning and lighting control (YANAGI et al., 2011; MORRIL, 2014).
According to YANAGI et al. (2011), with the spatial distribution of the variables related to the production environment more detailed information is obtained on the studied system, and with the geostatistical analysis is possible to obtain semivariogram models and their parameters.
The use of artificial lighting systems integrates with husbandry practices, being necessary the correct planning of the lighting program, taking into account the production criteria and also the technical characteristics of the lamps, aiming to reduce electricity and maintenance costs.
Currently, the use of light-emitting diode lamps (LED) in egg production has shown high luminous efficiency, lower power consumption and longer useful life when compared to compact fluorescent lamps (CFL), commonly used in the installations. Several studies have evaluated the LED lamps use in the installations and verified that there was no damage to the production and eggs quality, and it contributes to the economy of electric power and reduction of the artificial lighting system maintenance cost (ER et al., 2007; GONGRUTTANANUN, 2011; BORILLE et al., 2013; NUNES et al., 2013).
It was observed in the literature studies about the influence of the LED lamp use and its colour variations in egg production and birds behaviour (MIN et al., 2012; SILVA et al., 2012; HUBER-EICHER et al., 2013; HASSAN et al., 2014), but few studies are carried out aiming the deployment and maintenance costs analysis, which can bring economic advantages to the producers. The electric power needed to maintain the lighting programs represents a significant portion of the aviary variable costs. According to JÁCOME et al. (2014), in Brazil studies about artificial lighting should be developed with multidisciplinary analyses, involving egg production, environment and electric power consumption. Therefore, the rational electric power use should be considered in animal production systems aiming to the natural resources conservation, essential for sustainable development of the production chain.
In this context, the aim of this study was to evaluate the spatial distribution of illuminance level and the electric power consumption in two commercial poultries for egg production, equipped with LED and compact fluorescent lamps.
MATERIAL AND METHODS
1 - Aviary characteristics and data collection
The experiment was carried out in a commercial farm for egg production in the municipality of Nepomuceno - MG, Brazil; the experiment implementation period was from June 11th to
September 12th, 2014.
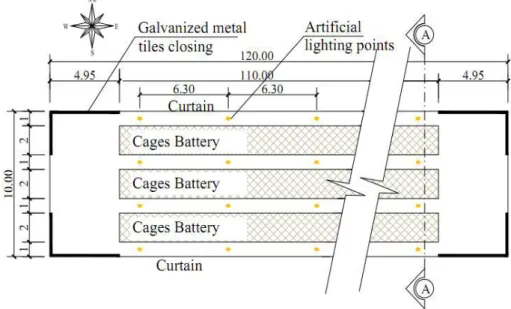
It was evaluated separately two conventional aviaries with the same dimensions (10 m x 120 m), ceiling height of 4.50 m and east west orientation. The aviaries had galvanized metal tiles in trapezoidal shape with 0.65 mm of thickness, slope of 25%, North and South overhangs with dimension of 1.0 m and east west with 0.5m. The side locks were made of yellow canvas curtains.
The first aviary was equipped with 72 compact fluorescent lamps (10W) and the second with 72 LED lamps (7 W) both have central distribution of individual power grid. The evaluated compact fluorescent lamps had luminous flux of 590 lm, with diffuse distribution, and colour temperature of 6,500 K (white), the LED lamps had luminous flux of 550 lm, directed downward with opening angle of 120º and 6,400 K (white), according to the manufacturer’s specifications.
The lighting program consists of 17 hours of light and 7 hours of dark (17L: 7D). Natural and artificial lighting provided the total 17 hours of light, and for the evaluation period, on average, were offered 12 hours of daylight and 5 of artificial lighting. Artificial lighting was turned on at 6 pm and off at 8 pm; it was then turned on again at 03 am and off at 06 am.
Each row of cages battery had 18 points of artificial lighting, whereas the distance between points was 6.30 m. The installation height of the bulbs was 2.70 m in relation to aviary floor level.
cages arranged in heights of 0.10 m, 0.75 m, 1.40 m and 2.05 m in relation to the aviary floor, respectively, from the first to the fourth floor of cages (Figure 2).The birds housed in the aviaries are Hy-Line in early production (22 weeks old), totalling 30,500 chickens in each aviary.
The two aviaries had automated systems to water and feed distribution and to eggs collection. The eggs were collected through belts located on each line of each floor and connected to central belts that lead the eggs for the house selection and process.
FIGURE 1. Aviary schematic drawing (no defined scale). Dimension units: m.
FIGURE 2. Aviary AA cross-section (no defined scale). Dimension units: m.
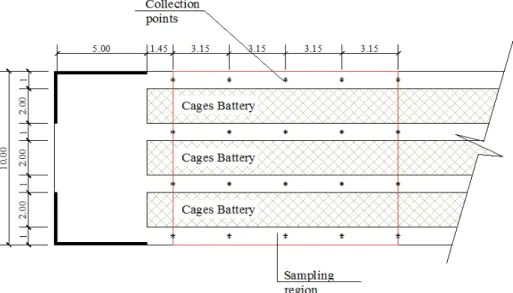
To evaluate the distribution of illuminance offered by the different lamps, illuminance measurements were performed with luximeter, (ICEL, LD-510 model, accuracy ± 3% for incandescent lamps and ± 5% for the rest) every 15 days, totalling six days of measurements. These biweekly measurements allowed the calculation of average illuminance values that were used in geostatistical analysis, providing thus more representative data. The measurements were carried out simultaneously in both aviaries from 6 pm, when there was no interference of natural light or other external light sources.
each of these five points there were the collection at the four floors levels of cages in heights of 0.40 m, 1.10 m, 1.70 m and 2.40 m (Figure 5).
FIGURE 3. Schematic design of the aviary showing experimental parcels for illuminance mensuration (no defined scale). Dimension units: m.
FIGURE 4. Schematic design of the aviary showing in detail the measurement points of illuminance (no defined scale). Dimension units: m.
FIGURE 5. Longitudinal-section of the aviary showing the measurement points of illuminance (no defined scale). Dimension units: m.
The property is located in the concession area of the Energy Company of Minas Gerais (Cemig), in the high-voltage tariff group A4, as it is characterized as rural enterprise and it has its own transformer.
2 - Determination of the spatial illuminance variability
Initially the illuminance was analysed using descriptive statistics, calculating the average, standard deviation, median, minimum and maximum. It was verified if the average and the variance values showed no tendency, or if they are stationary. The conditions specified by the hypothesis of stationary were contemplated, and then the semivariogram was estimated from the sampling data.
The spatial dependence was evaluated by semivariograms settings (BACHMAIER & BACKERS, 2008), based on the assumption of intrinsic stationary hypothesis, which was estimated by [eq. (1)].
(1) that,
N(h) - number of experimental data pairs separated by a distance h; Z(xi) - value determined at each reading point;
Z(xi+h) - value measured at a point over a distance h;
- graphical representation of semivariogram according to the distance h.
The coefficients of the theoretical model for semivariogram (the nugget effect, C0; Spatially
dependent component, C1; sill, C0 + C1; and therange, a) were estimated from the adjustment of a
mathematical model to the calculated values of γ (h). Range is the distance within which the samples are shown spatially correlated. Sill is the value of the corresponding semivariogram to its range. From this point on, it was considered that there is no more spatial dependence between samples. The nugget effect reveals the discontinuity of the semivariogram for distances smaller than the shortest distance between the samples. The nugget effect measures the unexplained variability depending on the distance of the sample used, such as local variations, analysis errors, sampling errors and others. Spatially dependent component is the difference between the sill and the nugget effect.
The semivariograms were adjusted by the method of Restricted Maximum Likelihood (REML), and the mathematical model was spherical. To analyse the spatial illuminance dependence degree, it was used the classification of CAMBARDELLA et al. (1994), that were considered strong spatial dependence the semivariograms in relation the nugget effect (C0) / (C0 + C1) smaller
than the 25% of the sill, moderate between 25 and 75% and weak bigger than 75%. This methodology has been used by several authors (MORRIL, 2014; PONCIANO et al., 2013; CARVALHO et al., 2012; PEREIRA et al., 2012; YANAGI et al., 2011).
After the semivariogram adjustment, it was carried out the interpolation data by ordinary kriging, which enabled the maps development, aiming the spatial illuminance visualization. The software used for statistical analysis was the statistical computing system R (R Development Core Team) and its geoR library (RIBEIRO JÚNIOR & DIGGLE, 2001).
RESULTS AND DISCUSSION
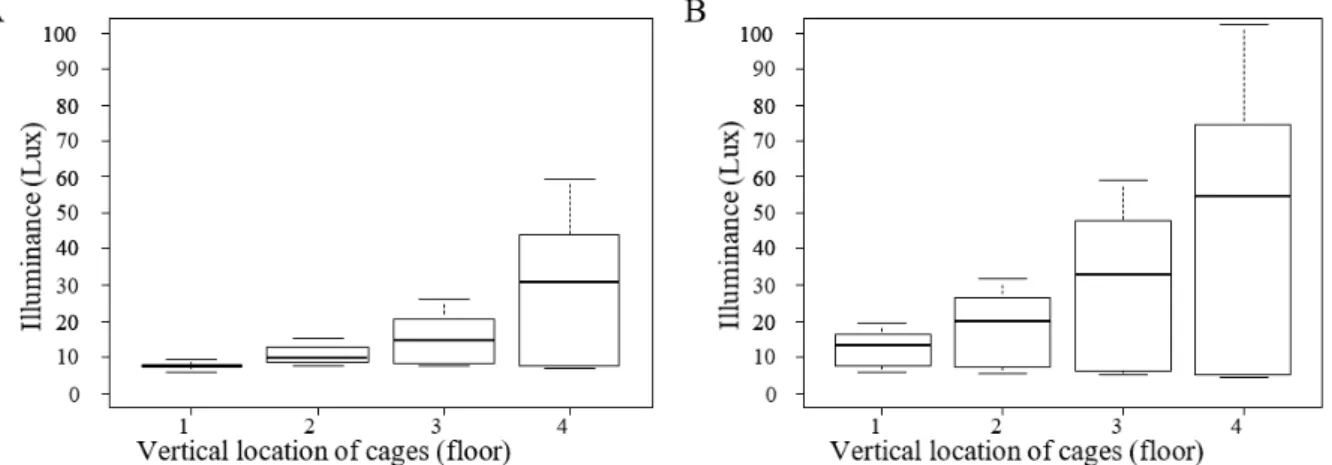
FIGURE 6. Box Plot graphs for illuminance in the floors from the 1st to the 4th with heights of 0.40 m,
1.10 m, 1.70 m and 2.40 m, respectively, in aviaries equipped with (A) compact fluorescent lamps, and (B) LED lamps.
However, a way to better characterize the spatial illuminance distribution is through geostatistics.
The minimum luminous intensity for laying aviaries is 5 lux (NORTH & BELL, 1990). MORRIS (2004) recommends 10 lux, although the physiological limit in response to changes in the photoperiod to be 2 lux (GARNER et al., 2012; MORRIS, 2004). According to YILDIZ et al. (2006), luminous intensities between 35 and 55 lux improve yield and eggs’ quality.
In all floors the LED lamp provided greater luminous intensity than fluorescent lamp (Figure 6) and less uniformity in the illuminance distribution, being these characteristi cs the most evident on the 3rd and 4th floors.LONG et al. (2015) also observed a lower uniformity in
the spatial light distribution in aviaries illuminated with LED lamps when compared to fluorescent lamps. In this research, two types of lamps evaluated showed different patterns for decreasing the light intensity, suggesting the need for reorganization of the LED lamps to obtain a more uniform distribution. A more detailed comparison was not possible considering that the authors did not present all the information necessary for the characterization of the evaluated lamps.
The LED lamps evaluated in this study present as a characteristic the direction of the luminous flux downward hindering the illuminance distribution.
The estimates for the parameters of the experimental semivariogram for the illuminance variable in the four cages’ floor and in both lighting systems evaluated are given in Table 1. The adjustment method that best represents the data was the spherical model, confirming the brightness analysis carried out by YANAGI et al. (2011) in broiler facilities.
TABLE 1. Estimates for the parameters of experimental semivariogram for illuminance in the four floors of the aviaries equipped with compact fluorescent lamps and LED lamps.
Aviaries Nugget effect
Spatially dependent
component Sill Range (m)
Dependence
Degree Average error
CFL
1st Floor 0 0.52 0.52 5.68 0.00 Strong 0.01415
2nd Floor 0 5.055 5.05 3.50 0.00 Strong 0.00038
3rd Floor 0 37.38 37.38 3.52 0.00 Strong 0.00059
4th Floor 0 330.85 330.85 3.55 0.00 Strong 0.00112
LED
1st Floor 0 21.24 21.24 3.61 0.00 Strong 0.00183
2nd Floor 0 93.19 93.19 3.48 0.00 Strong 0.00137
3rd Floor 0 420.06 420.06 3.44 0.00 Strong 0.00197
4th Floor 0 1305.8 1305.83 3.44 0.00 Strong 0.00305
The semivariogram showed well-defined sills, being the ranges or the limits values of the distances in which there would not be more spatial dependencies for the illuminance variable in compact fluorescent and LED lamps, they are listed in Table 1.
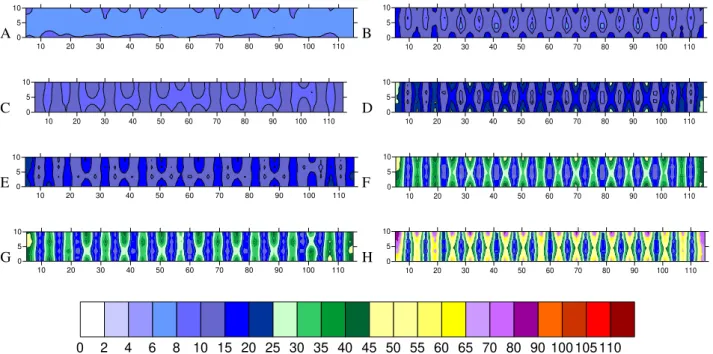
From the spatial dependency of the semivariogram models, it was estimated illuminance values by kriging. It has therefore been possible to build spatial distribution maps for the four cage floors of each evaluated aviary, allowing visualizing the spatial variability of the data and enabling to observe the differences between the LED and the compact fluorescent lamps (Figure 7). The aviary which uses compact fluorescent lamps showed lower illuminance values and more uniform distribution, being the 1st floor of this aviary that showed the best results.
A
10 20 30 40 50 60 70 80 90 100 110
0 5 10
B
10 20 30 40 50 60 70 80 90 100 110
0 5 10
C
10 20 30 40 50 60 70 80 90 100 110
0 5 10
D
10 20 30 40 50 60 70 80 90 100 110
0 5 10
E
10 20 30 40 50 60 70 80 90 100 110
0 5 10
F
10 20 30 40 50 60 70 80 90 100 110
0 5 10
G
10 20 30 40 50 60 70 80 90 100 110
0 5 10
H
10 20 30 40 50 60 70 80 90 100 110
0 5 10
0 2 4 6 8 10 15 20 25 30 35 40 45 50 55 60 65 70 80 90 100 105 110
FIGURE 7. Spatial distribution of illuminance levels for the four cages’ floors of the lighting systems consisting of compact fluorescent lamps (CFL) and LED lamps. (A) 1st floor – CFL; (B) 1st
floor – LED; (C) 2nd floor – CFL; (D) 2nd floor – LED; (E) 3rd floor – CFL; (F) 3rd floor –
LED; (G) 4th floor – CFL; and (H) 4th floor – LED.
of LED lamps features the largest amplitude, indicating high heterogeneity. This is due to the characteristic of the LED lamp evaluated, which despite of having diffusing dome, directed the luminous flux downward, in order to avoid losses, but in this case affect visual comfort for the birds. In this context, some of the LED lamps’ models need to be tested for using in aviaries.
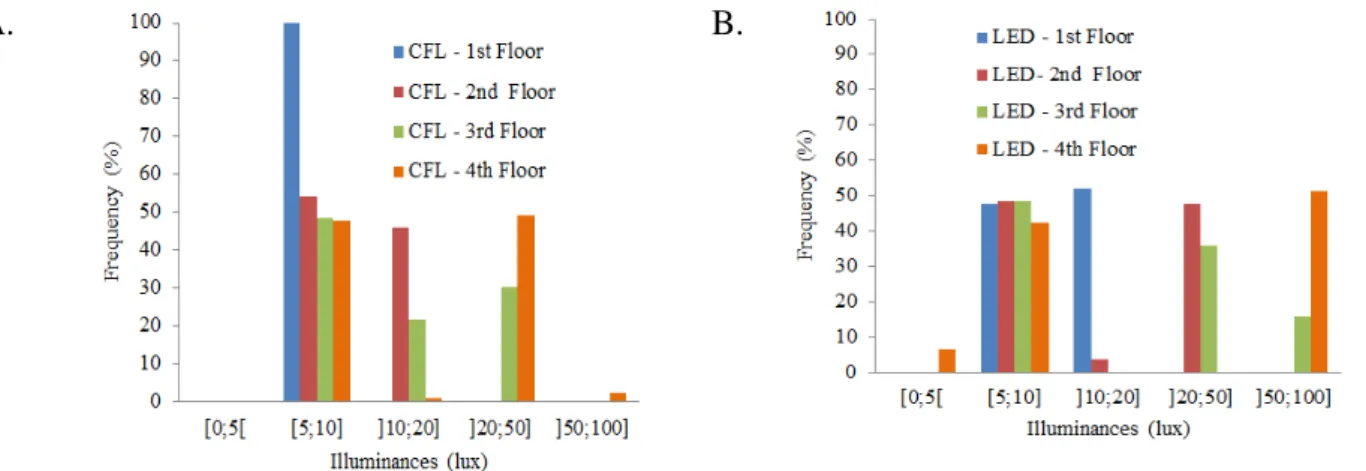
A. B.
FIGURE 8. Occurrence frequency of illuminance levels in four cages’ floors of aviaries for the lighting systems (A) with compact fluorescent lamps (CFL), and (B) LED lamps.
In both lighting systems assessed every floor presented illuminance levels within the minimum of 5 lux, except the 4th floor with the LED lamp, in which about 6% of the data collected
were below the recommended minimum. The aviary equipped with compact fluorescent lamps showed 62.6% of the data collected in the range between 5 and 10 lux, the one equipped with LED lamps this percentage was 46.8%.The evaluated aviaries adopt the minimum illuminance of 5 lux (NORTH & BELL, 1990), considering that the ideal illuminance would be the one between 5 and 10 lux, the compact fluorescent lamp showed the best distribution.
The aviary illuminated with LED lamps showed higher levels of illuminance and on the 4th floor more than 50% of the sampling points indicate illuminance between 50 and 100 lux. These results highlight the need for repositioning the LED lamps to reduce the illuminance levels and homogenize their distribution.This adaptation will possibly reduce the number of lamps installed in the aviary and thus reduce the consumption of electricity, besides the lighting system implementation cost.
All the evaluated lamps were new and were installed at the beginning of the experiment, but it should be noted that may occur the depreciation of the lamps luminous flux along the time. The production environment, usually humid and with a lot of suspended dusty can aggravate this situation. LONG et al. (2015) evaluated the depreciation of the luminous flux of LED lamps in aviaries and found a decrease of 27% in the illuminance level after 3,360 hours of use.
The aviary equipped with compact fluorescent and LED lamps showed electricity consumption of 425 kWh and 240 kWh, respectively, during the experimental period of 94 days. Therefore, the use of LED lamps caused the reduction of 43.52% in the electricity consumption.
The data in the present literature, as well as those obtained in this study indicate the potential to reduce electricity costs in egg production, but it is necessary the economic assessment considering the implementation costs of the lighting system with LED lamps.
CONCLUSIONS
The aviary equipped with compact fluorescent lamps showed better uniformity in the illuminance distribution when compared to that equipped with LED lamps, and provide better results to attend the minimum illuminance of 5 lux.
The LED lamp had lower electricity consumption, resulting in a reduction of 43.52% as compared to the CFLs, and therefore the one that presents higher economic advantages. However, it should be carrying out economic analysis.
ACKNOWLEDGMENTS
The authors express their thanks to CAPES, FAPEMIG and CNPq for financial support and to the Aviary Santo Antonio Group for providing their facilities for this research.
REFERENCES
BACHMAIER, M; BACKERS, M. Variogram or semivariogram? Understanding the variances in a variogram. Precision Agriculture, Dordrecht, v. 9, p. 173-175, fev. 2008.
BORILLE, R.; GARCIA, R. G.; ROYER, A. F. B.; SANTANA, M. R.; COLET, S.; NAAS, I. A.; CALDARA, F. R.; ALMEIDA PAZ, I. C. L.; ROSA, E. S.; CASTILHO, V. A. R. The use of light-emitting diodes (LED) in commercial layer production. Revista Brasileira de Ciência Avícola, Campinas, v. 15, n. 2, p. 135-140, 2013.
CAMBARDELLA, C.A.; MOORMAN, T.B.; NOVAK, J.M.; PARKIN, T.B.; KARLEN, D.L.; TURCO, R.F.; KONOPKA, A.E. Field scale variability of soil properties in Central Iowa soils. Soil Science Society of America Journal, Madison, v.58, n.5, p.1501-1511, 1994.
CARVALHO, T. M. R.; MOURA, D. J.; SOUZA, Z. M.; SOUZA, G. S.; BUENO, L. G. F.; LIMA, K. A. O. Use of geostatistics on broiler production for evaluation of different minimum ventilation systems during brooding phase. Revista Brasileira de Zootecnia, Viçosa, MG, v.41, n.1, p.194-202, 2012.
ER, D.; WANG, Z.; CAO, J.; Effect of monochromatic light on the egg quality of laying hens. The Journal Applied Poultry Research, Athens, v. 16, n. 4, p. 605-612, 2007.
GARNER, J. P.; KIESS, A. S.; MENCH, J. A.; NEWBERRY, R. C.; HESTER, P. Y. The effect of cage and house design on egg production and egg weight of White Leghorn hens: An
epidemiological study. Poultry Science, Savoy, v. 91, p.1522–1535, 2012.
GONGRUTTANANUN, N. Influence of red light on reproductive performance, eggshell ultrastructure, and eye morphology in Thai-native hens. Poultry Science, Savoy, v. 90 n. 12, p. 2855-2863, 2011.
HASSAN, R.; SULTANA, S.; CHOE, H. S.; RYU, K. S. Effect of combinations of monochromatic LED light color on the performance and behavior of laying hens. Japanese Poultry Science, Tokyo, v. 51, p. 321-326, 2014.
HUBER-EICHER, B.; SUTER, A.; SPRING-STÄHLI, P. Effects of colored light-emitting diode illumination on behavior and performance of laying hens. Poultry Science, Savoy, v. 92, p. 869– 873, 2013.
JÁCOME, I. M. T. D. Diferentes sistemas de iluminação artificial usados no alojamento de poedeiras leves. 2009. 144f. Tese (Doutorado em Engenharia Agrícola) - Unicamp, Campinas, 2009.
LONG, H.; ZHAO, Y.; WANG T., Z. NING, XIN, H. Effect of light-emitting diode vs. fluorescent lighting on laying hens in aviary hen houses: Part 1 – Operational characteristics of lights and production traits of hens. Poultry Science, Savoy, v. 0, p. 1–11, 2015.
MIN, J. K.; HOSSAN, M. S.; NAZMA, A.; JAE, C. N.; HAN, T. B.; HWAN, K. K.; DONG, W. K.; HYUN, S. C.; HEE, C. C.; OK, S. S. Effect of monochromatic light on sexual maturity,
production performance and egg quality of laying hens. Avian Biology Research, St. Albans, v. 5, n. 2, p. 69-74, jun./ 2012.
MORRIL, W. B. B. Iluminação por diodo emissor de luz e sua influência na produção de frangos de corte. 2014. 82f. Tese (Doutorado em Engenharia Agrícola) - Universidade Federal Rural de Pernambuco, Recife, 2014.
MORRIS, T. R. Environmental control for layers. World's Poultry Science Journal, Cambridge, v. 60, n. 02, p. 163-175, junho 2004.
NORTH, M. O.; BELL, D.D. Commercial chicken production manual. New York: Van Nostrand Reinhold, 1990. 913p.
NUNES, K. C.; GARCIA, R. G.; BORILLE, R.; NÄÄS, I. A.; SANTANA, M. R. Led como fonte de luz na avicultura de postura. Enciclopédia Biosfera, Goiânia, v.9, n.17, p. 1765, 2013.
PEREIRA, P. A.; YANAGI JUNIOR, T.; SILVA, J. P.; LIMA, R. R.; CAMPOS, A. T.; ABREU, L. H. P. Technical evaluation of artificial ligthing systems for broiler houses. Engenharia
Agrícola, Jaboticabal, v.32, n.6, p.1011-1024, nov./dez. 2012.
PONCIANO, P. F.; YANAGI, T.; FERRAZ, G. A. E. S.; SCALON, J. D.; SCHIASSI, L. Spatial variability o fair dry bulb temperature and black globe humidity index a broiler house during the healting phase. Engenharia Agrícola, Jaboticabal, v.33, n.3, p.432-444, maio/jun. 2013.
RIBEIRO JÚNIOR, P. J.; DIGGLE, P. J. GeoR: a package for geostatistical analysis. R-News, New York, v. 1, n. 2, p. 14-18, 2001.
SILVA, G. F.; TAVARES, B. O.; PEREIRA, D. F. Comportamento de poedeiras em função de diferentes fontes de iluminação monocromáticas. BioEng, Tupã, v.6 n.3, p. 148-158, set/dez. 2012. YANAGI, T.; AMARAL, A. G.; TEIXEIRA, V. H.; LIMA, R. R. Caracterização espacial do ambiente termoacústico e de iluminância em galpão comercial para criação de frangos de corte. Engenharia Agrícola, Jaboticabal, v.31, n.1, p.1-12, 2011.