Socio-Economic Differentials in
Impoverishment Effects of Out-of-Pocket
Health Expenditure in China and India:
Evidence from WHO SAGE
Kaushalendra Kumar1
*, Ashish Singh2, Santosh Kumar3, Faujdar Ram1, Abhishek Singh1,
Usha Ram1, Joel Negin4, Paul R. Kowal5
1International Institute for Population Sciences, Mumbai, India,2Indian Institute of Technology Bombay, Mumbai, India,3Sam Houston State University, Houston, United States of America,4School of Public Health, University of Sydney, Sydney, Australia,5World Health Organization (WHO), Geneva, Switzerland
*kaushalendra.1983@gmail.com
Abstract
Background and Objectives
The provision of affordable health care is generally considered a fundamental goal of a wel-fare state. In addition to its role in maintaining and improving the health status of individuals and households, it impacts the economic prosperity of a society through its positive effects on labor productivity. Given this context, this paper assesses socioeconomic-differentials in the impact of out-of-pocket-health-expenditure (OOPHE) on impoverishment in China and India, two of the fastest growing economies of the world.
Data and Methods
The paper uses data from the World Health Organisation’s Study on Global Ageing and Adult Health (WHO SAGE), and Bivariate as well as Multivariate analyses for investigating the socioeconomic-differentials in the impact of out-of-pocket-health-expenditure (OOPHE) on impoverishment in China and India.
Results and Conclusions
Annually, about 7% and 8% of the population in China and India, respectively, fall in poverty due to OOPHE. Also, the percentage shortfall in income for the population from poverty line due to OOPHE is 2% in China and 1.3% in India. Further, findings from the multivariate anal-ysis indicate that lower wealth status and inpatient as well as outpatient care increase the odds of falling below poverty line significantly (with the extent much higher in the case of in-patient care) due to OOPHE in both China and India. In addition, having at least an under-5 child in the household, living in rural areas and having a household head with no formal edu-cation increases the odds of falling below poverty line significantly (compared to a head with college level education) due to OOPHE in China; whereas having at least an under-5 child,
OPEN ACCESS
Citation:Kumar K, Singh A, Kumar S, Ram F, Singh A, Ram U, et al. (2015) Socio-Economic Differentials in Impoverishment Effects of Out-of-Pocket Health Expenditure in China and India: Evidence from WHO SAGE. PLoS ONE 10(8): e0135051. doi:10.1371/ journal.pone.0135051
Editor:Rachel A. Nugent, University of Washington, UNITED STATES
Received:March 24, 2015
Accepted:July 17, 2015
Published:August 13, 2015
Copyright:© 2015 Kumar et al. This is an open access article distributed under the terms of the Creative Commons Attribution License, which permits unrestricted use, distribution, and reproduction in any medium, provided the original author and source are credited.
not having health insurance and residing in rural areas increases the odds of becoming poor significantly due to OOPHE in India.
Introduction
The provision of affordable health care is generally considered a fundamental goal of a welfare state. In addition to its role in maintaining and improving the health status of individuals and households, it impacts the economic prosperity of a society through its positive effects on labor productivity. The affordability of a health care system is often conceptualized in terms of
“financial protection”, that is, individuals and households should be protected from incurring a burden of health care expenditure that would adversely affect their economic wellbeing [1].
Nevertheless, policies in many countries compel households and individuals to cover a sub-stantial portion of healthcare costs out-of-pocket. The annual mean per capita health expendi-ture was Int$1080 (purchasing power parity [PPP] estimate) globally in 2011 and varied from Int$68 in low income to Int$647 in middle income countries. Of the total health expenditure, per capita government contribution in 2011 was Int$623 worldwide, Int$27 in low income countries and Int$361 in middle income countries, respectively, whereas, out-of-pocket health expenditure (OOPHE) constituted 21% of the total health expenditure in 2011 globally. The percentage of health expenditure covered by OOPHE varied from 47% in low income countries to 34% in middle income countries [2].
In countries where a major part of health care is financed by OOPHE, health expenditures can have impoverishing effects on the economic status of households, especially among the poorer socioeconomic strata [1,3–8]. For example, households in the lowest income quintile and/or with higher inpatient expenses are more likely to borrow or sell assets in order to cope with health care expenses [9]. One analysis of health care financing strategy in 40 low and mid-dle income countries by Kruk, Goldmann, and Galea (2009) revealed that about 26% (one bil-lion) of households borrow or sell their assets to pay for health care [10]. From a policy perspective, health care financing in the absence of any other health security inflates the house-hold consumption expenditure and hence underestimates the actual level of poverty in coun-tries [11].
Though the research on catastrophic health expenditures (CHE) is fairly developed and there are a few studies examining the impoverishment effects of OOPHE across different coun-tries [12–18], detailed analyses of socioeconomic differentials in the impoverishment effects of OOPHE are rare. Therefore, in this paper, we fill this gap by investigating socioeconomic dif-ferentials in the impact of OOPHE on impoverishment in China and India. Li et al. (2014) and Li et al. (2012) investigate the extent of CHE and impoverishment from medical expenses in China, but their main focus is on the determinants of CHE rather than the determinants of impoverishment effects [15,16]. Similarly, studies by Balarajan et al. (2011) and Garg and Karan (2009) are limited to the estimation of overall poverty level increase due to OOPHE in India [12,13]. In contrast, we use data from two heavily populated countries China and India to provide evidence on socioeconomic differentials in the share of OOPHE in total and non-food expenditures, the percentage of the population falling below poverty line (poverty head count) due to OOHPE, the average poverty gap due to OOPHE, and the odds of becoming poor due to OOPHE.
Our choice of China and India is motivated by several considerations. First, China and India are not only the two most populous countries in the world but are also among the fastest Adult Health-2007/10, WAVE 1 is 635 (http://apps.
who.int/healthinfo/systems/surveydata/index.php/ access_licensed/track/635).
Funding:The authors have no support or funding to report.
growing economies of the present times. Second, among the developing countries, financial hardship of health payments is reportedly higher in China and India, with households relying excessively on OOPHE [17]. Finally, a substantial proportion of the population falls below the poverty line due to OOPHE in these countries. For example, taking a poverty line of US$1.08, Van Doorslaer et al., (2006) estimated that about 2.6% (32 million) and 3.7% (37–39 million) of the population in China and India, respectively, fell below the poverty line due to OOPHE in 1999–2000 alone [19]. Similarly, Garg and Karan (2009) estimated that the overall poverty level increased by 3.2% due to OOPHE in India in 1999–2000 and a study by Balarajan et al. (2011) indicated that about 39 million Indians are pushed into poverty by OOPHE every year [12,13]. Regarding China, estimates show that about 7.5% of households became poor due to OOPHE in China in 2008 [14,16].
Despite the potentially impoverishing effects of OOPHE, the annual per capita expenditure on health has increased from Int$ 53 (PPP) in 1995 to Int$ 432 (PPP) 2011 in China and from Int$ 46 (PPP) in 1995 to Int$ 141 (PPP) in 2011 in India (Fig 1). This is combined with near stagnation in the share of government expenditure as a percentage of total expenditure on health from 1995 to 2011 in both the countries, the government share being only 31% and 56% in India and China, respectively in 2011 (Fig 2). Nevertheless, the two countries have seen
Fig 1. Per capita annual expenditure on health (PPP international $), 1995–2011 (Based on data from WHO 2014).
doi:10.1371/journal.pone.0135051.g001
Fig 2. Government expenditure as a percentage of total expenditure on health, 1995–2011 (Based on data from WHO 2014).
some improvement (China–46% to 35% and India–68% to 59%) in the share of OOPHE as a percentage of total health expenditure during the time period from 1995–2011 (Fig 3).
The remainder of the paper is organized as follows: the next two sections briefly describe the data and the methods used in the paper, these are followed by a section summarizing the findings, and the final section provides our main conclusions along with a discussion of the main results.
Data and Methods
Ethics statement
The data were analyzed anonymously, using publicly available secondary data; therefore no ethics review is required for this work.
Data
We use data from the World Health Organization’s Study on Global Ageing and Adult Health (SAGE), which was implemented in China, Ghana, India, Mexico, The Russian Federation and South Africa in the years 2007–2010. The target population in each country was adults (18 years and older), and data were also collected the households of study participants. The survey was primarily aimed to provide nationally comparable estimates on health status, wellbeing and health care utilization by the adult population in each country [20]. The data were col-lected using face-to-face paper and pencil interviews (PAPI) for India. In China, 50% PAPI and 50% face-to-face computer assisted personal interviews (CAPI) were used [20]. The house-hold (individual) response rates were about 99% (68%) in India to 95% (99%) in China. For further details on sampling and other procedures, refer to Kowal et al. (2012) [20].
While the focus of WHO-SAGE was on older adults, the design of the study allows for robust analysis of health across adulthood (i.e. a life-course perspective to the ageing process). This includes the variables in this paper—where age of household head is used to identify adults (<50) and older adults (50+) for comparison. Comparisons were made at this level, along with a count of older adults and children in the household—two "vulnerable" groups with supporting literature about health care utilization and cost patterns that could contribute a significant amount of the variation in household health expenditure. Expenditure variables are captured at the household level, with assumptions made about how resources are used in households. Individual level analyses require adjustments of expenditure based on household
Fig 3. Out-of-pocket health expenditure as a percentage of total expenditure on health, 1995–2011 (Based on data from WHO 2014).
size to configure individual level consumption, and so for these analyses, we believed the vari-ables chosen to assess "age" were the most robust approach to predicting consumption/con-sumption outcomes. Also, the data is publicly available at:http://apps.who.int/healthinfo/ systems/surveydata/index.php/catalog/sage/about
As mentioned above, though the information regarding the impoverishment effects of health payments in the survey is collected at the household level, the analysis has been adjusted using household size (by using appropriate population weight a multiple of sampling weights with household size) to generate population level estimates. In total, SAGE interviewed 10,218 households in China and 9626 households in India. Because our study compares out-of-pocket health expenditure to both total expenditure and non-food expenditure, households for which food expenditure was not reported were excluded from the analysis. The final sample includes 9591 (93.9% of total) households from China and 9583 (99.6% of total) households from India. Wealth quintile wise distribution of the excluded household in China shows that about 36% households belong to the poorest or poor wealth quintile and about 40% households from the richer or richest wealth quintile. Therefore, the above mentioned exclusion of households from the sample is not likely to affect the estimates significantly.
The survey captures household food expenditure for the last 7 days preceding the survey, non-food and health care and services expenditure for the 30 days preceding the survey, and expenditure on health aids, overnight stays and long term health care for the 12 months pre-ceding the survey. To obtain comparable figures, we converted each expenditure measure to a 30-day basis.
Methods
In this paper we focus mainly on socioeconomic differentials in the share of OOPHE as a pro-portion both of total and of non-food expenditures (in terms of capacity to pay which has been defined subsequently), the impoverishment effects of OOPHE, and the odds of impoverish-ment due to OOPHE. It is worth noting that we have followed the definition and concepts of the impoverishment effect as described by [18,21].
Out-of-pocket health expenditure (OOPHE) and its share in total and non-food expendi-ture (capacity to pay)
Out-of-pocket health expenditure includes the net total of insurance reimbursement (OOPHE includes health insurance premium, therefore we have excluded the health insurance reimbursement from OOPHE) and household expenditure in last 30 days on doctors’ registra-tion and consultaregistra-tion, tradiregistra-tional and alternative healers, diagnostic and laboratory tests, medi-cation, dental care, ambulatory care, and other health care products or services. It also includes the net total of insurance reimbursement and household expenditure in last year on mandatory or voluntary health insurance premiums, health related aids, overnight stay in health facilities, and long-term care.
estimates should be taken as more reliable. In this regard, Raban et al. [23] itself reports that there are 28 questions on inpatient and outpatient health expenditure in NSS health expendi-ture survey 2004–05 compared with only 13 questions in the NSS consumer expenditure survey 2004–05. This reflects in 29.2% CHE (almost twice) as per NSS health expenditure survey 2004–05 compared with only 14% CHE in the NSS consumer expenditure survey-2004-05 [23]. Similarly, mean OOP inpatient care payment is US$ 36.8 in the NSS health expenditure survey 2004–05 compared with only US$ 18.7 in the NSS consumer expenditure survey-2004-05 in India [23]. Hence, it can also be said that WHO SAGE or NSS health expenditure surveys are designed to capture health expenditures in a better way compared to other“economics” ori-ented surveys like NSS consumer expenditure surveys whose focus is more on overall con-sumption expenditure. [13] can also be seen in this regard.
Unlike many previous studies, ours study includes ambulance charges in the health expen-diture figure, which constitutes a large share of total health expenexpen-diture in developing countries [1]. Haffner, Moschel, and ten Horn (1987) found that retrospective reports of ambulatory care up to 6 months prior to the survey and outpatient care up to 3 months prior to the survey provide reliable estimates [25].
Capacity to pay (ctp) is defined as the household’s expenditure (exp) in excess of the subsis-tence expenditure (se),which is the minimum expenditure required to remain on or above the poverty line [18,21].
Household0s capacity to payðctpiÞ ¼expi sei; if sei foodi
For the household reporting food expenditure less than subsistence expenditure (food) then capacity to pay is:
Household0s capacity to payðctpiÞ ¼ expi foodi; if sei>foodi
Subsistence expenditure is the equivalent household size adjusted average food expenditure of the household lying between its 45thand 55thpercentile [26]. Household level subsistence expenditure is the poverty line multiplied by equivalent household size.
Subsistence expenditureðseiÞ ¼ pl eqsizei
Whereplandeqsizei=hhsize0.56are poverty line and equivalent household size of theith
household.
The poverty line is the weighted average of the equivalent food expenditures (eqfood) in the range of food expenditure (food) shares of total household expenditure (exp) that are at the 45th(foodexp45) and 55th(foodexp55) percentile across the whole sample [21].
Poverty lineðplÞ ¼ P
wiPeqfoodi wi
Where (foodexp45)(eqfoodi=foodi/eqsizei)(foodexp55) andfoodexpi=foodi/expiis the
food expenditure share to the total household expenditure of theithhousehold.
A household is classified as poor if its total expenditure is less than the subsistence expendi-ture [21].
expenditure solely due to OOPHE [21].
Poverty head countðImpooriÞ ¼ 1if expi seiandðexpi OOPHEiÞ<sei
‘0’otherwise; where,expiis the total expenditure of theithhousehold.
The poverty headcount ratio is measured as the households who fall below the poverty line (at constant 2007–10 international $ 89.43 in India and international $ 125.67 in China) due to OOPHE as a proportion of all the households in the population [3,19,27].
Poverty head count ratioðHCRÞ ¼ PN
i¼1Impoori N
The poverty gap measures the percentage deficit from the poverty line of those households that have become poor due to OOPHE, and poverty gap ratio measures the percentage deficit from the poverty line of households that have become poor due to OOPHE as a proportion of all the households in the population. In a sense, the poverty gap ratio measures the average per-centage deficit from the poverty line due to OOPHE for the population [3,19,27]
The poverty gap for theithhousehold can be defined as:
Poverty gapi¼Impoori fsei ðexpi OOPHEiÞg=sei
Povery gap ratioðPGRÞ ¼ 1
N
XN
i¼1
Poverty gapi
Statistical modeling. We modeled associations between selected socioeconomic charac-teristics and the odds of becoming poor due to OOPHE using logistic regressions. The binary outcome variable was whether or not a household has become poor (net total household expen-diture becoming less than the required subsistence expenexpen-diture) due to OOPHE.
Covariates or independent variables. The catastrophic health expenditure and impover-ishment effect of OOPHE depends on demographic and socio-economic condition of the household. Existing studies on the subject have established that household demographic status like age and sex of the household head, number of 50+ aged elderly and 0–5 years aged chil-dren, household size and place of residence determine the CHE and impoverishment effect of OOPHE [14,16,28–30]. For a given value of health expenditure, the catastrophic impact of OOPHE depends on the food expenditure which in turn depends on household head’s educa-tion and economic status [14,26]. The study Wagstaff and van Doorslaer [3] also find that high impoverishment intensity of OOPHE is due to poor becoming poorer rather than the non-poor falling below poverty line. Further, [31] shows that lower income groups pay a higher share of their income compared to the higher income groups on health care.
In the present study, we have measured the socio-economic condition of households by household head’s education and wealth quintile to which a household belongs. Health insur-ance coverage reduces the chinsur-ance of catastrophic of impoverishment effect of OOPHE. Studies also find that household with family member enrolled in any insurance scheme has lower rates of CHE and impoverishment [14,18,30,32]. Inpatient hospitalization of the household member increases the chance of CHE [14]. And Wagstaff and van Doorslaer [3] find that non-hospital expenditure during inpatient care of the household member increases the chance of impover-ishment [3]. In the present study, hospitalization is measured in terms of inpatient and outpa-tient care received by the household members.
(ANOVA) is used to determine whether there are any significant differences between the means of three or more independent groups. That is, the one-way ANOVA compares the means between the groups we are interested in and determines whether any of those means are significantly different from each other. In order to check does socio-economic differential in impoverishment effect of OOPHE we first run the multivariate logistic regression adjusting for socio-economic status and health insurance of the household member in Model-1. We further adjusted for the household demographic characteristics in Model-2, which gives the demo-graphic characteristics controlled socio-economic differential in impoverishment effect of OOPHE. Finally, Model-3 test show socio-economic status mediates between OOPHE, due to health care utilization, and its impoverishment effect we take interaction of wealth quintile and inpatient or outpatient care received. All bivariate and multivariate analysis is performed using corresponding national weight and taking into account the survey design of the SAGE survey data.
Results
Distribution of Socio-economic Characteristics
Table 1shows the percentage distribution of the population by socioeconomic characteristics. Regarding the educational status of households, India has a higher proportion of population living in households in which the head has no formal schooling (32%, CI: 29.6–34.2)), whereas the corresponding figure in China is only 15% (CI: 13.2–16.6). In terms of health insurance, there is a stark contrast between the two countries. While 94% (CI: 92.9–95.1) of the popula-tion in India lives in a household in which no member has health insurance, only 8% (CI: 6.7–
8.8) live in such households in China.
The majority of the population in China and India lives in households headed by males: 74% (CI: 71.7–75.9) for China and 93% (CI: 91.9–93.7) for India. Also more than half of the population in these two countries lives in households whose heads are 50 years or older: 79% (CI: 77.0–80.4) for China and 55% (CI:53.0, 56.7) for India. In addition, most individuals live in households having at least one member who is 50 years or older. The average household is substantially larger in India, with more than 93% (CI: 92.5–93.8) of the population living in households of four or more.
In the case of inpatient care, about 17% (CI: 15.9–18.2) of the population in China and 13% (CI: 12.2–14.7) of the population in India belongs to households in which at least one member received in-patient care during the period covered in the survey. When it comes to outpatient care, about 60% (CI: 57.5–62.4) of the Indian population belongs to a household in which at least one member received outpatient care, which is substantially higher than the percentage in China (46%, CI: 43.1–48.3).
Out-of-Pocket Health Expenditure
The mean share of out-of-pocket health expenditure (OOPHE) as a percentage of total as well as non-food expenditure (capacity to pay) is presented inTable 2. The share of OOPHE as a percentage of total expenditure is about 15% (CI: 14.4–15.8) in China and 12% (CI 11.0–12.1) in India. OOPHE as a percentage of capacity to pay is same for both China and India (23%, CI: 22.3–24.4 China; 22.3–24.1 India).
OOPHE’s share as a percentage of capacity to pay is lower among households in which at least one member has health insurance in India.
OOPHE as a percentage of total expenditure and as a percentage of capacity to pay is higher among those residing in female-headed households in China. It is also higher among those belonging to households with elder as the head and among households having at least an elderly member in both China and India. Interestingly, households with at least one child have a lower proportion of OOPHE in China but a higher proportion of OOPHE in India. There is a trend of an increasing proportion of OOPHE with decreasing household size in China.
Also, its share is higher in rural areas in India and in the case of share as a percentage of capacity to pay in China. OOPHE’s share in both China and India is higher among those from households’where at least one member received inpatient and outpatient care compared to those from households’where no member received them.
Table 1. Percentage distribution of population by the selected household characteristics, China and India, 2007–10.
China (n = 9591) India (n = 9583)
Household head education status No formal schooling 14.8 (13.2,16.6) 31.9 (29.6,34.2)
Primary 38.1 (35.7,40.6) 29.2 (27.5,31.0)
Secondary 41.0 (39.3,42.6) 31.3 (29.5,33.3)
College + 6.1 (4.3,8.6) 7.6 (6.5,8.9)
Wealth quintile Poorest 20.0 (18.1,22.0) 20.0 (17.4,22.9)
Poorer 20.0 (18.3,21.8) 20.0 (18.3,21.8)
Middle 20.0 (18.9,21.2) 20.0 (18.6,21.5)
Wealthier 20.1 (18.8,21.4) 20.0 (18.2,22.0)
Wealthiest 19.9 (17.3,22.8) 20.0 (17.5,22.7)
Health insurance No member 7.7 (6.7,8.8) 94.1 (92.9,95.1)
Any member 92.3 (91.2,93.3) 5.9 (4.9,7.1)
Sex of the household head Male 73.9 (71.7,75.9) 92.8 (91.9,93.7)
Female 26.1 (24.1,28.3) 7.2 (6.3,8.1)
Age of the household head <50 years 21.2 (19.6,23.0) 45.1 (43.3,47.0)
>= 50 years 78.8 (77.0,80.4) 54.9 (53.0,56.7)
Household member aged 50+ None 12.3 (11.5,13.2) 27.9 (26.4,29.4)
1 27.3 (26.0,28.6) 34.8 (33.4,36.2)
>= 2 60.4 (59.2,61.6) 37.4 (35.6,39.1)
Member aged5 years None 84.7 (83.2,86.2) 46.9 (44.7,49.0)
>= 1 15.3 (13.8,16.8) 53.1 (51.0,55.3)
Household size 1 5.6 (4.9,6.5) 0.3 (0.2,0.4)
2–3 56.2 (54.1,58.3) 6.6 (5.9,7.2)
>= 4 38.2 (35.8,40.7) 93.1 (92.5,93.8)
Place of residence Urban 49.9 (48.6,51.3) 26.1 (20.9,31.9)
Rural 50.1 (48.7,51.4) 73.9 (68.1,79.1)
Inpatient care received No 83.0 (81.8,84.1) 86.6 (85.3,87.8)
yes 17.0 (15.9,18.2) 13.4 (12.2,14.7)
Outpatient care received No 54.3 (51.7,56.9) 40.0 (37.6,42.5)
yes 45.7 (43.1,48.3) 60.0 (57.5,62.4)
Total 100.0 100.0
Note:95% CI given in parenthesis.
Impoverishing Effects of OOPHE
The percentage of population falling below poverty line and the average deficit from the pov-erty line (povpov-erty gap) due to OOPHE is presented inTable 3. About 7% (CI: 6.7–8.3) and 8% (CI: 7. 3–8.8) of the population falls below poverty line due to OOPHE in China and India, respectively.
Regarding socioeconomic differentials in the percentage of population falling below poverty line due to OOPHE–percentage impoverished among the households with an uneducated
Table 2. Mean percentage share of out-of-pocket health expenditure (OOPHE) as a proportion of total expenditures and capacity to pay by selected household characteristics, China and India, 2007–2010.
OOPHE’s share in total expenditure OOPHE’s share in capacity to pay
China India China India
% share (95% CI) % share (95% CI) % share (95% CI) % share (95% CI)
Household head Education status No education 18.0 (16.4,19.6) * 11.8 (11.0,12.7) * 30.1 (27.9,32.2) * 26.9 (25.5,28.4) *
Primary 16.3 (15.3,17.4) 10.9 (9.7,12.1) 25.1 (23.8,26.5) 22.4 (20.5,24.3) Secondary 13.6 (12.8,14.5) 11.9 (11.0,12.8) 20.5 (19.3,21.6) 21.7 (20.3,23.1) College + 10.7 (8.4,13.0) 11.2 (9.9,12.4) 15.7 (12.1,19.3) 17.4 (15.3,19.4) Wealth quintile Poorest 16.9 (15.9,17.9) * 11.1 (9.9,12.2) 30.4 (29.0,31.7) * 28.3 (26.2,30.4) *
Poorer 17.5 (16.2,18.8) 11.1 (9.8,12.3) 27.5 (25.9,29.2) 25.0 (22.7,27.4) Middle 15.3 (14.1,16.4) 11.3 (9.9,12.6) 22.2 (20.8,23.6) 23.1 (21.0,25.1) Wealthier 15.3 (13.8,16.7) 12.2 (11.2,13.2) 21.4 (19.5,23.2) 21.6 (20.1,23.1) Wealthiest 10.8 (9.5,12.0) 12.1 (11.0,13.3) 15.4 (13.7,17.1) 18.2 (16.6,19.8) Health insurance No member 13.3 (11.8,14.9) 11.5 (10.9,12.0) 22.7 (20.6,24.9) 23.4 (22.5,24.4) *
Any member 15.3 (14.6,16.0) 12.5 (11.0,13.9) 23.4 (22.3,24.5) 20.2 (17.9,22.5) Sex of the household head Male 15.1 (14.3,15.9) * 11.6 (11.1,12.2) 23.2 (22.0,24.4) * 23.3 (22.4,24.2) Female 15.3 (14.4,16.2) 10. 4(9.0,11.8) 23.9 (22.5,25.2) 22.4 (19.5,25.4) Age of the household head <50 years 11.4 (9.9,12.9) * 10.7 (10.1,11.4) * 17.4 (15.4,19.5) * 22.4 (21.1,23.6) *
>= 50 years 16.1 (15.5,16.8) 12.2 (11.4,13.0) 25.0 (24.0,25.9) 24.0 (22.8,25.2)
Fifty plus aged elderly No elderly 10.3 (9.3,11.3) * 10.4 (9.7,11.2) * 14.8 (13.5,16.2) * 22.0 (20.6,23.5) *
One elderly 13.3 (12.2,14.4) 11.2 (10.4,12.0) 21.8 (20.3,23.2) 23.3 (21.9,24.7) 2+ Elderly 17.0 (16.0,17.9) 12.7 (11.6,13.7) 25.8 (24.5,27.1) 24.1 (22.8,25.4) Member aged5 years No child 15.4 (14.7,16.1) * 10.6 (10.0,11.3) * 23.6 (22.6,24.7) * 20.6 (19.6,21.6) *
1+ child 13.6 (11.9,15.3) 12.3 (11.5,13.1) 21.9 (19.8,24.0) 25.6 (24.3,26.9) Household size 1 18.6 (16.8,20.4) * 9.3 (5.9,12.7) 29.5 (26.9,32.1) * 23.1 (17.1,29.1) 2–3 15.8 (15.0,16.5) 11.2 (10.0,12.5) 23.8 (22.8,24.7) 22.9 (20.8,25.0) 4+ 13.7 (12.4,15.1) 11.6 (11.0,12.1) 21.9 (20.0,23.9) 23.3 (22.3,24.2) Place of residence Urban 13.9 (12.9,15.0) 10.2 (9.3,11.2) * 21.6 (20.0,23.3) * 19.1 (17.6,20.6) *
Rural 16.3 (15.4,17.3) 12.0 (11.3,12.7) 25.1 (23.8,26.3) 24.7 (23.6,25.8) Inpatient care received No 13.3 (12.6,14.1) * 10.8 (10.3,11.4) * 21.2 (20.1,22.3) * 22.3 (21.4,23.2) *
Yes 23.9 (22.5,25.3) 16.1 (14.5,17.6) 33.9 (32.0,35.7) 29.2 (26.8,31.7) Outpatient care received No 14.1 (13.2,14.9) * 11.2 (10.4,12.1) 21.8 (20.7,22.8) * 22.1 (20.7,23.5) *
Yes 16.4 (15.5,17.3) 11.7 (11.1,12.3) 25.3 (23.9,26.6) 24.0 (23.1,25.0)
Total 15.1 (14.4,15.8) 11.5 (11.0,12.1) 23.4 (22.3,24.4) 23.2 (22.3,24.1)
Note
*p0.05,based on one way ANOVA 95% CI given in parenthesis.
household head is almost 10% (CI: 8.2–11.3) in both India and China which declines, respec-tively to 2.1% (CI: 1.1–4.3) in China and 3.3% (CI: 1.9–5.8) in India among the households headed by head who has at least a college level education. We would like to mention here that the present discussion should not be seen in any causal terms but only in terms of association. Also, about 9.9% (CI: 8.1–12.0) and 11% (CI: 9.3–13.0) of the poorest households, respectively
Table 3. Percentage population falling poverty line (poverty head count ratio) and average deficit from the poverty line (poverty gap ratio) due to out-of-pocket health payments by selected household characteristics, China and India, 2007–2010.
Poverty head count ratio (%) Poverty gap ratio (%)
China India China India
Poverty headcount (95% CI)
Poverty headcount (95% CI)
Poverty gap (95% CI)
Poverty gap (95% CI)
Household head Education status
No education
9.6 (8.2,11.2) * 9.7 (8.3,11.3) * 2.9(2.2,3.6) * 1.7(1.3,2.1) *
Primary 8.8 (7.8,10.1) 8.6 (7.0,10.5) 2.3(1.8,2.7) 1.4(1.0,1.9)
Secondary 6.1 (5.1,7.4) 6.9 (5.4,8.7) 1.5(1.2,1.8) 1.0(0.7,1.3)
College + 2.1 (1.1,4.3) 3.3 (1.9,5.8) 0.5(0.1,0.9) 0.4(0.1,0.6)
Wealth quintile Poorest 9.9 (8.1,12.0) * 11.0 (9.3,13.0) * 2.7 (2.1,3.2) * 2.1 (1.5,2.6) *
Poorer 9.8 (8.3,11.6) 8.7(6.8,11.0) 2.8 (2.2,3.4) 1.4 (1.0,1.8)
Middle 7.5 (6.3,9.0) 9.1 (7.2,11.5) 2.1 (1.7,2.5) 1.5 (0.9,2.1)
Wealthier 6.1 (4.6,8.0) 8.0 (6.2,10.1) 1.4 (1.0,1.9) 1.0 (0.7,1.4)
Wealthiest 3.9 (2.9,5.2) 3.2 (2.2,4.8) 0.8 (0.6,1.0) 0.4 (0.2,0.6)
Health insurance No member 6.4 (5.2,7.8) 8.3 (7.6,9.2) * 1.7(1.2,2.1) 1.3(1.1,1.5) *
Any member
7.5 (6.7,8.5) 2.7 (1.5,4.8) 2.0(1.7,2.2) 0.4(0.1,0.8)
Sex of the household head Male 7.6 (6.7,8.5) 8.1 (7.3,9.0) 2.0(1.7,2.3) 1.3(1.1,1.5)
Female 7.1 (5.7,8.8) 6.6 (4.7,9.3) 1.8(1.3,2.2) 1.0(0.5,1.5)
Age of the household head <50 years 5.8 (4.5,7.5) * 8.0 (6.8,9.4) 1.4(0.9,1.9) * 1.3(1.0,1.6) >= 50
years
7.9 (7.1,8.8) 8.0 (6.8,9.5) 2.1(1.8,2.4) 1.3(1.0,1.6)
Fifty plus aged elderly No elderly 5.0 (3.5,7.1) * 8.3 (7.0,9.7) 1.2(0.7,1.6) * 1.3(1.0,1.6)
One elderly 6.9 (5.9,8.0) 7.2 (6.1,8.5) 1.8(1.4,2.2) 1.2(0.9,1.5)
2+ Elderly 8.2 (7.2,9.3) 8.6 (7.1,10.4) 2.2(1.8,2.5) 1.4(1.0,1.7)
Member aged5 years No child 7.2 (6.4,8.0) 6.9 (6.0,7.9) * 2.0(1.7,2.2) 1.3(0.9,1.6) *
1+ child 8.9 (7.0,11.2) 9.0 (7.8,10.3) 2.0(1.2,2.7) 1.3(1.1,1.6)
Household size 1 7.4 (6.1,9.0) 4.7 (2.3,9.4) 2.3(1.7,3.0) 1.1(0.3,1.9)
2–3 7.5 (6.6,8.4) 9.0 (6.9,11.7) 2.1(1.8,2.4) 1.6(0.9,2.3)
4+ 7.4 (6.0,9.2) 7.9 (7.2,8.8) 1.8(1.3,2.2) 1.3(1.1,1.5)
Place of residence Urban 5.6 (4.4,7.0) * 5.7 (4.3,7.6) * 1.2(0.9,1.5) * 1.0(0.6,1.5) *
Rural 9.3 (8.3,10.4) 8.8 (7.9,9.8) 2.7(2.3,3.1) 1.4(1.2,1.6)
Inpatient care received No 6.4 (5.7,7.3) * 7.6 (6.8,8.5) * 1.6(1.3,1.8) * 1.2(1.0,1.4) *
Yes 12.3 (10.4,14.4) 10.5(8.5,13.0) 3.8(3.0,4.7) 1.9(1.3,2.5)
Outpatient care received No 7.1 (6.1,8.2) 7.7 (6.6,9.0) 1.8(1.5,2.1) 1.4(1.0,1.7)
Yes 7.9 (6.8,9.1) 8.2 (7.3,9.3) 2.1(1.8,2.5) 1.2(1.0,1.5)
Total 7.4 (6.7,8.3) 8.0 (7.3,8.8) 2.0(1.7,2.2) 1.3(1.1,1.5)
Note
*p0.05,based on one way ANOVA 95% CI given in parenthesis.
in China and India fall below the poverty line due to OOPHE, compared to only 3.9% (CI: 2.9–
5.2) and 3.2% (CI: 2.2–4.8) of the wealthiest households in China and India, respectively. In India, relatively lower percentage (2.7%; CI: 1.5–4.8) of the households with insured members become impoverished compared to 8.3% (CI: 7.6–9.2) among the uninsured house-holds in China. The proportion of househouse-holds falling below poverty line increases with the increase in the number of fifty-plus aged elderly members in households in China. Whereas, in India, percentage impoverishment effect increases with the increase in under-5 aged children in the households. Proportion household falling below poverty line due OOPHE is higher in rural India and China compared with the urban area. In China, percentage impoverishment among the household (12.3%; CI: 10.4–14.4) with inpatient care is two times more of the household (6.4%; CI: 5.7–7.3) without inpatient care. Whereas, 10.5% (CI: 8.5–13.0) household receiving inpatient care fall below poverty line in India compared with 7.6% (CI: 6.8–8.5) among the household without inpatient care received member.
The average shortfall from the poverty line (poverty gap ratio) due to OOPHE for the Chi-nese and Indian population is also presented inTable 3. The average percentage shortfall in income for the population, from the poverty line due to OOPHE is 2% (CI: 1.7–2.2) in China and 1.3% (CI: 1.1–1.5) in India. There are substantial variations based on socioeconomic char-acteristics in the countries. Among the households with an uneducated household head, the poverty gap ratio is 2.9% (CI: 2.2–3.6) in China and 1.7% (CI: 1.3–2.1) in India, respectively, compared to less than half percentage among the households with a head having at least a col-lege level education. Similarly, with the increase in household wealth status poverty gap ratio declines from 2.7% (CI: 2.1–3.2) in China and 2.1% (CI: 1.5–2.6) in India, respectively, among the poorest households to 0.8% (CI: 0.6–1.0) in China and 0.4% (CI: 0.2–0.6) in India, respec-tively, among the wealthiest households.
The poverty gap ratio is higher among those living in households headed by an elder (com-pared to a non-elderly) or having an elderly member in China. On the other hand the poverty gap ratio is higher among those living in households having at least one child in India.
In addition, the poverty gap ratio is higher among those living in rural areas in both China and India. The same is true for those living in households in which no member has health insurance in India. Similarly, the poverty gap ratio is higher among those belonging to house-holds in which a member has received in-patient care in both China and India.
Odds of Falling Below Poverty Line due to OOPHE
The adjusted socioeconomic differentials in odds of falling below poverty line due to OOPHE in China are presented inTable 4. Model-1 shows that households having a head who has com-pleted secondary school and at least college level education is 29% (OR 0.71; CI: 0.54–0.94) and 73% (OR: 0.27; CI: 0.14–0.54), respectively less likely to be impoverished than the households headed by an uneducated head. By wealth quintile, the odds of falling below poverty line due to OOPHE decreases with increases in household wealth status. Households belonging to the wealthier and wealthiest quintile, respectively, are 38% (OR: 0.62; CI: 0.41–0.94) and 60% (OR: 0.40; CI: 0.27–0.59) less likely to be impoverished compared to the poorest households.
Table 4. Odds of becoming poor due to out-of-pocket health payments by selected household characteristics, China, 2007–2010.
Model 1 Model2 Model3
Household head Education status No education 1.00 1.00 1.00
Primary 1.01(0.80,1.27) 1.02(0.81,1.29) 1.02(0.81,1.28)
Secondary 0.71**(0.54,0.94) 0.84(0.64,1.12) 0.84(0.63,1.12) College + 0.27***(0.14,0.54) 0.39**(0.19,0.79) 0.39**(0.19,0.79)
Wealth quintile Poorest 1.00 1.00 1.00
Poor 1.00(0.78,1.28) 0.94(0.72,1.22) 1.02(0.74,1.4)
Middle 0.77*(0.57,1.05) 0.72**(0.52,0.99) 0.81(0.53,1.23) Wealthier 0.62**(0.41,0.94) 0.56**(0.36,0.88) 0.56*(0.3,1.06) Wealthiest 0.40***(0.27,0.59) 0.35***(0.23,0.53) 0.48**(0.27,0.85)
Health insurance No member 1.00 1.00 1.00
Any member 1.41**(1.08,1.85) 1.13(0.81,1.59) 1.12(0.79,1.58)
Sex of the household head Male 1.00 1.00
Female 1.08(0.83,1.42) 1.08(0.83,1.42)
Age of the household head <50 years 1.00 1.00
>= 50 years 1.01(0.77,1.33) 1.01(0.77,1.33)
Fifty plus aged elderly No elderly 1.00 1.00
One elderly 1.05(0.68,1.62) 1.06(0.68,1.63)
2+ Elderly 1.29(0.79,2.1) 1.30(0.79,2.12)
Child age =<5 years No child 1.00 1.00
1+ child 1.30*(0.99,1.70) 1.30*(0.99,1.70)
Household size 1 member 1.00 1.00
2–3 members 1.06(0.77,1.45) 1.05(0.76,1.44)
4+ members 1.10(0.78,1.56) 1.09(0.77,1.54)
Place of residence Urban 1.00 1.00
Rural 1.56***(1.18,2.06) 1.56***(1.18,2.07)
Inpatient care received No 1.00 1.00
yes 2.11***(1.69,2.62) 2.56***(2.05,3.21)
Outpatient care received No 1.00 1.00
yes 1.23*(0.98,1.55) 1.33*(0.95,1.87)
Wealth quintile×Inpatient care received Poorest×Yes 1.00
Poor×Yes 0.85(0.54,1.36)
Middle×Yes 0.71(0.37,1.35)
Richer×Yes 0.91(0.44,1.90)
Richest×Yes 0.53*(0.26,1.09)
Wealth quintile×outpatient care received Poorest × Yes 1.00
Poor×Yes 0.91(0.59,1.41)
Middle×Yes 0.93(0.55,1.56)
Richer×Yes 1.01(0.6,1.70)
Richest×Yes 0.73(0.36,1.49)
Constant 0.09***(0.07,0.12) 0.05***(0.03,0.09) 0.05***(0.03,0.08)
Note *p0.10 **p0.05 ***p0.01
95% CI given in parenthesis.
insignificant as we adjust for additional demographic factors (Model 2). Final Model-3 shows that socioeconomic differential in impoverishment effect of OOPHE remains same as in Model-2. Households having one or more under-5 aged children are 1.3 times (OR: 1.30; CI: 0.99–1.70) more likely to be impoverished compared to the households without any under-5 aged children. Further, households from the rural areas are 1.56 times more likely to be impov-erished than the urban ones. Inpatient or outpatient care of the household members increases the odds of impoverishment with odds ratios being 2.56 (CI: 0.98–1.55) and 1.33 (CI: 0.95–
1.87), respectively. Interaction result shows that, wealthiest households with inpatient hospital-ization are 47% (OR: 0.53; CI: 0.26–1.09) less likely to impoverish compared to the poorest households with inpatient hospitalization.
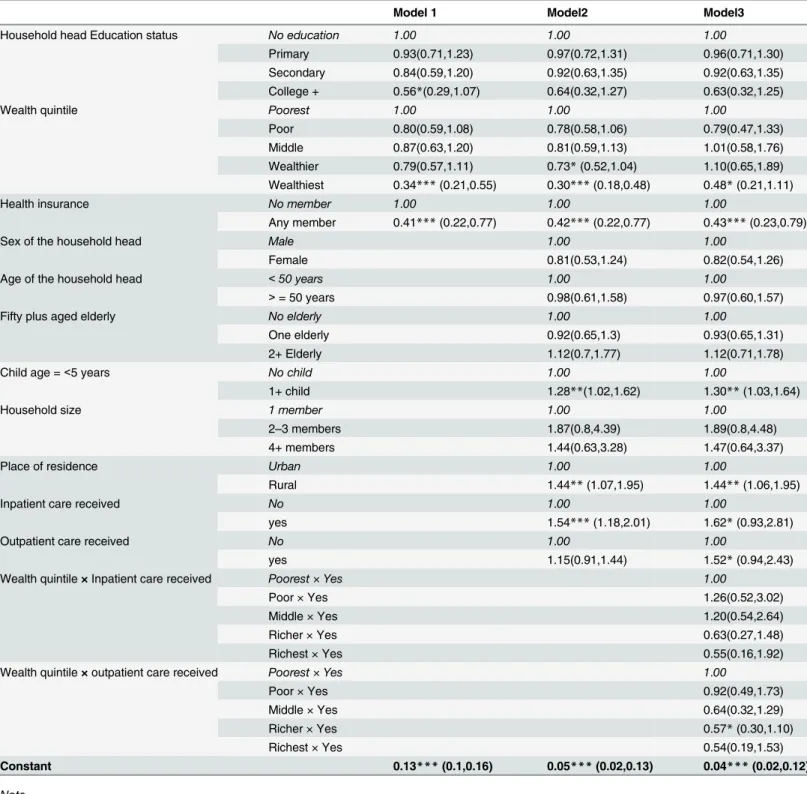
Table 5presents the adjusted socioeconomic differentials in impoverishment due to OOPHE for India. Model-1 is adjusted only for socioeconomic status, which shows that house-holds headed by a member who has completed at least a college level education are 44% (OR: 0.56; CI: 0.29–1.07) less likely to fall below poverty line compared to the households headed by an uneducated member. Compared to the poorest households, wealthiest households are 66% (OR: 0.34; CI: 0.21–0.55) less likely to be impoverished due to OOPHE.
Further, adjusting for demographic characteristics and inpatient & outpatient care of the household member in Model-2, the results show that there exists a significant economic differ-ential in impoverishment due to OOPHE. Results show that, households belonging to the wealthier and wealthiest quintile are respectively 27% (OR: 0.73; CI: 0.52–1.04) and 70% (OR: 0.30; CI: 0.18–0.48) less likely to impoverish than the poorest households. Presence of any child younger than 5-year old increases the chances (OR: 1.28; CI: 1.02–1.62) of becoming impoverished compared to no presence of under-5 children. Inpatient hospitalization of any household member increases the odds (OR: 1.54; CI: 1.18–2.01) of impoverishments.
Findings in Model-3 show that the wealthiest households are 52% (OR: 0.48; CI: 0.21–1.11) less likely to fall below the poverty line than the poorest households. Also, health insurance of any household member reduces the chance of impoverishment by 0.57% (OR: 0.41; CI: 0.23–
0.79). Rural households are 44% (OR: 1.44; CI: 1.07–1.95) more likely to fall below poverty line compared the urban households. Inpatient and outpatient care received by any household member increases the odds of impoverishment due to OOPHE, 1.62 (CI: 0.93–2.81) and 1.52 (CI: 0.94–2.43), respectively. Interaction results show that, wealthiest households with outpa-tient care received by any member are 43% (OR: 0.57; CI: 0.30–1.10) less likely to impoverish compared with the poorest household with outpatient care received.
Table 5. Odds of becoming poor due to out-of-pocket health payments by selected household characteristics, India, 2007–2010.
Model 1 Model2 Model3
Household head Education status No education 1.00 1.00 1.00
Primary 0.93(0.71,1.23) 0.97(0.72,1.31) 0.96(0.71,1.30)
Secondary 0.84(0.59,1.20) 0.92(0.63,1.35) 0.92(0.63,1.35) College + 0.56*(0.29,1.07) 0.64(0.32,1.27) 0.63(0.32,1.25)
Wealth quintile Poorest 1.00 1.00 1.00
Poor 0.80(0.59,1.08) 0.78(0.58,1.06) 0.79(0.47,1.33)
Middle 0.87(0.63,1.20) 0.81(0.59,1.13) 1.01(0.58,1.76)
Wealthier 0.79(0.57,1.11) 0.73*(0.52,1.04) 1.10(0.65,1.89) Wealthiest 0.34***(0.21,0.55) 0.30***(0.18,0.48) 0.48*(0.21,1.11)
Health insurance No member 1.00 1.00 1.00
Any member 0.41***(0.22,0.77) 0.42***(0.22,0.77) 0.43***(0.23,0.79)
Sex of the household head Male 1.00 1.00
Female 0.81(0.53,1.24) 0.82(0.54,1.26)
Age of the household head <50 years 1.00 1.00
>= 50 years 0.98(0.61,1.58) 0.97(0.60,1.57)
Fifty plus aged elderly No elderly 1.00 1.00
One elderly 0.92(0.65,1.3) 0.93(0.65,1.31)
2+ Elderly 1.12(0.7,1.77) 1.12(0.71,1.78)
Child age =<5 years No child 1.00 1.00
1+ child 1.28**(1.02,1.62) 1.30**(1.03,1.64)
Household size 1 member 1.00 1.00
2–3 members 1.87(0.8,4.39) 1.89(0.8,4.48)
4+ members 1.44(0.63,3.28) 1.47(0.64,3.37)
Place of residence Urban 1.00 1.00
Rural 1.44**(1.07,1.95) 1.44**(1.06,1.95)
Inpatient care received No 1.00 1.00
yes 1.54***(1.18,2.01) 1.62*(0.93,2.81)
Outpatient care received No 1.00 1.00
yes 1.15(0.91,1.44) 1.52*(0.94,2.43)
Wealth quintile×Inpatient care received Poorest × Yes 1.00
Poor×Yes 1.26(0.52,3.02)
Middle×Yes 1.20(0.54,2.64)
Richer×Yes 0.63(0.27,1.48)
Richest×Yes 0.55(0.16,1.92)
Wealth quintile×outpatient care received Poorest × Yes 1.00
Poor×Yes 0.92(0.49,1.73)
Middle×Yes 0.64(0.32,1.29)
Richer×Yes 0.57*(0.30,1.10)
Richest×Yes 0.54(0.19,1.53)
Constant 0.13***(0.1,0.16) 0.05***(0.02,0.13) 0.04***(0.02,0.12)
Note *p0.10 **p0.05 ***p0.01
95% CI given in parenthesis.
Discussion and Conclusions
We use data from the WHO’s Study on Global Ageing and Adult Health (SAGE) survey con-ducted during 2007–2010 to examine the socioeconomic differentials in the impoverishment effects of out-of-pocket health expenditure in China and India. We find that about 7% and 8% of the population falls below the poverty line due to OOPHE in China and India, respectively, with the proportion being significantly higher in the case of lower educational status of house-hold’s head, lower wealth status of household, residence in rural areas and in-patient care in both China and India. In addition, the proportion is higher in the case of the household head being an elder or having an elderly member in the household in China. Furthermore, having one or more child in the household increase the chances of falling below poverty line due to OOPHE in India. Under-5 children from poor households are susceptible to infections and other diseases (due to their living conditions), therefore presence of under-5 children increases the chances of health care expenditure and therefore impoverishment in India [33–35].
Our estimate of the percentage of the population that falls below the poverty line due to OOPHE for China (7.4%) is similar to the estimate of Li et al. (2012) who reported that about 7.5% of the households in China fall below the poverty line due to OOPHE [16]. This differ-ence is probably negligible and can be due to measurement error; however, it can also be due to the fact that the survey which we are using is nationally representative.
We also find that the average percentage shortfall in expenditure/income for the population from the poverty line (poverty gap ratio) due to OOPHE is 2% in China and 1.3% in India. Using National Sample Survey’s health expenditure survey 2004–05, Ghosh [8] has also shown a 1.8% poverty gap ratio for the Indian population. And, taking official poverty line Gustafsson and Li [36] estimated 3.9% poverty gap ratio in rural China. The socioeconomic differentials in poverty gap ratio are similar to the socioeconomic differentials in the proportion falling below the poverty line due to OOPHE.
Findings from the multivariate analysis indicate that lower wealth status and inpatient as well as outpatient care increase the odds of falling below poverty line significantly (with the extent much higher in the case of in-patient care) due to OOPHE in both China and India. Spe-cifically, compared to outpatient care treatment, inpatient care received by any household member has much greater odds of pushing the household into poverty. In addition, having at least an under-5 child in the household, living in rural areas and having a household head with no formal education increases the odds of falling below poverty line significantly (compared to a head with college level education) due to OOPHE in China; whereas having at least a child, not having health insurance and residing in rural areas increases the odds of becoming poor significantly due to OOPHE in India.
coverage is not universal in terms of the definition of universal health coverage put forth by WHO [15,16,39,40]. The percentage of OOPHE in China increased from 20% in 1978 to more than 60% in 2001 [16,41]. The increased breadth of coverage, combined with low benefit levels, may have actually contributed to higher utilization rates and hence to a higher burden of out-of-pocket payments [16]. Though the number of people living in absolute poverty in China dropped to 27 million in 2011; impoverishment from medical expenses are still persistent. In 2004, 23.3% of rural households were impoverished by medical expenses [16,42]. Therefore as mentioned in Li et al. (2012) the policy-makers in China should focus on designing improved insurance plans by expanding the benefit package, redesigning cost sharing arrangements and provider payment methods and developing more effective expenditure control strategies [16]. Coming to India, about 400 million people in India live on less than $1.25 per capita per day and based on our analysis these poor people on average spend 11–15% of their total expendi-ture as OOPHE. As a share of total expendiexpendi-ture, OOPHE is high and policymakers should pro-vide health insurance for the poor people in order to minimize their vulnerability to health and economic shocks. The other reason for such a high OOPHE is due to seeking care at private clinics [32,43,44]. More than three-quarters of health spending in India occurs at private facili-ties. Private facilities are chosen over public facilities because of better health infrastructure and quality of service at the private facilities. Policymakers should revamp the existing dysfunc-tional public hospitals which will help in shifting the demand from private to public hospitals and will require smaller OOPHE. More importantly, substantial investment is needed in the rural areas as more than 70% of the poverty-stricken population live in the rural areas and they are the one who are more susceptible to CHE in the absence of coping mechanisms. The imple-mentation of the National Rural Health Mission and Rashtriya Swasth BimaYojana in India are welcome steps and if implemented efficiently may reduce the vulnerability faced by these poor people.
Acknowledgments
The authors gratefully acknowledge the comments and suggestions provided by the two anony-mous reviewers on an earlier draft. These comments and suggestions have improved the paper substantially.
The findings, interpretations, and conclusions expressed in this article are entirely those of the authors and should not be associated with the affiliated institutions.
Author Contributions
Conceived and designed the experiments: KK. Performed the experiments: KK Ashish Singh SK FR Abhishek Singh UR JN PRK. Analyzed the data: KK Ashish Singh SK. Contributed reagents/materials/analysis tools: KK Ashish Singh SK FR Abhishek Singh UR JN PRK. Wrote the paper: KK Ashish Singh SK FR Abhishek Singh UR JN PRK. Final proof reading and English edition: KK Ashish Singh SK FR Abhishek Singh UR JN PRK.
References
1. Bredenkamp C, Mendola M, Gragnolati M (2011) Catastrophic and impoverishing effects of health expenditure: new evidence from the Western Balkans. Health Policy and Planning 26: 349–356. doi: 10.1093/heapol/czq070PMID:20974750
2. WHO (2014) Health financing: Health expenditure per capita Data by World Bank income group. Global Health Observatory Data Repository. Geneva: World Health Organisation.
4. Laveesh B, Peter B, Rajeev A (2010) The Impoverishing Effect of Healthcare Payments in India: New Methodology and Findings. Economic and Political Weekly XLV
5. Kawabata K, Xu K, Carrin G (2002) Preventing impoverishment through protection against catastrophic health expenditure. Bull World Health Organ 80: 612. PMID:12219150
6. Alam K, Mahal A (2014) Economic impacts of health shocks on households in low and middle income countries: a review of the literature. Global Health 10: 21. doi:10.1186/1744-8603-10-21PMID: 24708831
7. Pal R (2012) Measuring incidence of catastrophic out-of-pocket health expenditure: with application to India. Int J Health Care Finance Econ 12: 63–85. doi:10.1007/s10754-012-9103-4PMID:22351126
8. Ghosh S (2011) Catastrophic Payments and Impoverishment due to Out-of-Pocket Health Spending. Economic and Political Weekly XLVI.
9. Leive A, Xu K (2008) Coping with out-of-pocket health payments: empirical evidence from 15 African countries. Bull World Health Organ 86: 849–856. PMID:19030690
10. Kruk ME, Goldmann E, Galea S (2009) Borrowing and selling to pay for health care in low- and middle-income countries. Health Aff (Millwood) 28: 1056–1066.
11. Flores G, Krishnakumar J, O'Donnell O, van Doorslaer E (2008) Coping with health-care costs: implica-tions for the measurement of catastrophic expenditures and poverty. Health Economics 17: 1393– 1412. doi:10.1002/hec.1338PMID:18246595
12. Balarajan Y, Selvaraj S, Subramanian SV (2011) Health care and equity in India. The Lancet 377: 505–515.
13. Garg CC, Karan AK (2009) Reducing out-of-pocket expenditures to reduce poverty: a disaggregated analysis at rural-urban and state level in India. Health Policy and Planning 24: 116–128. doi:10.1093/ heapol/czn046PMID:19095685
14. Li X, Shen JJ, Lu J, Wang Y, Sun M, Li C, et al. (2013) Household catastrophic medical expenses in eastern China: determinants and policy implications. BMC Health Serv Res 13: 506. doi:10.1186/ 1472-6963-13-506PMID:24308317
15. Li Y, Wu Q, Liu C, Kang Z, Xie X, Yin H, et al. (2014) Catastrophic Health Expenditure and Rural House-hold Impoverishment in China: What Role Does the New Cooperative Health Insurance Scheme Play? PLoS ONE 9: e93253. doi:10.1371/journal.pone.0093253PMID:24714605
16. Li Y, Wu Q, Xu L, Legge D, Hao Y, Gao L, et al. (2012) Factors affecting catastrophic health expenditure and impoverishment from medical expenses in China: policy implications of universal health insurance. Bull World Health Organ 90: 664–671. doi:10.2471/BLT.12.102178PMID:22984311
17. Van Doorslaer E, O'Donnell O, Rannan-Eliya RP, Somanathan A, Adhikari SR, Garg CC, et al. (2007) Catastrophic payments for health care in Asia. Health Economics 16: 1159–1184. PMID:17311356
18. Xu K, Evans DB, Kawabata K, Zeramdini R, Klavus J, Murray CJ (2003) Household catastrophic health expenditure: a multicountry analysis. Lancet 362: 111–117. PMID:12867110
19. Van Doorslaer E, O'Donnell O, Rannan-Eliya RP, Somanathan A, Adhikari SR, Garg CC, et al. (2006) Effect of payments for health care on poverty estimates in 11 countries in Asia: an analysis of house-hold survey data. The Lancet 368: 1357–1364.
20. Kowal P, Chatterji S, Naidoo N, Biritwum R, Fan W, Lopez R, et al. (2012) Data resource profile: the World Health Organization Study on global AGEing and adult health (SAGE). Int J Epidemiol 41: 1639–1649. doi:10.1093/ije/dys210PMID:23283715
21. Xu K (2005) Distribution of health payments and catastrophic expenditures methodology Discussion Paper 2. Geneva: World Health Organization.
22. Lu C, Chin B, Li G, Murray CJ (2009) Limitations of methods for measuring out-of-pocket and cata-strophic private health expenditures. Bull World Health Organ 87: 238–244, 244a-244d. PMID: 19377721
23. Raban MZ, Dandona R, Dandona L (2013) Variations in catastrophic health expenditure estimates from household surveys in India. Bulletin of the World Health Organization 91: 726–735. doi:10.2471/ BLT.12.113100PMID:24115796
24. IIPS & WHO (2013) Study on global AGEing and adult health (SAGE) Wave 1: India National Report. India, Mumbai: International Institute for Population Sciences.
25. Haffner J, Moschel G, ten Horn GHMM (1987) Determination of the optimum Period of interview for ret-rospective collection of data. European archives of psychiatry and neurological sciences 236: 288– 293.
26. Xu K (2003) Catastrophic health expenditure. The Lancet 362: 997.
28. Van Minh H, Kim Phuong NT, Saksena P, James CD, Xu K (2013) Financial burden of household out-of pocket health expenditure in Viet Nam: Findings from the National Living Standard Survey 2002– 2010. Social Science & Medicine 96: 258–263.
29. Boing AC, Bertoldi AD, Posenato LG, Peres KG (2014) The influence of health expenditures on house-hold impoverishment in Brazil. Revista de Saúde Pública 48: 797–807. PMID:25372171
30. Su TT, Kouyate B, Flessa S (2006) Catastrophic household expenditure for health care in a low-income society: a study from Nouna District, Burkina Faso. Bull World Health Organ 84: 21–27. PMID: 16501711
31. Ruger JP, Kim HJ (2007) Out-of-pocket healthcare spending by the poor and chronically ill in the Republic of Korea. Am J Public Health 97: 804–811. PMID:17395834
32. Buigut S, Ettarh R, Amendah D (2015) Catastrophic health expenditure and its determinants in Kenya slum communities. International Journal for Equity in Health 14: 46. doi:10.1186/s12939-015-0168-9 PMID:25971679
33. Bhaskaram P (1987) Infections and malnutrition among poor children. The Indian Journal of Pediatrics 54: 535–545. PMID:3308695
34. Kanjilal B, Mazumdar P, Mukherjee M, Rahman MH (2010) Nutritional status of children in India: house-hold socio-economic condition as the contextual determinant. International Journal for Equity in Health 9: 19. doi:10.1186/1475-9276-9-19PMID:20701758
35. Pathak PK, Singh A (2011) Trends in malnutrition among children in India: Growing inequalities across different economic groups. Social Science & Medicine 73: 576–585.
36. Gustafsson B, Li S (2004) Expenditures on education and health care and poverty in rural China. China Economic Review 15: 292–301.
37. Hu S, Tang S, Liu Y, Zhao Y, Escobar M-L, Ferranti D (2008) Reform of how health care is paid for in China: challenges and opportunities. The Lancet 372: 1846–1853.
38. Barber SL, Yao L (2010) Health insurance systems in China: A briefing note. China: World Health Organization.
39. Xu K, Saksena P, Fu XZH, Lei H, Chen N, Carrin G (2009) Health Care Financing in Rural China new Rural Cooperative Medical Scheme. Geneva: World Health Organisation (WHO).
40. Meng Q, Xu L (2014) Monitoring and Evaluating Progress towards Universal Health Coverage in China. PLoS Medicine 11: e1001694. doi:10.1371/journal.pmed.1001694PMID:25243903
41. Zhang L, Liu N (2013) Health reform and out-of-pocket payments: lessons from China. Health Policy and Planning.
42. Cao S, Wang X, Wang G (2009) Lessons learned from China's fall into the poverty trap. Journal of Pol-icy Modeling 31: 298–307.
43. Nguyen H (2011) The principal-agent problems in health care: evidence from prescribing patterns of pri-vate providers in Vietnam. Health Policy and Planning 26: i53–i62. doi:10.1093/heapol/czr028PMID: 21729918