www.nat-hazards-earth-syst-sci.net/16/1699/2016/ doi:10.5194/nhess-16-1699-2016
© Author(s) 2016. CC Attribution 3.0 License.
Enhancing local action planning through quantitative flood risk
analysis: a case study in Spain
Jesica Tamara Castillo-Rodríguez1, Ignacio Escuder-Bueno1,2, Sara Perales-Momparler3, and Juan Ramón Porta-Sancho4
1Research Institute of Water and Environmental Engineering, Universitat Politècnica de València (UPV), Camino de Vera s/n, 46022 Valencia, Spain
2iPresas Risk Analysis, Avda. del Puerto 180 1B, 46023 Valencia, Spain 3Green Blue Management, Avda. del Puerto 180 1B, 46023 Valencia, Spain 4Oliva City Council, Pl. Ajuntament 1, 46780 Oliva, Spain
Correspondence to:Jesica Tamara Castillo-Rodríguez ([email protected])
Received: 25 February 2016 – Published in Nat. Hazards Earth Syst. Sci. Discuss.: 1 March 2016 Revised: 6 July 2016 – Accepted: 6 July 2016 – Published: 29 July 2016
Abstract.This article presents a method to incorporate and promote quantitative risk analysis to support local action planning against flooding. The proposed approach aims to provide a framework for local flood risk analysis, combin-ing hazard mappcombin-ing with vulnerability data to quantify risk in terms of expected annual affected population, potential in-juries, number of fatalities, and economic damages. Flood risk is estimated combining GIS data of loads, system re-sponse, and consequences and using event tree modelling for risk calculation. The study area is the city of Oliva, located on the eastern coast of Spain. Results from risk modelling have been used to inform local action planning and to as-sess the benefits of structural and non-structural risk reduc-tion measures. Results show the potential impact on risk re-duction of flood defences and improved warning communi-cation schemes through local action planning: societal flood risk (in terms of annual expected affected population) would be reduced up to 51 % by combining both structural and non-structural measures. In addition, the effect of seasonal popu-lation variability is analysed (annual expected affected pop-ulation ranges from 82 to 107 %, compared with the current situation, depending on occupancy rates in hotels and camp-sites). Results highlight the need for robust and standardized methods for urban flood risk analysis replicability at regional and national scale.
1 Introduction
Floods are among the most damaging natural disasters in Eu-rope and worldwide. In this paper, the need for improved quantitative flood risk analysis is identified, current and fu-ture challenges on flood risk reduction are acknowledged, and a framework for flood risk analysis is presented and ap-plied to a city as an example for enhanced local flood risk management.
1.1 The need
Mediter-ranean cities are particularly affected by flooding as they are located next to rivers and in lowland areas and are affected by flood events in ephemeral streams. In many Mediterranean cities, the combination of basin physical characteristics and intense and irregularly distributed rain generates frequent floods.
As an example, the Valencian region in Spain has suffered severe flood events in the last decades (Université Catholique de Louvain, 2015), such as the 1957 Turia river flood (with 77 fatalities) and the 1982 flood from failure of Tous dam (with 43 fatalities and more than 226 000 affected people).
As a result of the impact of past flood events and the need for reducing existent flood risk, the European Commission published the Directive 2007/60/EC on 6 November 2007 (European Parliament, 2007), aiming at reducing and man-aging the risks that floods pose to human health, the envi-ronment, cultural heritage, and economic activity. This direc-tive requires all member states to assess risks related to water courses and coastlines, to develop hazard and risk maps, and to apply measures to reduce flood risk.
This directive was transposed into Spanish law by Royal Decree 903/2010, “Flood risk evaluation and management”, which requires the definition of all areas with potential flood risk within the territory. This decree establishes the content of hazard and risk maps, along with flood risk management plans at river basin scale.
More particularly, in the Valencian region, the regional government developed PATRICOVA (Territorial Action Plan for Flood Risk Prevention) in 2003, a preventive tool with recommended actions for urban planning and flood risk re-duction. Municipalities classified at medium and high flood risk levels are required to develop local action plans for flood risk management (in Spanish, “Planes de Actuación Mu-nicipal ante el Riesgo de Inundaciones”, herein denoted as PAMRI by its acronym). PATRICOVA has been recently up-dated in 2015, incorporating new legislation and integrating recent advances in cartography.
Despite recent legislation and work conducted on flood risk management, there is still a need for local flood risk analyses to complete those developed at regional scale, to inform action planning, and to better orientate risk reduction actions at urban scale. In most cases, despite some exemp-tions found in the literature such as guidance and examples of micro-scale flood risk assessment carried out e.g. in Eng-land and Wales (Penning-Rowsell et al., 2013), there is a lack of applications of risk analysis techniques at local scale or the required level of detail to support decision-making on local flood risk reduction and planning.
1.2 The challenge
Flood risk management has acquired an important role since the European Floods Directive (Directive 2007/60/EC) and global strategies for flood risk reduction have evolved from focusing mainly on reducing the hazard (structural measures)
to more holistic approaches, including the combination of both hazard and impact mitigation.
Different approaches for flood risk analysis can be found in the literature, including societal (Jonkman et al., 2008) and economic risks (Merz et al., 2010), and ranging from local (Marcotullio and McGranahan, 2006) to global scale (Winsemius et al., 2013).
“Think globally, act locally”, the famous phrase attributed to René Dubos during the UN Conference on the Human En-vironment in 1972, emphasizes the importance of scale in dealing with environmental challenges. Unique physical, cli-matic, and cultural conditions appear at local scale and site-specific flood risk management is needed.
In the Valencian region, only 18 out of 136 local action plans for flood risk management have been developed and approved up to date. Despite the publication of some rec-ommendations by civil protection on how to perform these plans, local authorities do not have the information, know-how, or experience of the required flood risk analyses to be developed.
The city of Oliva, located on the eastern coast of Spain, be-longs to the group of municipalities within medium to high flood risk levels. Located 70 km from Valencia, Oliva is af-fected by pluvial, river, and coastal flooding and it is charac-terized by a complex and wide-ranging geography (e.g. hills up to 460 m.a.s.l., plains, coastal areas, and wetlands). In ad-dition, there is high seasonal variation in population (with 27 127 and 55 174 inhabitants of resident and seasonal popu-lation, respectively, distributed across 60.1 km2).
Twenty-eight years after the largest flood event in modern times in Oliva (accounting for the highest recorded rainfall rate at the Iberian Peninsula with 817 mm in 24 h), local au-thorities face the challenge of mitigating flood risk through the development and implementation of a local action plan (as required by regional legislation), in line with other exis-tent and ongoing structural measures for flood risk reduction. Local and regional authorities stand at the front line of re-ducing the vulnerability of their territory to natural hazards and impacts of climate change (Mayors Adapt, 2015). In this context, quantitative flood risk analysis arises as a helpful tool to support management actions and strategies.
1.3 The opportunity
paper aims to present a framework for local flood risk analy-sis and its application to a real case to show how local flood risk management strategies may benefit from risk analysis. This paper analyses the city of Oliva (Spain) as an example. Although flood hazard mapping is available, a quantitative flood risk analysis had never been performed. The presented study is being used as a basis for developing a local action plan against flood risk.
This “science for policy” paradigm can be considered as a “lighthouse” example for other cities in Spain that are re-quired to develop their corresponding plans. Examples can be found in the literature on examples of the benefits of research for policy and practice for flood risk management (Klijn and Schweckendiek, 2012). The study shows how flood proba-bility, exposure, and vulnerability analyses provide valuable information for the development of a local action plan against flooding, for example by characterizing the impact on risk of improved warning systems and public education campaigns.
2 Approach
In this section, the applied framework (including tools and methods) for flood risk analysis is described. This framework for flood risk analysis is based on the method proposed by (Escuder-Bueno et al., 2012), through the use of a risk model which incorporates all information regarding loads, system response, and flood consequences, and adapted to integrate GIS data into risk modelling. Figure 1 shows the flowchart summarizing data, methods, and tools within the presented framework.
Potential applications include local flood risk assessments such as those required by regional and national legislation in Spain after the 2007 European Floods Directive.
Examples of such structured frameworks for flood risk analysis for other hazard types such as flooding from moun-tain rivers or landslides can be found in the literature (Fell et al., 2008; Mazzorana et al., 2013), as a means to enhance flood risk analysis processes.
The steps of the proposed framework include – phase I: scope of the case study
– phase II: review of available data
– phase III: study of the system situation and definition of the base case
– phase IV: flood events to be analysed – phase V: risk model architecture – phase VI: input data for the risk model – phase VII: risk calculation
– phase VIII: risk representation – phase IX: risk evaluation
– phase X: study of risk reduction measures. 2.1 Phase I: scope of the case study
The proposed framework aims at estimating flood risk in ur-ban areas in terms of affected population, potential injuries, fatalities, and economic costs resulting from damage to as-sets and infrastructure. It can be applied to analyse existent risk or to compare different scenarios to evaluate the impact of risk reduction measures.
The level of detail of the required analysis will depend on the scope and scale of decisions for flood risk management. 2.2 Phase II: review of available data
Information on hydrologic studies, hydraulic modelling, flood defence response, population, and land use data is re-quired for characterizing loads, system response, and esti-mating consequences from flooding.
GIS data on flood characteristics (e.g. flood depth, veloc-ity, flooded area) and population and land uses are required to apply the procedure proposed in Fig. 1. In recent years, more detailed and up-to-date GIS-based data are available, thus al-lowing a more accurate estimation of flood hazard, exposure, and vulnerability.
2.3 Phase III: study of the system situation: definition of the base case
The base case corresponds with the benchmark scenario. The benchmark scenario should represent the system situation, incorporating existing structural and non-structural measure for flood risk reduction and system characteristics in terms of exposure and vulnerability. Therefore, it is of high im-portance to define not only the benchmark scenario but also those after implementing planned risk mitigation actions, to be compared with the base case. Examples of scenario build-ing processes for flood risk analysis from mountain rivers are found in Mazzorana et al. (2012, 2013).
2.4 Phase IV: flood events to be analysed
The range of all potential flood events should be considered, obtained from hydrologic studies and analysed through hy-draulic simulations to characterize system response and flood characteristics.
Flood defence reliability should be incorporated, when possible, into hydraulic modelling to analyse the existent protection level and the impact on flood characteristics of their performance (failure and non-failure cases of flood pro-tection infrastructure).
Land use data Hydraulic modelling
Population data
Vulnerable areas
iPresas UrbanSimp
AP,NI,N,D Rainfall-runoff
modelling MDT
Hazard
Vulnerability and exposure
Risk model architecture
Other factors for consequence
estimation
Affected population AP
Hazard rate HR = y · (v + 0.5) + DF
Area vulnerability factor AV
Population vulnerability factor Y
Life-loss N = NI · FR Fatality rate
FR = 2 · HR
Number of injured people NI = AP · HR · AV · Y
Affected area per land use type AF
Percentage of damage PD = f(y)
Reference cost per land use type CR
Total damages D = CD + CI
Indirect costs CI = fc · CD
Direct costs CD = AF · PD · CR
GIS-data
Annual expected risk
Hazard maps
Tool/model Flood defense
infrastructures
Vulnerability and exposure maps
Risk maps
Input data
Flood frequency
System response
Seasonal probabilities
gvSIG Consequence estimation
FN graphs
Legend
Figure 1.Flowchart of data and models.
2.5 Phase V: risk model architecture
The use of risk models provides a logic and mathematically rigorous framework for compiling information of the system to estimate flood risk (Castillo-Rodriguez et al., 2014).
The risk model can be represented by an influence diagram composed by nodes and connectors (Serrano-Lombillo et al., 2011). Nodes include information on loads (e.g. annualized probabilities of flood events), system response (failure prob-abilities of flood defence infrastructures, e.g. dam or levee breach), or consequences (e.g. results from consequence es-timations in terms of affected population or economic dam-ages).
In this paper, two generic schemes for defining the risk model architecture are proposed and shown in Fig. 3. The first scheme (model “a”) can be used for analysing flood risk for urban areas affected by river flooding from non-regulated systems. The second scheme (model “b”) should be used when potential failure of a flood defence (e.g. a dam) is in-corporated into the analysis.
These two generic influence diagrams are an adapted ver-sion of those proposed by Castillo-Rodriguez et al. (2014).
1
10
100
1000
1 10 100 1000
10000
10000 Ti
AEPi
AEPi-1
Pi=AEPi-1-AEPi
AEP0
AEPn
T AEP
Tn+1
Pn+1=AEPn-0
Figure 2.Generic division of the analysed range of flood events.
Moment
Season
Floods Respons AP NI N D
Moment
Season
Floods
Response
AP_F NI_F N_F D_F
NOL
Gate op. Routing
AP_NoF NI_NoF N_NoF D_NoF
Q Failure Failure
No failure
Figure 3.Generic risk model architecture: non-regulated river system(a)and regulated river system(b).
Valencia
Oliva
¯
0 125 250 500Km0 1020 40Km
Figure 4.Location of the case study area at national (left) and
re-gional (right) scale.
For the first influence diagram (model “a”), proposed to analyse flood risk in non-regulated systems, the following nodes are considered.
– Moment: this node includes information on probabili-ties for different time periods during the day (i.e. the probability of being during the day or at night). It can be used to later incorporate daily variability on potential consequences (e.g. affected population in industrial ar-eas might change depending on the moment of the day). – Season: this node includes information on probabilities for different seasonal periods during the year (i.e. the probability of being in summer or winter season). It can be used to later incorporate seasonal variability on po-tential consequences (e.g. affected population in urban areas might change when resident or potential popula-tion during summer is considered).
– Flood events: this node includes information on proba-bilities for different flood events. A range of flood events is established, defined by minimum and maximum re-turn periods. This range is divided into a number of in-tervals (e.g. 10, 20). Figure 2 shows how the range of plausible flood events is divided into intervals for risk calculations. These intervals are equally spaced in loga-rithmic scale along the given range of return periods.
Each interval is represented by an AEP, obtained by deducting AEP values of low and high interval limits. The example shows a range from 1- to 1000-year flood events into 10 intervals. An additional interval is added to include flood events that exceed the 1000-year return period.
– System response: this node includes information on sys-tem response (e.g. peak flow river discharges).
– Affected population, number of injured people, poten-tial fatalities, and economic costs: these nodes include information on consequence estimation in terms of af-fected population (AP), injuries (NI), fatalities (N), and economic damages in the urban area (D) respectively. Estimations for different flood events are obtained and incorporated into the risk model in each node.
For the second influence diagram (model “b”), proposed to analyse flood risk in a regulated river system with a dam, the following nodes are considered.
– Moment, season, and flood events: these nodes are equivalent to the aforementioned described for the first influence diagram.
– Normal operating level (NOL): this node includes the water level at the reservoir in normal situation. For sim-plicity, it is assumed that this level is constant.
– Gate operability: this node includes probabilities for each possible combination of gate operability (number of gates functioning correctly for flood routing when the flood arrives) for dams with controlled outlet works. – Routing: this node refers to results from the technique
outcomes from flood routing analysis are required: the maximum water pool level at the reservoir and result-ing peak flow discharge through outlet works for each combination.
– System response: for each load combination (repre-sented by a maximum water pool level from flood rout-ing), this node is used to consider two possible sit-uations: failure and non-failure of the flood defence system, with complementary conditional probabilities of occurrence for each load combination. Hence, two branches emerge from this node to consider both op-tions.
– Failure and non-failure hydrographs: these nodes in-clude information on peak flow discharges resulting from flood defense failure or non-failure cases (i.e. peak flow discharges from flood routing).
– Affected population, number of injured people, po-tential fatalities, and economic costs: these nodes in-clude information on consequence estimation in terms of affected population, injuries, fatalities, and economic damages in the urban area for flood events resulting from flood defense failure (upper branch) and non-failure cases (lower branch).
2.6 Phase VI: input data for the risk model
A GIS-based tool is proposed for input data processing. The tool, named gvSIG Desktop (www.gvsig.com), is an open-source software, GNU/GPL license, with free use, distri-bution, study, and improvement. Recently, gvSIG has been graduated as an OSGeo project (Open Source Geospatial Foundation). This GIS software tool was first developed by the regional government of the Valencian Autonomous Re-gion (to be widely implemented in their reRe-gional and local systems) and now is further developed and promoted by the gvSIG Association.
The use of other available GIS tools can be applied within this framework (e.g. qGIS). In this paper, gvSIG has been applied since it is being used by local governments in Spain. In this paper, the procedure shown in Fig. 1 is proposed to integrate GIS data into the risk model in phase VII. This procedure shows the required steps to estimate flood con-sequences and to provide input data for the risk model in terms of affected population, potential injuries, and fatalities and damage costs at local scale. This GIS-based procedure aims at boosting implementation of risk-informed local ac-tion plans through standardized consequence estimaac-tion and risk calculation.
The information required includes the following.
– Hydrological and hydraulic modelling: flood character-istics should be estimated for each cell on the map rep-resenting the study area for different floods (a range of flood events with return periods up to, at least, 500-year
is recommended). Two maps are required showing in-undation depths and flow velocities for each cell. – Consequence estimation: several types of consequences
per cell on the map are obtained. The impacts are then aggregated at municipality scale. The impacts include population exposed to flooding, injuries, potential fatal-ities, and economic damages.
– Affected population should be obtained using cen-sus data (resident and seasonal population) and in-formation on occupancy rates in hotels, campsites, etc. Accuracy and precision on population distribu-tion is of high importance to enhance risk estimates. Detailed knowledge of population distribution and variability will help to better define potential sce-narios (day/night, seasonal and/or spatial variabil-ity).
– The life-loss estimation method proposed by MA-GRAMA (Spanish Ministry of Agriculture, Food, and Environment) for developing risk analysis at river basin scale is used. This method is based on the methodology proposed by DEFRA (Depart-ment for Environ(Depart-ment, Food, and Rural Affairs). Recent flood risk analyses have been conducted in Spain by applying this methodology, as for ex-ample in the Ebro River basin (PREEMPT project “Policy-relevant assessment of socioeconomic ef-fects of droughts and floods”). For a detailed de-scription on the method for estimating potential fa-talities, the reader is referred to DEFRA (2006). – Economic damage estimation is based on the
method used in PATRICOVA (Generalitat Valen-ciana, 2015). Potential direct economic damage costs are obtained using information on land use categories to define asset values and applying a depth–damage function, which estimates the ex-pected damage for a given inundation depth. – Risk modelling: input data on floods (exceedance
prob-abilities), river discharge (system response), and esti-mated consequences (aggregated outcomes at munici-pality scale from GIS data) are incorporated into the risk model to estimate societal and economic risk in terms of annual expected impacts.
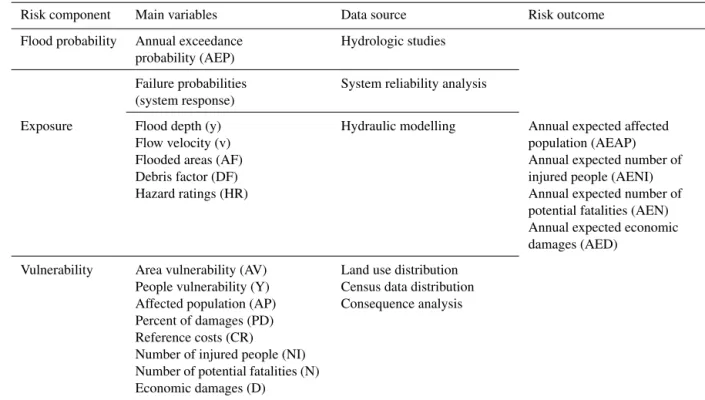
Table 1 shows a summary of most relevant variables and data sources for flood risk analysis based on the presented frame-work in Fig. 1.
2.7 Phase VII: risk calculation
Table 1.Summary table of main variables and outcomes used in the presented framework for flood risk analysis.
Risk component Main variables Data source Risk outcome
Flood probability Annual exceedance
probability (AEP)
Hydrologic studies
Failure probabilities (system response)
System reliability analysis
Exposure Flood depth (y)
Flow velocity (v) Flooded areas (AF) Debris factor (DF) Hazard ratings (HR)
Hydraulic modelling Annual expected affected
population (AEAP) Annual expected number of injured people (AENI) Annual expected number of potential fatalities (AEN) Annual expected economic damages (AED)
Vulnerability Area vulnerability (AV)
People vulnerability (Y) Affected population (AP) Percent of damages (PD) Reference costs (CR)
Number of injured people (NI) Number of potential fatalities (N) Economic damages (D)
Land use distribution Census data distribution Consequence analysis
tool is a simplified version of iPresas Calc, first developed by the Polytechnic University of Valencia (UPV) and now by iPresas Risk Analysis (spin-off company of UPV). iPresas Calc is a software tool that combines input data on flood hazard and impact to obtain expected annual risk (Serrano-Lombillo et al., 2011). Risk, in terms of expected annual so-cietal or economic risk, is calculated by developing the event tree that considers all combinations of events that may lead to flooding.
In this paper, flood risk is defined as the combination of the probability of a damaging flood event and potential conse-quences (Gouldby and Samuels, 2005; Schanze, 2006). Risk is estimated as the expected annual average damage of flood-ing in terms of societal or economic consequences. Hence, risk is obtained in terms of expected annual population af-fected (EAPA), number of injuries (EANI), fatalities (EAF), and damage costs (EAD). The iPresas UrbanSimp software tool estimates risk by developing the event tree that includes all combinations of flood events, system response, and re-lated consequences.
Although there are examples of flood risk analysis ap-proaches which include economic, social, and environmental risks (Meyer et al., 2009), conducting a quantitative analy-sis of environmental risks was out of scope of this research work. In contrast, societal risk is considered based on a three-fold perspective: potential affected population, injured, and fatalities.
2.8 Phase VIII: risk representation
Risk can be represented in F-N curves. The area under the curve is the annual expected number of fatalities, where the horizontal axis represents the level of consequences (e.g. number of fatalities, denoted as N) and the vertical axis rep-resents the annual cumulative probability of exceedance (F) of each level of consequences.
Other type of consequences can be represented. These curves are then called F-D or F-AP, by representing eco-nomic costs due to damages (D) or affected population (AP) respectively.
2.9 Phase IX: risk evaluation
Risk outcomes can be compared with tolerability recom-mendations (when available), thus enabling one to analyse whether risk reduction measures are justified or not when evaluated in contrast with proposed criteria. Generalized frameworks for risk evaluation can be found in the literature (UK Health and Safety Executive, 2001). However, there still is a lack of tolerability criteria applied at local scale, although some recent examples can be found (Miller et al., 2015).
(attributed to the failure of the infrastructure), may not be ap-plied when analysing flood risks in total terms (due to all po-tential flood events from both failure and non-failure cases).
2.10 Phase X: study of risk reduction measures
Once risk is obtained for the base case, other scenarios can be analysed to evaluate the impact of risk reduction measures. New input data on loads, system response, or consequences should be required and incorporated into the risk model. Risk outcomes for the new scenario are then compared with results for the base case.
Regarding evaluation of risk reduction measures, ap-proaches such as cost–benefit analysis (CBA) and multi-criteria analysis (MCA) are commonly used for analysing investment projects, required by law or promoted through guidelines (EC, 2014). In contrast to CBA, which is legally prescribed in some countries (for example in the Netherlands or the United Kingdom), MCA is not widely established, al-though some examples can be found. For example, project selection for public works in Italy and acquisition of data-processing equipment or consulting services by public ad-ministration in Spain have to be conducted based on MCA (Gamper and Turcanu, 2007).
In dam safety management, the use of risk indicators that consider efficiency and equity principles is common, evalu-ating societal and economic risk reduction and costs of mea-sures. The adjusted cost per statistical life saved (ACSLS) indicator is commonly used for evaluating dam risk reduc-tion measures (Morales-Torres et al., 2016).
3 Case study analysis
An example of how the framework described in Sect.2 can be applied is included in this section. The results have been used to guide the development and implementation of a local action plan for flood risk management.
3.1 Phase I: scope of the case study
The municipality of Oliva is located on the eastern coast of Spain (Fig. 4), has about 27 127 inhabitants (distributed in several urbanized areas) and covers a total area of 60.1 km2. The heaviest daily precipitations historically observed in Spain concentrate mainly on the coastal Mediterranean zone. Indeed, Oliva accounts for the most extreme daily precip-itation record in the Iberian Peninsula with 817 mm on 3 November 1987 (Ramis et al., 2013).
The mean annual precipitation reaches 850 mm. Flood events concentrate mainly during the rainy season from Au-gust to November. Table 2 shows a summary of most relevant flood events in Oliva.
The system is characterized by multiple river courses and brooks, with complex interconnections and a varying topog-raphy, including lowland areas and hills up to 460 m a.s.l.
A dam is currently under construction in Rambla Gallinera river course (a 62.5 m high concrete gravity dam, with a to-tal reservoir capacity of 6.13 hm3at dam crest level). Civil works started in 2010 (including river embankments, diver-sion of secondary brooks to Rambla Gallinera river course, and dam construction), but they are not finished yet. The dam will provide flood protection up to a return period of 10 years (Hijós Bitrián et al., 2010) and significant reduction on the peak flow discharges at this river course up to 56 % (50-year flood event). Discharges are also attenuated for floods with higher return periods, with a minimum reduction of 8.6 % (5000-year flood).
Oliva is composed by several urbanized areas distributed within the municipality. The main area is located in the north-western part, concentrating 84.6 % residential popula-tion (59.6 % seasonal populapopula-tion). However, other areas lo-cated along the coast are relevant as population may increase by 23 times in some districts.
The selection of this study area is based on several rea-sons. First, the intensity and frequency of past flood events in the region are relevant. Second, good-quality and up-to-date data are available on hazard, population, and land use mapping. Additionally, the impact of structural and non-structural flood risk reduction measures has not been quanti-fied so far. Finally, local authorities are currently involved in the process of developing the Municipal Action Plan against Flood Risk (denoted as PAMRI).
3.2 Phase II: review of available data
Population and land use data are GIS based. These data, vided by local government, are based on a yearly survey pro-moted by the regional government for all municipalities with less than 50 000 inhabitants (hereafter EIEL database, by its acronym in Spanish). The municipality is distributed in 9324 and 16 131 parcels of urban and rural land respectively.
The EIEL database includes resident and seasonal popula-tion: “resident population” is obtained from census data and “seasonal population” is estimated from demographic trends observed in the last years during the summer season. It in-cludes both resident and occasional population (but does not include hotel and campsite occupancy). For this analysis, the summer period ranges from mid-April to mid-September.
This database is completed with observations during site visits and other inputs from local authorities.
3.3 Phase III: study of the system situation: definition of the base case
Four scenarios are considered for flood risk analysis as fol-lows.
Table 2.Summary of recent (most relevant) flood events for the case study.
Date (dd-mm-yyyy) 03-11-1987 04-12-1997 29-11-1972 18-06-1997 30-03-2002 11-09-1996 05-05-2002
Precipitation in 24 h (mm) 817 378 354 288 220 197 188
Table 3.Simulated peak flow discharges per river course (SOBEK
model) (m3s−1).
Current situation Structural measures
(scenario 0) (scenario 1)
Return period (years)
River course 25 100 500 25 100 500
Piles 84 153 247 84 153 247
Fonts 54 107 186 54 107 186
Algepsar 7 11 23 7 11 23
Frares 4 7 16 4 7 16
Alfadalí 21 34 82 21 34 82
Cementeri 2 4 8 2 4 8
Gallinera 282 462 1025 182 284 829
Benirrama 16 28 63 16 28 63
Bullent 102 173 399 102 173 399
Molinell 84 146 318 84 146 318
– Implementation of structural measures (scenario 1): this scenario represents the situation after implementing structural measures for flood risk reduction, including dam construction. Differences in peak flow discharges in Rambla Gallinera are shown in Table 3 (e.g. from 282 to 182 m3s−1for a 25-year flood event).
– Implementation of a local action plan (scenario 2): this scenario represents the situation after implementing a local action plan against flooding (PAMRI), which in-cludes improved warning and communication schemes, public education campaigns and training of all actors involved in emergency management.
– Implementation of both local action plan and struc-tural measures (scenario 3): this scenario represents the situation after implementing both structural and non-structural measures.
3.4 Phase IV: flood events to be analysed
The regional plan PATRICOVA defines six flood hazard lev-els (denoted from NP1 to NP6) based on probability of flood occurrence (return periods of 25, 100, or 500 years) and in-undation depth (above/below 0.8 m). Flood hazard levels in Oliva were obtained in 2002 from an inundation study at regional scale and reviewed in 2013 (adding a new level to identify geomorphological hazards). However, resolution of GIS data used for the regional plan is too low (scale was 1 : 50 000 in 2002 and 1 : 25 000 for the updated version in
2013). In addition, the recent review did not consider new and ongoing structural actions for flood risk reduction.
In this paper, we used inundation data from a hydraulic model developed in 2010 by ACUAMED (Aguas de las Cuencas Mediterráneas S.A., public corporation and instru-ment of the Ministry of Agriculture, Food, and Environinstru-ment for Mediterranean River Basin Development Programme) and updated by TYPSA (consulting firm) in 2012 with a DEM (digital elevation model) with a 5 m horizontal reso-lution derived from lidar (light detection and ranging or laser imaging, detection, and ranging) and corrected by site mea-sures. However, only three flood events were modelled (re-turn periods of 25, 100, and 500 years). Table 3 shows peak flow discharges for two scenarios: current situation (sce-nario 0) and after implementing structural flood risk reduc-tion measures including the dam under construcreduc-tion (sce-nario 1).
3.5 Phase V: risk model architecture
For this case study, the risk model architecture shown in Fig. 5 is used. Dam failure flood events are not modelled. Flood characteristics after dam construction (scenario 1) are considered based on flood routing analysis.
In order to determine societal or economic risk, the choice of a wide range of flood events is important. However, avail-ability covers 25 to 500 years. Vulneravail-ability was estimated for 25-, 100-, and 500-year flood events, based on the pro-posed framework in Sect. 2.
Given the discrete set of flood events, the range of plau-sible flood events is divided into 20 intervals, obtaining ex-pected damage for each interval by interpolating input data for the three available events.
The impact of a 1-year flood event is assumed to be 0 for the current situation (scenario 0). A flood protection level of 10 years is considered for scenarios 1 and 3.
3.6 Phase VI: input data for the risk model
Concerning flood probability estimation, inundation maps with results from a 2-D hydraulic model in SOBEK (a mod-elling suite developed by Deltares), with runoff rates from HEC-HMS (developed by the US Army Corps of Engineers, USACE) are used. These maps are raster based, with a spatial resolution of 20 m×20 m. Data on flood depth and velocity
supplemen-Cons_D Cons_NI Cons_N
Cons_AP Response
Floods Season
Figure 5.Risk model architecture for the case study of Oliva using iPresas UrbanSimp software tool.
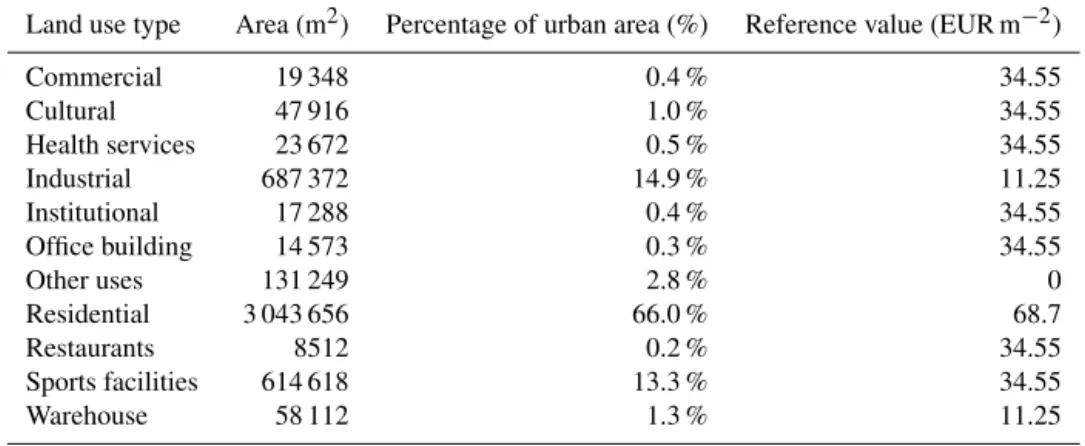
Table 4.Summary of land use types for the case study (non-urbanized areas were also analysed but not included in this table).
Land use type Area (m2) Percentage of urban area (%) Reference value (EUR m−2)
Commercial 19 348 0.4 % 34.55
Cultural 47 916 1.0 % 34.55
Health services 23 672 0.5 % 34.55
Industrial 687 372 14.9 % 11.25
Institutional 17 288 0.4 % 34.55
Office building 14 573 0.3 % 34.55
Other uses 131 249 2.8 % 0
Residential 3 043 656 66.0 % 68.7
Restaurants 8512 0.2 % 34.55
Sports facilities 614 618 13.3 % 34.55
Warehouse 58 112 1.3 % 11.25
0 1250 2500 5000 7500 10 000
m
CS_NP1 (T=25 yr; y>0.8 m)
CS_NP2 (T=100 yr; y>0.8 m)
CS_NP3 (T=25 yr; y<0.8 m)
CS_NP4 (T=100 yr; y<0.8 m)
CS_NP5 (T=500 yr; y>0.8 m)
CS_NP6 (T=500 yr; y<0.8 m)
Urban clusters
Municipal term
±
Figure 6.Hazard level map for scenario 0 (current situation).
tary material for the current situation. The hazard level map for the current situation is also shown in Fig. 6.
Results from hazard analysis show that 10 % of resident population is located in low-frequency flood areas, against a 15 % of resident population located in high-frequency areas (25-year flood event). Around 14 000 are located in NP1 ar-eas, “high frequency–high flood depth” category (flood depth greater than 0.8 m for the 25-year flood event).
Regarding consequence estimation, the municipality is di-vided into urban and rural parcel sub-areas and information from EIEL database is available in GIS format.
The number of resident and potential (seasonal) inhabi-tants in each parcel is obtained by multiplying the number of registered households and the corresponding density value (inhabitants/household). In addition, population in camping areas and hotels is considered based on the maximum capac-ity and hotel occupancy rates in the Valencian region (2013 Database from National Statistics Institute). These rates are
assumed to be, on average, 35 and 75 % in winter and sum-mer seasons respectively. Table 4 summarizes the results of affected population. A 500-year flood has a 0.2 % probabil-ity of occurring in any given year and affect cause roughly 22 890 people during summer season for scenario 0.
Estimation of potential life loss is based on the method proposed by DEFRA (DEFRA, 2006). The number of fatal-ities is a function of the number of injuries and the hazard rating, where the number of injuries is estimated by combin-ing the followcombin-ing factors:
– number of people within the hazard zone;
– hazard rating, which combines flood characteristics (flood depth, flow velocity, and debris factor);
– area vulnerability, the function of effectiveness of flood warning, speed of onset of flooding, and nature of area (including types of buildings); and
– people vulnerability, the function of presence of people who are very old and/or infirm/disabled/long-term sick. The following assumptions for the case study analysis are considered:
– an average debris factor (DF) equal to 0.5 is used to estimate hazard rates;
– a vulnerability area factor (AV) equal to 6, 7, and 8 is used for multi-storey buildings, residential areas, and campsites respectively;
– a population vulnerability factor (Y) of 0.2 is used based
We calculated the potential direct economic damage using information on land use classes (a summary is included in Table 5), reference asset values, and a generic depth–damage function (denoted as CS in Fig. 8), which estimates the ex-pected damage for a given inundation depth. Direct costs are obtained by multiplying percent of damage (based on flood depth), flooded area (in m2), and reference cost (in monetary terms per m2).
It is essential to adjust asset values to the regional eco-nomic situation and property characteristics (Jongman et al., 2012). Therefore, asset values and a generic stage damage function used in regional studies for flood risk planning are considered in this case study (Generalitat Valenciana, 2015). A sensitivity analysis has been included to analyse their pact on results. Different stage damage functions would im-pact on consequence estimation results as later described in Sect. 4.
Other direct costs such as destruction of vehicles, damage to infrastructure, and livestock or business interruption are not considered. Indirect costs are considered based on fac-tors used by regional planning (Generalitat (Generalitat Va-lenciana, 2015), set as 7 % of direct costs for the city of in-cludes aspects such as population, employment, and number of households within the urban area). Total costs are obtained by adding direct and indirect costs for each affected parcel.
Table 6 summarizes the results of consequence estimation. A 500-year flood could cause roughly nine potential fatalities and EUR 52 million for scenario 0.
The impact of implementing a local action plan against flooding (PAMRI) is analysed based on the following changes on consequence estimation from improved warning systems and communication schemes.
– A lower rate of AV is considered. Hence, values change to AV=5 in urbanized areas with multi-storey
build-ings, AV=6 in residential areas, and AV=7 in
camp-sites.
– A reduction on economic damages is assumed based on damage avoided when a warning lead time of at least 2 h is provided. For a 80 % rate of warning coverage (proportion of covered properties), 100 % rate of ser-vice effectiveness (proportion of flooded serser-viced prop-erties that were sent a timely, accurate, and reliable flood warning), 80 % rate of availability (proportion of flooded services properties that received warning), 85 % rate for ability (proportion of residents able to under-stand and respond to such a warning), and 85 % rate for effective action (proportion willing to take effective action or which have actually taken effective action), a percentage of damage reduction of 18 % is assumed for flood depths below 1.2 m (Parker et al., 2005).
3.7 Phase VII: risk calculation
The iPresas UrbanSimp software tool is used to estimate risk by developing the event tree that includes all combinations of flood events, system response, and related consequences.
Table 6 shows results in terms of expected annual popula-tion affected (AEAP), number of injuries (AENI), fatalities (AEF), and damage (AED). Risk outcomes for the current situation show societal risk levels up to 2370 of annual ex-pected affected population and 0.56 fatalities per year. Con-siderable risk reduction can be achieved by implementing planned structural measures (scenario 1); thus societal risk would be reduced to 1168 inhabitants per year (AEAP) and 0.28 fatalities per year (AEF). Affected population remains equal after implementing local action planning (scenario 2) but societal risk in terms of potential fatalities would be re-duced to 0.48 fatalities per year.
In addition, results reflect the combined effect of both structural and non-structural measures (scenario 3). Societal risk after dam construction and implementation of the local action plan might change from 0.56 to 0.24 fatalities per year. Economic risk in terms of annual expected damages would vary from 6.11 to EUR 1.89 million yr−1.
It is noted that at this stage, only direct benefits (such as the reduction in flood damage and improved warning systems) are included in the analysis of the impact of implementing a local action plan. Other benefits such as improved risk aware-ness or reduction on economic damages to vehicles and local businesses could be considered in future analyses.
3.8 Phase VIII: risk representation
Figure 7 shows F-AP, F-N, and F-D curves for all scenar-ios. The first graph depicts the cumulative annual exceedance probability (F) of each level of potential affected population (AP). Results show that there is a probability of 10−2of
ex-ceeding 8300 affected people due to flooding for the sce-nario with structural measures. This value is higher when considering the current situation, with approx. 11 300 af-fected people for the same probability. The second graph depicts the cumulative annual exceedance probability (F) of each level of potential fatalities (N). Results show that there is a probability of 10−2of exceeding three fatalities for
the current situation (scenario 0). This value decreases af-ter implementing structural measures (scenario 1) to approx. 2 and up to 1.6 for combined structural and non-structural measures (scenario 3). The third graph shows potential eco-nomic damages (D) with a probability of 10−2of exceeding
EUR 28 million for the current situation (scenario 0). This value might decrease up to approx. EUR 17 million after im-plementing combined structural and non-structural measures (scenario 3).
Table 5.Estimated impact per scenario and flood event.
Season Return period (years) Current situation (scenario 0) Structural measures (scenario 1) AP NI N D (million EUR) AP NI N D (million EUR)
Summer (seasonal population) 25 7795 85 2 10.86 5596 59 1 5.27
100 13 269 158 3 22.20 9850 109 2 12.15
500 22 890 341 9 52.03 18 754 270 7 42.39
Winter (resident population) 25 1873 25 1 10.86 1572 22 0 5.27
100 3428 51 1 22.20 2539 35 1 12.15
500 6282 110 3 52.03 4497 80 2 42.39
Return period (years) Local action plan (scenario 2) Structural measures and local action plan (scenario 3)
AP NI N D (million EUR) AP NI N D (million EUR)
Summer (seasonal population) 25 7795 73 1 9.91 5596 51 1 4.73
100 13 269 136 3 20.26 9850 94 2 10.95
500 22 890 293 8 47.61 18 754 232 6 38.92
Winter (resident population) 25 1873 22 0 9.91 1572 19 0 4.73
100 3428 44 1 20.26 2539 30 1 10.95
500 6282 95 3 47.61 4497 69 2 38.92
Note: AP is affected population; NI is the number of injured people; N is fatalities; D is damage costs in million EUR.
Table 6.Results from risk model per scenarios CS, BC, and effect of local action plan.
Current situation (scenario 0)
Structural measures (scenario 1)
Local action plan (scenario 2)
Structural measures and local action plan (scenario 3)
Societal risk (AEAP) [inhabitants yr−1]
2370 1168 2370 1168
Societal risk (AENI) [injured inhabitants yr−1]
28 21 24 18
Societal risk (AEN) [fatalities yr−1]
0.56 0.28 0.48 0.24
Economic risk (AED) [million EUR yr−1]
6.11 2.10 5.57 1.89
Note: AE is annual expected; AP is affected population; NI is number of injured people; N is fatalities; D is damage costs.
RISKMAP project (Fuchs et al., 2009; Meyer et al., 2012) have been considered for elaborating these maps. An exam-ple is provided as Supexam-plement to this paper (affected popula-tion for the 500-year flood event for the current situapopula-tion).
3.9 Phase IX: risk evaluation
Tolerability recommendations are not considered for this case study since there are no proposed criteria or guidelines at regional or national level in Spain.
3.10 Phase X: study of risk reduction measures
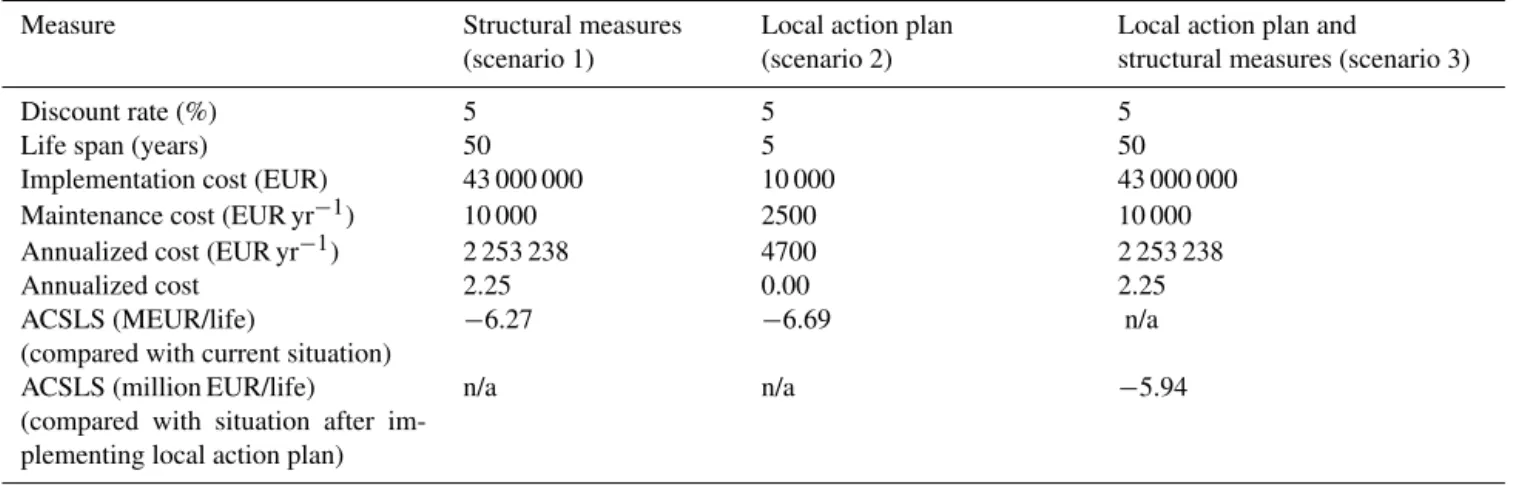
The ACSLS indicator is obtained to evaluate cost-efficiency of analysed measures. Table 7 shows implementation, main-tenance, and annualized costs for considered measures (local action plan and structural measures including dam construc-tion). Results show that any of these measures would be
justi-fied in terms of efficiency on risk reduction since results show negative values (reduction of economic risk is higher than annualized costs). After implementing the local action plan (lowest ACSLS value), the resulting ACSLS indicator still remains negative when risks before and after implementing structural measures are compared, thus supporting the deci-sion of also implementing planned structural measures.
4 Sensitivity analysis
Table 7.Results from evaluation of risk reduction measures.
Measure Structural measures
(scenario 1)
Local action plan (scenario 2)
Local action plan and
structural measures (scenario 3)
Discount rate (%) 5 5 5
Life span (years) 50 5 50
Implementation cost (EUR) 43 000 000 10 000 43 000 000
Maintenance cost (EUR yr−1) 10 000 2500 10 000
Annualized cost (EUR yr−1) 2 253 238 4700 2 253 238
Annualized cost 2.25 0.00 2.25
ACSLS (MEUR/life)
(compared with current situation) −
6.27 −6.69 n/a
ACSLS (million EUR/life)
(compared with situation after im-plementing local action plan)
n/a n/a −5.94
Note: ACSLS is adjusted cost per statistical life saved; n/a is not applicable.
Table 8.Effect of the selection of flood protection level.
Oliva (scenario 0: CS) Valencia (region) Comparison local / region
Flood Societal risk Economic Societal risk Economic %AEAP %AED
protection (AEAP) risk (AED) (AEAP) risk (AED)
level (years) (inhabitants yr−1) (million EUR yr−1) (inhabitants yr−1) (million EUR yr−1)
1 2370 6.11 No data No data – –
2 2279 5.88 47 600 746.24 4.8 % 0.8 %
5 1991 5.16 29 000 537.94 6.7 % 0.9 %
10 1557 4.07 15 800 348.04 9.8 % 1.2 %
Note: CS is the current situation; AEAP is annual expected affected population; AED is annual expected damage costs.
4.1 Effect of selected flood protection level
In general, a flood protection level represents how well pro-tected any given area is against flood damage. For example, a 10-year flood protection system protects an area against any-thing equal to or smaller than a 10-year flood.
Risk analysis for the current situation has been performed by assuming that flood damage is zero for a 1-year flood event. In this section, the effect of such assumption is anal-ysed.
As an example, results from Aqueduct Global Analyzer Database at regional scale are available for different protec-tion levels. Model setup, results, and limitaprotec-tions of avail-able estimations in this database can be found in Ward et al. (2013b) and Winsemius et al. (2013). Table 8 shows the results for the Valencian region from this database, account-ing that there is a region-wide average protection level of 2-, 5-, and 10-year respectively.
Risk estimations for the current situation have been ob-tained for three different protection levels (i.e. assuming that flood damage is zero for 2-, 5-, and 10-year flood events) and are also summarized in Table 8.
Results show that societal risk in terms of AEAP would change from 2370 to 1557 inhabitants/year if a 10-year
pro-tection level is assumed. Since there is no information on system response for flood events with low return periods (hy-draulic modelling was conducted from 25 up to 500-year flood events), it is noted that risk estimated for the current situation might be overestimated for this case study. Further research on system response for high-frequency flood events would be of paramount interest.
We highlight that societal risk for the city of Oliva repre-sents a significant percentage of total flood risk at regional scale when results are compared with those presented by Aqueduct Global Analyzer Database. Despite accounting for 1 % of resident population at regional level, societal risk ranges from 5 to 10 %, depending on the protection level, as shown in Table 8.
Results from local flood risk analyses, as described in this paper, can be used to validate/update available information in global databases.
4.2 Effect of including seasonal population variability on societal risk
102 103 104 105
10-4
10-3
10-2
10-1
100
10-1 100 101 102
10-4
10-3
10-2
10-1
100
100 101 102
10-4
10-3
10-2
10-1
100
Annua
l e
xc
ee
da
nc
e pr
oba
bi
lit
y of
AP
, (
F)
Annua
l e
xc
ee
da
nc
e pr
oba
bi
lit
y of
N, (
F)
Annua
l e
xc
ee
da
nc
e pr
oba
bi
lit
y of
M
EUR
, (
F)
BC BC+PAMRI CS CS+PAMRI
BC BC+PAMRI CS CS+PAMRI
BC BC+PAMRI CS CS+PAMRI Potential fatalities (N) Affected Population (AP)
Costs (MEUR)
Figure 7.Extract of F-AP, F-N, and F-D curves for the case study:
scenarios 0 (current situation), scenario 1 (PAMRI=local action
plan), scenario 2 (structural measures), and scenario 3 (PAMRI and structural measures).
– occupation rates set to 0, in which only census data and people in dispersed housing are used for estimating pop-ulation at risk;
– occupation rates set to maximum plausible values (50 % in winter and 100 % in summer).
Incorporating the above input data on consequence esti-mation into the risk model, societal risk results for these two scenarios show that values would range from 1940 af-fected population yr−1 and 0.38 lives yr−1 (low occupancy)
to 2529 affected population yr−1 and 0.63 lives yr−1 (high
occupancy). Results show that affected population increases in 450 inhabitants yr−1 when comparing zero occupancy’s
results to the current situation’s results.
These results show the importance of not only analysing census data but also considering potential population in ho-tels and campsites. This population group is of high relevance in tourist cities, as it is the case on the Mediterranean coast of Spain.
4.3 Effect of population trends on societal risk
Flood risk in the future can be influenced either by climate change, which may increase or decrease the frequency and severity of flooding, or by socioeconomic changes, such as ageing population (or decline) and economic growth.
In this section, socioeconomic change is considered. The database of shared socioeconomic pathways developed by IIASA (International Institute for Applied Systems Analy-sis) is used for defining population trends in Oliva, based on national population trends for Spain in 2030 and 2050 (Na-kicenovic et al., 2013). This database has been also used in recent local flood risk assessments (Ward et al., 2013a) in Europe.
For the current situation, resident and seasonal populations are increased by a factor of 1.06 and 1.13 in 2030 and 2050 respectively. Estimating societal risk for these two scenar-ios, risk would range from 2370 affected population yr−1and
0.56 lives yr−1 (current situation) to 2616 affected
popula-tion yr−1and 0.61 lives yr−1in 2050.
Results show that attention should be paid on future popu-lation trends and urban developments to update vulnerability assessments.
4.4 Effect of selection of depth–damage curves and asset values on economic risk
Table 9.Reference costs in EUR m−2in urban areas: GVA (2015) and MAGRAMA (2013).
Land use type Warehouse Commercial Cultural Industrial Office Households Health services Agricultural
GVA 11.25 34.55 34.55 11.25 34.55 68.7 34.55 0.8
MAGRAMA 150 380 200 450 380 350 200 5
0 % 10 % 20 % 30 % 40 % 50 % 60 % 70 % 80 % 90 % 100 %
0 1 2 3 4 5
Dam
ag
e
(%)
Depth (m)
CS
HYDROTEC
MAGRAMA
EGM-s tructure
Figure 8.Examples of depth–damage functions compared to
func-tion used for the case study analysis (CS).
– MAGRAMA, the stage damage function proposed by MAGRAMA for flood risk analysis and mapping at river basin scale (MAGRAMA, 2013);
– EGM, the stage damage function proposed by USACE, based on empirical data from flood events from 1995 to 1997, developed for nation-wide applicability in flood damage reduction studies (USACE, 2000);
– HYDROTEC, a simple curve used for some flood action plans in Germany (Merz and Thieken, 2009).
These generalized functions represent some of the existent depth damage curves for assessing urban flood damage. From results shown in Fig. 8 and compared with other depth– damage functions in the literature, it is noted that CS and MAGRAMA curves may tend to overestimate costs. How-ever, both curves include content damage in reference costs to be multiplied by damage percentages; thus no additional costs to content should be considered.
Depth–damage functions should ideally be developed for specific characteristics of local building types. Some exam-ples of site-specific stage damage functions in Spain can be found (Velasco et al., 2015). However, the development of synthetic curves for each urban area requires an exhaustive
field work, data gathering, and later analysis, which is not feasible in many cases.
Defining regionally specific stage damage functions for most relevant land use types would be desirable and useful for comparison among cities. In addition, detailed local data on building types (not available for this study) would be of interest to estimate direct flood damages in future analyses.
Reference values per land use type used for this case study correspond with rates proposed in PATRICOVA (Generalitat Valenciana, 2015). Direct costs for cleanup expenses, emer-gency prevention actions, and other related costs are not in-cluded. Table 9 shows reference values per land use type pro-posed by MAGRAMA for river basin flood risk analysis and mapping. These rates include replacement costs for infras-tructure, content, and vehicles. Therefore, reference values differ from those proposed in PATRICOVA (Generalitat Va-lenciana, 2015).
By matching land use categories defined by both sources (Generalitat Valenciana, 2015; MAGRAMA, 2013), risk is estimated for the current situation by adopting new reference costs and the stage damage function shown in Fig. 8.
It is noted that economic risk outcomes are highly sensitive to the stage damage function and reference values adopted, since economic risk would increase from EUR 6.11 million yr−1 (for the current situation) to
EUR 180.4 million yr−1 (for the current situation, but using
proposed values by MAGRAMA). These results show the need for standardized stage damage functions and reference asset values in Spain.
5 Discussion
5.1 Limitations
The analysis framework used in this study is relatively straightforward, but it does allow one to analyse risk and to assess the impact of different scenarios. It is proposed as a framework for enhancing local flood risk analysis at regional and national scale, potentially transferable to other local ap-plications in Europe.
However, the following remarks are made.
– Type of flooding: in this paper, we analysed river flood-ing but integratflood-ing multiple hazards would be of great interest in future upgrades (e.g. to analyse the influence of sea water levels in boundary conditions).
– Flood hazard: it is recognized that overestimations of annual risk between 33 and 100 % have been reported in other studies when only three return periods are used (Ward et al., 2011). Therefore, results suggest that results for the case study could benefit from paying more attention to the potential damage caused by probability flood events. As shown in Sect. 4.1, high-probability flood event analysis would help to better adjust existing protection levels and would be of in-terest for future upgrades (e.g. return periods of 5 and 10 years).
– Economic consequence estimation: a generic relative stage damage function is used for the case study, based on methods used for regional planning. In addition, due to the lack of statistical information on building-specific asset values, available rates by land use type have been used in this analysis, although more suitable for macro-scale flood damage evaluations. As shown in Sect.4.4, information on building typology at micro-scale would be of interest for future upgrades.
– Life-loss estimation: sources of uncertainty include lack of data on detailed building typology (to better es-timate area vulnerability), human behaviour, and ef-fectiveness of warning systems, among other factors. Sensitivity analyses indicate that societal risk for this case study is dominated by population concentrated in highly vulnerable areas and seasonal variability. As shown in Sect. 4.2, societal risk may range from 1940 affected population yr−1 (low occupancy) to 2529
af-fected population yr−1 (high occupancy), thus
requir-ing good knowledge of population variations durrequir-ing the year.
– Vulnerability: other factors influence flood damage, such as flow velocity, contamination, building materials and quality, etc., but are not considered in this analysis, since there is no available information on detailed build-ing typology nor site-specific vulnerability functions to incorporate the impact of flow velocity or debris flow. In
future upgrades, it would be of interest to analyse vul-nerability including such factors, as analysed for other cases in Europe (Quan-Luna et al., 2011; Totschnig and Fuchs, 2013).
5.2 Recommendations for flood risk analysis
Based on results from this analysis, we recommend that quantitative risk analyses become the basis for developing lo-cal flood risk management plans. Specific recommendations include the following.
– Upgrading hydraulic modelling to a broad set of flood events for hazard mapping and analysing not only river flooding but also pluvial or coastal flooding. As shown in Sect. 4.1, flood hazard mapping should be performed for high-probability flood events.
– Improved data gathering on population characteristics and distribution at local scale. As shown in Sect. 4.2, de-tailed information on population distribution and vari-ability is required to better analyse risk, including daily and seasonal variations.
– Improved land use data gathering at local scale for bet-ter analyse life-loss and economic consequences from flooding. As shown in Sect. 4.4, obtaining detailed data on building and asset characteristics would enable eco-nomic consequence analysis at micro-scale then im-proving the definition of asset values and better estimat-ing economic risks.
– Defining standardized relative stage damage functions and reference costs at national scale. As shown in Sect. 4.4, both local and river basin flood risk analysis should consider the same method for economic conse-quence estimation to allow comparative analysis, to up-grade current and future flood risk plans, and to develop cost-benefit analysis for prioritizing flood risk reduction measures.
– Characterizing risk awareness and better analysing ef-fectiveness of evacuation procedures in case of emer-gency by incorporating outcomes from social research (as, for example, described in Escuder-Bueno et al., 2012) towards a multi-disciplinary paradigm (including technical, policy, and social aspects).
5.3 Local action planning implications
Results from the case study demonstrate its applicability and usefulness to support decision making for local action plan-ning. As described in Sect. 3.10, implementation costs are lower than benefits in terms of economic risk reduction (AC-SLS values are negative).
The application of the proposed framework for quantify-ing local flood risk for the city of Oliva represents a novel analysis in Spain.
The following recommendations were made to local au-thorities for defining strategies for local action planning, de-rived from outcomes of conducted flood risk analysis.
– Definition of specific public education campaigns for resident and seasonal population, with emphasis in high vulnerable groups (e.g. the elderly, schools, and camp-sites), as described in Sect. 3.6, lower vulnerable rates are assumed for scenarios 2 and 3. This assumption should be supported by better public education and warning schemes.
– Definition of a procedure to formally reporting flood events, damages, and effect of communication and evac-uations procedure is required for future updates of haz-ard and vulnerability analysis. This would enable to val-idate assumptions concerning the impact on flood con-sequences (lower area vulnerability and damages) of implementing the local action plan.
– Verification of established communication schemes be-tween regional and local authorities and with emergency and civil protection services is needed to ensure effec-tiveness of non-structural measures for flood risk re-duction (reduced damages bases on available warning times).
– Identification of potential locations for assembly points and helicopter landing sites have been set based on pop-ulation clusters, hazard maps, and available evacuation routes; developed risk maps (examples are included in Supplement) were used to identify potential locations. These sites should be verified and reviewed in future updates.
– Data gathering on additional urban characteristics (e.g. building typology, daily variability of population in in-dustrial and commercial areas) would upgrade risk anal-yses and provide improved outcomes for decision mak-ing. As shown in Sect. 4.2., societal risk is highly influ-enced by seasonal variability.
– Impact of future flood risk mitigation measures: as shown in Sect. 3.10, new risk reduction measures might be planned and evaluated in accordance with the AC-SLS indicator (e.g. aiming at reducing annual expected affected population). The proposed framework for flood
risk analysis will allow updating in future reviews of the local action plan.
Up to now, risk reduction actions were focused on reducing flood hazard and exposure. All the aforementioned recom-mendations are provided to enhance flood risk management from a broader perspective towards smart flood risk gover-nance (including hazard, exposure, and vulnerability anal-ysis, as part of a risk-informed and collaborative decision-making process for local flood risk management).
6 Conclusions and the way forward
Quantification of societal and economic flood risk is not re-quired by current legislation in Spain and is relatively novel in local flood risk management as a result of a lack of guid-ance, standardized methods, or tools for local flood risk anal-ysis. Examples can be found in other countries such as in England and Wales (Hall et al., 2003) but are still scarcely applied in Spain.
The main scope of this study was to propose a common framework for quantitative flood risk analysis at local scale and to analyse urban flood risk for the city of Oliva.
Local authorities are currently developing the local action plan against flooding for Oliva, as required by regional legis-lation. Results from the flood risk analysis described in this paper have informed local authorities to define strategies and to make decisions on upcoming public education campaigns and training activities. In addition, assembly and monitor-ing points have been identified based on conducted flood risk analyses and identified hazard levels.
Results show that societal and economic risks, while con-siderably reduced from planned structural measures (a dam is now under construction), are still significant, but they can be further reduced through local action planning.
The results of this study show that improved communi-cations schemes and verified warning systems could signifi-cantly decrease flood risk. These results can be used to sup-port risk communication and increase risk awareness.
Sensitivity of existent flood risk to vulnerability estima-tions has been addressed and future scenarios have been com-pared with the current situation.
Existent hazard maps have been used for identifying af-fected areas. A broad range of hydraulic simulations, cover-ing five to seven return periods, would be desirable (Ward et al., 2011). In addition, further research to analyse dam fail-ure scenarios and the impact of climate change on system response is recommended.
for other hazard types), towards a comprehensive and multi-hazard flood risk analysis.
Further research on the impact on risk of mitigation mea-sures (including data gathering through workshops or sur-veys) could inform local actors on the definition of incentives for flood risk mitigation.
The presented approach can be potentially applied by other cities to perform similar flood risk analysis. There is still a long way to go in the development and implementation of lo-cal action plans against flooding. The study described in this paper aims to become a reference example for other cities towards improved flood risk management.
7 Code and data availability
iPresas UrbanSimp is available for download at www. ipresas.com.
Flood hazard maps and the local action plan are available to the public at www.oliva.es (in Spanish). GIS-based local data are not publicly accessible due to its protection level (owned by local authorities).
Team list
Jesica T. Castillo-Rodríguez: civil engineer (EQF7, 2008) and MEng in hydraulic engineering and environment (EQF7, 2012); researcher and PhD student at the (Polytechnic Uni-versity of Valencia, UPV), with more than 5 years of re-search experience in flood risk analysis and risk-informed dam safety management, through several national and EU-funded research projects and private contracts, as well as de-veloping local action plans against flood risk. She is currently developing her PhD on the application of risk analysis tech-niques toward an integrated flood risk management by incor-porating multiple hazards (natural and manmade risks).
Ignacio Escuder-Bueno: MSCE in civil engineer-ing (1996) and PhD (2001); professor at the Universitat Politècnica de València (UPV), and promoter and founder associate of iPresas (a technology based spin-off company of the UPV); secretary-general of the International Com-mission on Large Dams (ICOLD) European Club since 2010 and full elected member of the Spanish National Committee on Large Dams (SPANCOLD) since 2007; visiting professor at the University of Maryland (2014) and Utah State University (2006) and teaching assistant at the University of Wisconsin (1995–1996); coordinator of national and EU-funded research projects on risk analysis, critical infrastructure management, and energy efficiency (e.g. E2STORMED).
Sara Perales-Momparler: civil engineer (EQF7, 2002) and PhD (2015) from the Polytechnic University of Valencia (UPV); independent consultant (Green Blue Management) and director of PMEnginyeria, consultancy firm specialized in sustainable drainage systems (SuDS), from 2006 to 2013.
She worked for Sinclair Knight Merz (SKM), an interna-tional consultancy firm, both in the United Kingdom and New Zealand from 2004 to 2006 and has participated in several EU-funded research projects on flood risk analy-sis, SuDS, water, and energy efficiency (e.g. AQUAVAL, E2STORMED).
Juan Ramón Porta Sancho: bachelor’s degree in technical architecture (EQF6, 1983 and 2011) and master’s degree in urban emergency prevention and management (1992) from the Polytechnic University of Valencia (UPV); technical ar-chitect at the Oliva City Council since 1992; head of Urban Management and Civil Protection Division; he has coordi-nated and supervised urban planning studies and works for nearly 30 years (co-author of the Territorial Emergency Plan of Oliva, 1994), and, more recently, projects for implement-ing GIS-based systems at local scale and flood risk studies in Oliva; he is currently coordinating the development of the Municipal Action Plan against Flood Risk for the city of Oliva, as technical director. He has also participated in several EU-funded research projects (e.g. QUATER, DAM-AGE).
The Supplement related to this article is available online at doi:10.5194/nhess-16-1699-2016-supplement.
Author contributions. Jesica Tamara Castillo-Rodríguez and
Ig-nacio Escuder-Bueno proposed the method and tools for flood risk analysis. Jesica Tamara Castillo-Rodríguez performed analy-ses and prepared the manuscript, in close collaboration with all co-authors (discussion of methods and tools, results and conclu-sions). Sara Perales-Momparler has developed the Local Action Plan (PAMRI) for the city of Oliva including outcomes from this study, following a risk-informed approach, with contributions of all co-authors in a joint science–policy effort. Juan Ramón Porta-Sancho has contributed to the acquisition, analysis of data, and in-terpretation of results and supervised all activities concerning the development and approval of the Local Action Plan (PAMRI).
Acknowledgements. This research was conducted within the
framework of the INICIA project, funded by the Spanish Ministry of Economy and Competitiveness (BIA2013-48157-C2-1-R). The article processing charges for this open-access publication will be covered by the INICIA project. We would like to thank the city of Oliva for their willingness to share data, knowledge, and experience with the authors and for initiating this risk-informed journey.
Edited by: S. Fuchs