www.nat-hazards-earth-syst-sci.net/10/465/2010/ © Author(s) 2010. This work is distributed under the Creative Commons Attribution 3.0 License.
and Earth
System Sciences
Societal landslide and flood risk in Italy
P. Salvati, C. Bianchi, M. Rossi, and F. Guzzetti
Istituto di Ricerca per la Protezione Idrogeologica, Consiglio Nazionale delle Ricerche, via Madonna Alta 126, 06128 Perugia, Italy
Received: 5 January 2010 – Accepted: 24 February 2010 – Published: 16 March 2010
Abstract. We assessed societal landslide and flood risk to the population of Italy. The assessment was conducted at the national (synoptic) and at the regional scales. For the as-sessment, we used an improved version of the catalogue of historical landslide and flood events that have resulted in loss of life, missing persons, injuries and homelessness in Italy, from 1850 to 2008. This is the recent portion of a larger catalogue spanning the 1941-year period from 68 to 2008. We started by discussing uncertainty and completeness in the historical catalogue, and we performed an analysis of the temporal and geographical pattern of harmful landslide and flood events, in Italy. We found that sites affected by harm-ful landslides or floods are not distributed evenly in Italy, and we attributed the differences to different physiographi-cal settings. To determine societal risk, we investigated the distribution of the number of landslide and flood casualties (deaths, missing persons, and injured people) in Italy, and in the 20 Italian Regions. Using order statistics, we found that the intensity of a landslide or flood event – measured by the total number of casualties in the event – follows a general negative power law trend. Next, we modelled the empirical distributions of the frequency of landslide and flood events with casualties in Italy and in each Region using a Zipf dis-tribution. We used the scaling exponentsof the probability mass function (PMF) of the intensity of the events, which controls the proportion of small, medium, and large events, to compare societal risk levels in different geographical areas and for different periods. Lastly, to consider the frequency of the events with casualties, we scaled the PMF obtained for the individual Regions to the total number of events in each Region, in the period 1950–2008, and we used the results to rank societal landslide and flood risk in Italy. We found that in the considered period societal landslide risk is largest in Trentino-Alto Adige and Campania, and societal flood risk is highest in Piedmont and Sicily.
Correspondence to:P. Salvati ([email protected])
1 Introduction
The purpose of risk analysis is to determine the probability that a specific hazard will cause harm. This can be achieved by investigating the frequency of the damaging events and the intensity of the consequences. The number of fatalities (deaths and missing persons) and the number of casualties (deaths, missing persons, and injured people) are a direct, quantitative measure of the intensity of a disaster, and can be used to evaluate individual and societal risk quantitatively (Fell and Hartford, 1997; Guzzetti et al., 2005a, b).
Individual-risk criteria are expressed using mortality (or death) rates, which are a measure of the number of fatali-ties in a population, scaled to the size of the population, per unit time. Typically, when studying natural or technological hazards, the number of deaths per 100 000 people in a period of one year gives mortality. Societal-risk criteria are estab-lished constructing frequency-consequences plots, on which the number of losses in each event is plotted versus the fre-quency of the event, and investigating the relationships be-tween the frequency of the events and their intensity (Fell and Hartford, 1997; Guzzetti et al., 2005a, b).
In Italy, landslides and floods kill or injure people almost every year. For this country, individual and societal landslide risk levels were defined by Guzzetti (2000), and revised by Salvati et al. (2003) and Guzzetti et al. (2005a, b). Flood risk levels were established by Salvati et al. (2003), and revised by Guzzetti et al. (2005a, b). We use an improved version of the catalogue of landslides and floods with human conse-quences in Italy (Salvati et al., 2003; Guzzetti et al., 2005a, b) to update the existing national estimates, and to obtain first regional estimates, of societal landslide and flood risk in Italy.
and injured people) in Italy, and in the 20 Italian Regions. Then, modelling the empirical distributions of the frequency of the landslide and flood events with casualties, we deter-mine societal risk levels in Italy and in each Region, and we rank the Regions on their landslide and flood risk to the population. We conclude by discussing the results obtained, in view of their geomorphological (hydrological, geological) relevance.
2 New catalogue of landslides and floods with human consequences in Italy
In Italy, information exists on the direct damage to the population caused by different natural hazards, including landslides and floods (Guzzetti, 2000; Salvati et al., 2003; Guzzetti et al., 2005a, b). For this work, we have updated the catalogue of landslides and floods with direct human conse-quences in Italy compiled by Salvati et al. (2003), and revised by Guzzetti et al. (2005b). The new catalogue covers the 1941-year period from 68 to 2008, and lists 3139 landslide events and 2595 flood events that have resulted in deaths, missing persons, injured people, and homelessness.
To update the historical catalogue, we searched new bib-liographical and archive sources, we examined five regional catalogues of historical landslide and flood events available on the Internet, and we re-examined some of the sources of information used by Salvati et al. (2003) and Guzzetti et al. (2005b), including the national catalogue of landslide and flood events in Italy (Guzzetti et al., 1994; Guzzetti and Tonelli, 2004). The new sources of historical information include regional and local history books, transcriptions or translations of old chronicles, and reports prepared by re-gional and local technical offices to describe the effects of single events and their consequences. The old chronicles provided information on events in the early part of the cat-alogue, chiefly for limited geographical areas. The five re-gional catalogues provided abundant and accurate informa-tion on the date of occurrence of the events, the exact or ap-proximate location of the events, and the type and the extent of the damage. The event reports provided accurate infor-mation for a limited number of events. For a few individual events, new or updated information was obtained searching the Internet.
2.1 Uncertainty in the historical information
For some event in the catalogue, uncertainty exists on the consequences. For a few events, a discrepancy exists in the number of deaths, missing persons, injured people and home-less reported by different sources. The differences depend primarily on the fact that the exact number of the conse-quences is often available only at the end of a search-and-rescue operation, from a few days to weeks after the onset of the event. During this period, newspapers and even official
reports may provide different and changing figures. Simi-larly, the location of a few fatal events is uncertain, depend-ing on the fact that the site where people were hit by a land-slide or overrun by an inundation, and the location where the bodies were found, are different and distant.
In the catalogue, information on the location and damage caused by recent landslide and flood events is generally accu-rate. Geographical accuracy decreases going back in the past. Historical documents and chronicles were more accurate in providing figures for the casualties caused by landslides, than those caused by floods. Mass movements were easier than in-undations to identify geographically, chiefly because the spa-tial extent of the damage caused by landslides is more limited than the damage caused by floods. Even though landslides that occurred on slopes were undoubtedly reported as such, recognition of an event as a landslide was not always easy, particularly in the oldest reports. The definition of the type of event was more uncertain when the mass movement was a debris flow, or if it occurred along the drainage network. When widespread (regional) flooding caused fatalities, a total (cumulative) number was given, including deaths caused by others hazardous events e.g., diseases, famine. When a rain-fall event affected a large geographical area, producing both landslides and floods, the effects of landslides were some-times confused with the effects of flooding, and only the lat-ter were reported (Guzzetti, 2000; Guzzetti et al., 2005b).
A few landslides, including the failure of natural dams, and of man-made dams and embankments, caused rapid flooding that resulted in fatalities. Following Guzzetti et al. (2005b), the damage caused by these failures was consid-ered the indirect effect of single landslides, and the causal-ities were listed in the landslide catalogue. In the period 1521–2008, 14 landslide events resulted in indirect flood ca-sualties. Of these events, five (0.4%) occurred in the pe-riod 1850–2008. We take this as an indication that landslide events with indirect flood casualties are uncommon in Italy.
For the very old events in the catalogue, it was not pos-sible to quantify the number of deaths caused by the fatal events. For these uncertain events, the sources of informa-tion provide a qualitative descripinforma-tion of the number of fatal-ities defining them as few, several, many or hundreds. This has introduced further uncertainty in the catalogue.
2.2 Temporal analysis and completeness of the catalogue
In the catalogue, the first landslide for which the exact num-ber of casualties is known (24 deaths) occurred in 843 in the Piedmont Region. For floods, the oldest event for which the (approximate) number of casualties is listed (1000 deaths) occurred in 671 in the Lombardy Region.
0 2000 4000 6000 8000 10000 0 500 1000 1500 2000 2500 1 8 6 0 1 8 8 0 1 9 0 0 1 9 2 0 1 9 4 0 1 9 6 0 1 9 8 0 2 0 0 0 C u m u la ti v e n u m b e r o f c a s u a lt ie s N u m b e r o f c a s u a lt ie s p e r y e a r B Vajont 9/10/1963 Salerno 25/10/1954 Stava 19/7/1985 Salerno 26/3/1924 Sarno 5/5/1998 Cetara 24/10/1910 0 1000 2000 3000 4000 5000 6000 0 100 200 300 400 500 600 1 8 6 0 1 8 8 0 1 9 0 0 1 9 2 0 1 9 4 0 1 9 6 0 1 9 8 0 2 0 0 0 C u m u la ti v e n u m b e r o f c a s u a lt ie s N u m b e r o f c a s u a lt ie s p e r y e a r F Florence 4-9/11/1966 Gleno Dam
1/12/192320/10/1953Calabria
Polesine 18/11/1951 Alessandria 13/8/1935 Modica 26/9/1902 Licata 11/1915 Cagliari 20/10/1892 Benevento 13/9/1857 Piedmont 5/11/1994 C u m u la ti v e n u m b e r o f c a s u a lt ie s 0 2000 4000 6000 8000 10000 12000 14000 16000 0 500 1000 1500 2000 2500 8 0 0 1 0 0 0 1 2 0 0 1 4 0 0 1 6 0 0 1 8 0 0 2 0 0 0 N u m b e r o f c a s u a lt ie s p e r y e a r A Vajont 9/10/1963 Gravedona 6/6/1313 Passer Valley 22/9/1419 Piuro 2/9/1618 Montepiano 24/6/1765 Ischia 7/1228 E 0 5000 10000 15000 20000 25000 30000 35000 40000 45000 0 3000 6000 9000 12000 15000 18000 6 0 0 8 0 0 1 0 0 0 1 2 0 0 1 4 0 0 1 6 0 0 1 8 0 0 2 0 0 0 C u m u la ti v e n u m b e r o f c a s u a lt ie s N u m b e r o f c a s u a lt ie s p e r y e a r Po Valley 1705 Rome 8/10/1530 Palermo 24/9/1557 Florence 4/11/1333 Sarnico 671 Ceva 13/1/1610 Rome 24/12/1598 1 10 100 1000 10000 1 10 100 1000 10000 8 0 0 1 0 0 0 1 2 0 0 1 4 0 0 1 6 0 0 1 8 0 0 2 0 0 0 N u m b e r o f c a s u a lt ie s p e r e v e n t C 1 10 100 1000 10000 1 10 100 1000 10000 N u m b e r o f c a s u a lt ie s p e r e v e nt 1 8 6 0 1 8 8 0 1 9 0 0 1 9 2 0 1 9 4 0 1 9 6 0 1 9 8 0 2 0 0 0 D 1 10 100 1000 10000 100000 1 10 100 1000 10000 100000 6 0 0 8 0 0 1 0 0 0 1 2 0 0 1 4 0 0 1 6 0 0 1 8 0 0 2 0 0 0 N u m b e r o f c a s u a lt ie s p e r e v e n t G 1 10 100 1000 1 10 100 1000 1 8 6 0 1 8 8 0 1 9 0 0 1 9 2 0 1 9 4 0 1 9 6 0 1 9 8 0 2 0 0 0 N u m b e r o f c a s u a lt ie s p e r e v e n t H FLOODS LANDSLIDES
Fig. 1.Historical distribution of landslide and flood events with casualties in Italy. Data for landslides (A–D) and for floods (E–H) are shown
separately. In A, B for landslides, and E, F for floods, bars show the number of casualties per year, and dashed lines show the cumulative number of casualties. Plots C, D for landslides, and G, H for floods show the number of casualties per event. Different time intervals are shown: A and C (landslides), 800–2008; E and G (floods), 600–2008; B and D (landslides), F and H (floods), 1850–2008.
period 671–2008, the catalogue lists 1263 flood events that have resulted in at least 42 845 casualties. The total num-ber of homeless and evacuated people caused both by land-slides and floods in the 1338-year period 671–2008 exceeded
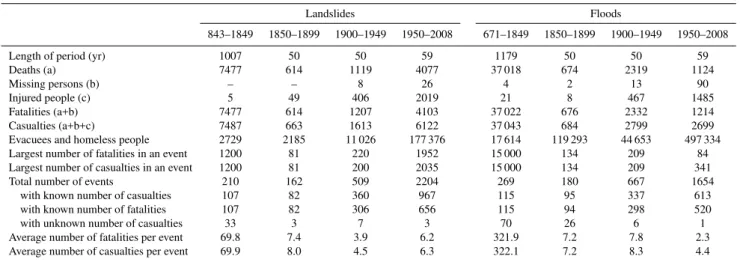
Table 1. Statistics of landslide and flood events with deaths, missing persons and injured people in Italy, for different periods. Fatalities encompass deaths and missing persons. Casualties encompass deaths, missing persons and injured people.
Landslides Floods
843–1849 1850–1899 1900–1949 1950–2008 671–1849 1850–1899 1900–1949 1950–2008
Length of period (yr) 1007 50 50 59 1179 50 50 59
Deaths (a) 7477 614 1119 4077 37 018 674 2319 1124
Missing persons (b) – – 8 26 4 2 13 90
Injured people (c) 5 49 406 2019 21 8 467 1485
Fatalities (a+b) 7477 614 1207 4103 37 022 676 2332 1214
Casualties (a+b+c) 7487 663 1613 6122 37 043 684 2799 2699
Evacuees and homeless people 2729 2185 11 026 177 376 17 614 119 293 44 653 497 334
Largest number of fatalities in an event 1200 81 220 1952 15 000 134 209 84
Largest number of casualties in an event 1200 81 200 2035 15 000 134 209 341
Total number of events 210 162 509 2204 269 180 667 1654
with known number of casualties 107 82 360 967 115 95 337 613
with known number of fatalities 107 82 306 656 115 94 298 520
with unknown number of casualties 33 3 7 3 70 26 6 1
Average number of fatalities per event 69.8 7.4 3.9 6.2 321.9 7.2 7.8 2.3
Average number of casualties per event 69.9 8.0 4.5 6.3 322.1 7.2 8.3 4.4
Inspection of Fig. 1 allows for two general considerations. First, the number of landslide and flood events per unit time (i.e., per year) increases with time. The increase is particu-larly significant after about 1700 to 1850. Second, the sever-ity (intenssever-ity, or magnitude) of the recorded events, measured by the number of casualties, varies with time. In the oldest section of the catalogue, the few recorded events were mainly catastrophic, while in the recent period (1850–2008) many low intensity events were listed in the catalogue. To inves-tigate the problem, we divided the catalogue in four subsets covering different periods, and we studied the relationship between the number of reported casualties and the number of events, in each period. To better study the increase in the number of reported events after 1850, we divided the last 159-year period of the catalogue in smaller subsets of approximately equal length. The selected periods were: (i) 843–1849, (ii) 1850–1899, (iii) 1900–1949, and (iv) 1950– 2008 for landslides, and (v) 671–1849, (vi) 1850–1899, (vii) 1900–1949, and (viii) 1950–2008 for floods (Table 1).
For both landslides and floods, the largest number of casu-alties was reported in the oldest portion of the catalogue (be-fore 1850), with an average of 69.9 landslide casualties per event (in 107 events), and 322.1 flood casualties per event (in 115 events). For the most recent portion of the cata-logue (1950–2008), the total number of landslide casual-ties was 6122 in 967 events, corresponding to an average of 6.3 casualties per event, and the total number of flood casual-ties was 2699 in 613 events, an average of 4.4 flood casualcasual-ties per event. The difference in the average number of casualties per event suggests that the oldest events reported in the cat-alogue were particularly catastrophic, but also that the old part of the catalogue is incomplete for the medium and low intensity events.
Our historical catalogue is a non-instrumental record of past landslide and flood events that have resulted in casualties in Italy. Non-instrumental records of natural events, includ-ing landslides and floods, are always affected by incomplete-ness, which is difficult to quantify (Guzzetti, 2000, 2006; Guzzetti et al., 2005b). In the catalogue, lack of occurrences in any given period may be due either to the catalogue’s incompleteness or to variation in the conditions that led to slope failures and inundations, including climate anomalies, rainfall events, earthquakes, land-use changes, and human actions.
730000
380000 1080000
730000
380000 1080000
4700000
5050000
4350000
40000000
4700000
5050000
4350000
40000000
[0 - 0.0002] (0.0002 - 0.005] (0.005 - 0.015] (0.015 - 0.05] (0.05 - 0.36]
DENSITY OF LANDSLIDE SITES
Site with homeless Site with casualties
LEGEND
Friuli-Venezia Giulia
Veneto Emilia-Romagna
Marche Abruzzo
Puglia
Calabria Sicilia Sardegna Campania
Lazio Toscana Liguria Piemonte
Valle d’Aosta Lombardia
Molise Trentino-Alto Adige
Basilicata Umbria
1 1 0
R ank of site
E
ve
nt
s
at
e
ac
h
si
te
(#
)
1 1 0 1 0 0 1 0 0 0 1 0 ,0 0 0
PERSISTENCE
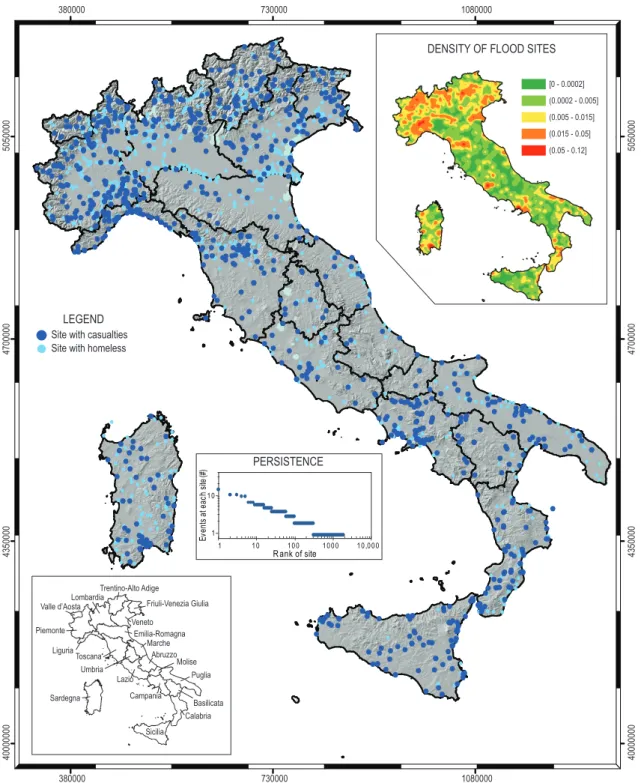
Fig. 2.Map showing the location of 2533 sites affected by landslide events with direct consequences to the population of Italy, in the
1359-year period 650–2008. Map in the upper-right corner shows density of landslide sites per square kilometre, in five classes. Plot in the central inset shows number of landslide events at each site (y-axis) against rank (x-axis), in logarithmic coordinates. Map in the lower-left corner shows location of the 20 Italian Regions.
2.3 Geographical analysis
Information on the precise or approximate location of land-slides and floods with direct human consequences is avail-able for most of the events in the historical catalogue (95%).
730000
380000 1080000
730000
380000 1080000
4700000
5050000
4350000
40000000
4700000
5050000
4350000
40000000
Site with homeless Site with casualties
LEGEND
[0 - 0.0002] (0.0002 - 0.005] (0.005 - 0.015] (0.015 - 0.05] (0.05 - 0.12]
DENSITY OF FLOOD SITES
Friuli-Venezia Giulia
Veneto Emilia-Romagna
Marche Abruzzo
Puglia
Calabria Sicilia
Sardegna Campania
Lazio Toscana Liguria Piemonte
Valle d’Aosta Lombardia
Molise Trentino-Alto Adige
Basilicata Umbria
R ank of site
E
ve
nt
s
at
e
ac
h
si
te
(#
)
1 1 0
1 1 0 1 0 0 1 0 0 0 1 0 ,0 0 0
PERSISTENCE
Fig. 3.Map showing the location of 1836 sites affected by flood events with direct consequences to the population of Italy, in the 1419-year
period 590–2008. Map in the upper-right corner shows density of flood sites per square kilometre, in five classes. Plot in the central inset shows number of flood events at each site (y-axis) against rank (x-axis), in logarithmic coordinates. Map in the lower-left corner shows location of the 20 Italian Regions.
590–2008. Sites affected by harmful events were mapped at 1:25 000 or 1:100 000 scale, using topographic base maps prepared by the Italian National Geographical Insti-tute. Harmful events occurred in all the 20 Italian Regions,
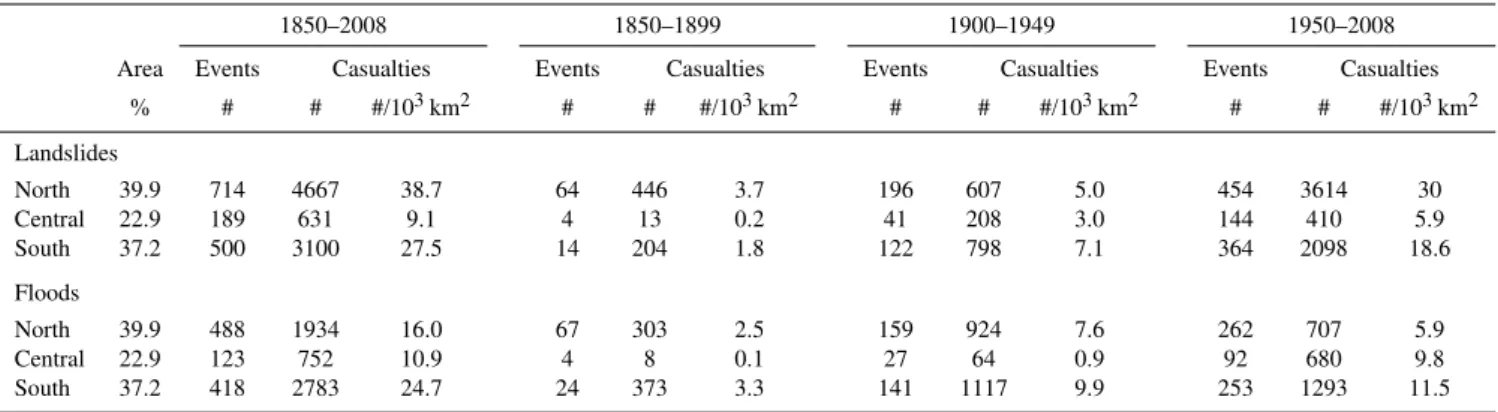
Table 2. Number of landslide and flood events with casualties, and number and density of landslide and flood casualties in three main geographical areas in Italy, for four periods.
1850–2008 1850–1899 1900–1949 1950–2008
Area Events Casualties Events Casualties Events Casualties Events Casualties
% # # #/103km2 # # #/103km2 # # #/103km2 # # #/103km2
Landslides
North 39.9 714 4667 38.7 64 446 3.7 196 607 5.0 454 3614 30
Central 22.9 189 631 9.1 4 13 0.2 41 208 3.0 144 410 5.9
South 37.2 500 3100 27.5 14 204 1.8 122 798 7.1 364 2098 18.6
Floods
North 39.9 488 1934 16.0 67 303 2.5 159 924 7.6 262 707 5.9
Central 22.9 123 752 10.9 4 8 0.1 27 64 0.9 92 680 9.8
South 37.2 418 2783 24.7 24 373 3.3 141 1117 9.9 253 1293 11.5
Inspection of the historical catalogue suggests that land-slide and flood events affected many sites repeatedly, but rel-atively few sites were damaged very frequently (Salvati et al., 2003; Guzzetti et al., 2005b). To quantify this behaviour, we: (i) counted the number of events at each site, (ii) ordered (ranked) the sites on the total number of events at each site, from largest (several events) to smallest (one event), and (iii) plotted the number of events at each site (y-axis) against their rank (x-axis), in logarithmic coordinates. Results are shown in the central insets of Fig. 2 for landslides and Fig. 3 for floods. Of the 2533 landslide sites, 314 (12.4%) were af-fected two times or more, 11 (0.4%) were afaf-fected five times or more, and only four sites (0.2%) were affected ten times or more. Similarly, of the 1836 flood sites, 301 (16.4%) were affected two or more times, 22 (1.2%) were affected five or more times, and only three sites (0.2%) were affected ten or more times. We conclude that landslide and flood risk is widespread in Italy, but the sites where severely harmful events are very frequent are few. At these sites, landslide and flood risk is high and persistent, because the average interval between damaging events is short.
Guzzetti et al. (1994) examined an early version of the AVI (an Italian acronym forAree Vulnerate Italiane, Areas Af-fected by Landslides and Floods in Italy) project catalogue of historical landslides and floods in Italy, and established that the spatial persistence (i.e., the occurrence of multiple events at the same site) of historical floods was significantly larger than the persistence of landslides. Salvati et al. (2006), working in the Umbria Region, central Italy, confirmed the different behaviour of landslide (less persistent) and flood (more persistent) events. Our analysis of the catalogue of landslide and flood events with direct consequences to the population of Italy indicates that the spatial persistence of floods and landslides are similar (upper-right inset in Fig. 2). We attribute the discrepancy to differences in the informa-tion content of the two types of sources. The AVI catalogue and the catalogue of historical landslide and flood events in Umbria
include all types of damaging events, and not only the events that have caused direct damage to the population. Our new catalogue for Italy contains only landslide and flood events that have resulted in direct damage to the population. In ad-dition, when a site is affected by a harmful landslide or flood event, the local population recognizes the area as dangerous, and defensive measures are adopted or the area is abandoned. This reduces the likelihood of multiple harmful events at the same site.
Visual inspection of Figs. 2 and 3 reveals that sites affected by harmful landslides and floods are not distributed equally in Italy. In the catalogue, harmful landslides are most abun-dant in the Alps, in southern Piedmont Region, and in the Campania and Calabria Regions, southern Italy (upper-right inset in Fig. 2), and harmful floods are most common in the western Alps, in the large flood plains of northern Italy, in Tuscany and in Campania Regions, and locally along the coasts (upper-right inset in Fig. 3).
Table 2 lists the number of landslide and flood events with casualties, and the number of landslide and flood ca-sualties in three broad geographical areas in Italy, for four periods. The geographical areas include: (i) northern Italy (120×103km2), encompassing the Italian Alps, the Po and Veneto plains, and part of the northern Apennines, (ii) cen-tral Italy (69×103km2), comprising the central Apennines, the northern and central Tyrrhenian coast, and the central Adriatic coast, and (iii) southern Italy (112×103km2), that consists of the southern Apennines, the southern Tyrrhenian coast, the southern Adriatic coast, the Ionian coast, Sicily and Sardinia. To account for the different extent of the three geographical areas, Table 2 also lists the density of landslide and flood casualties per unit area (i.e., per 103km2).
671-1849 1850-1899 1900-1949 1950-2008 671-2008
1950-2008
1900-1949
1850-1899
843-1849 843-2008
0 1-50 51-100101-500 501-1000 >1000
Number of flood casualties
0 51-100
Number of landslide casualties 1-50 101-500 501-1000 >1000
Fig. 4.Maps of Italy showing the total number of landslide (shades
of red) and flood (shades of blue) casualties in the 20 Italian Re-gions, for five periods.
From 1850 to 2008, the density of landslide casualties was largest in northern Italy (38.7 casualties per 103km2), fol-lowed by southern Italy (27.5 casualties per 103km2), and least in central Italy (9.1 casualties per 103km2). In the same period, the density of flood casualties was largest in south-ern Italy (24.7 casualties per 103km2), followed by north-ern Italy (16.0 casualties per 103km2), and least in cen-tral Italy (10.9 casualties per 103km2). Inspection of Ta-ble 2 reveals that the relative abundance of landslide events with casualties, and of the total number of landslide casu-alties in the three considered geographical regions does not change significantly in the most recent part of the catalogue (1950–2008). In this period, the density of flood casual-ties was largest in southern Italy, followed by central Italy (9.8 casualties per 103km2).
Figure 4 shows the total number of landslide and flood ca-sualties in the 20 Italian Regions, for different periods. In-spection of Fig. 4 allows for further considerations on the re-gional distribution of landslide and flood casualties in Italy. From 1850 to 2008, the Region that has experienced the largest number of landslide casualties (2164, in 321 events) is the Campania Region, southern Italy. Campania is also the second Region in terms of the total number of landslide casualties in the most recent period of the catalogue (1950– 2008), preceded by the Veneto Region, northern Italy, with 1877 casualties, most of which caused by the 9 October 1963 Vajont rockslide. The large number of landslide casualties in Campania is due mostly to soil slips and debris flows in areas where a cover of volcanic ash overlies limestone on steep slopes, a highly hazardous geological setting typical of the area surrounding the Vesuvius volcano (Guzzetti et al., 2005b).
Considering the entire span of the flood catalogue (589– 2008), Sicily experienced the largest number of flood casual-ties, due largely to the September 1557 event in the Palermo area that resulted in 7000 casualties. In the catalogue, the single most destructive flooding event occurred along the Po River in 1705. For this event, the total number of casualties remains uncertain, but up to 15 000 people were killed, went missing, or were injured at multiple sites by extensive flood-ing. For the event, the historical information available to us was insufficient to locate the human consequences precisely, or even approximately. In the period 1850–2008, the Pied-mont Region, northern Italy, experienced the largest num-ber of flood events with casualties (149), whereas the largest number of flood casualties (660) was reported in Calabria, southern Italy.
The large density of landslide casualties in northern Italy is due to the meteorological, morphological, and geologi-cal settings. In northern Italy high intensity and prolonged rainfall events, combined with the availability of debris on steep slopes, make destructive debris flows common. The presence of high relative relief and the cropping out of hard rocks, such as granite, metamorphic rocks, massive lime-stone and dolomite, facilitate rock falls, rock slides, and rock avalanches (Guzzetti, 2000). These types of landslides are particularly hazardous because of their high velocity. North-ern Italy includes the Po and the Adige river basins, the first and the third largest basins in Italy, where landslides are abundant and floods are frequent.
highly destructive flash floods and they trigger large clusters of mostly shallow landslides. The 1 October 2009 high in-tensity rainstorm in the Messina area, Sicily, gave an exam-ple of the destructiveness of such events. In less than 12 h, in an area of about 60 km2, high intensity rainfall (exceed-ing 230 mm in eight hours) caused more than 500 landslides (mainly soil slides and debris flows), widespread inunda-tion associated with massive erosion and deposiinunda-tion of debris along the drainage network, and modification of the coast line that locally was moved several tens of meters seaward. Landslides and inundation caused 31 deaths, 6 missing per-sons, and an undetermined number of injured people. The evacuees and the homeless people exceeded 2500.
3 Risk evaluation
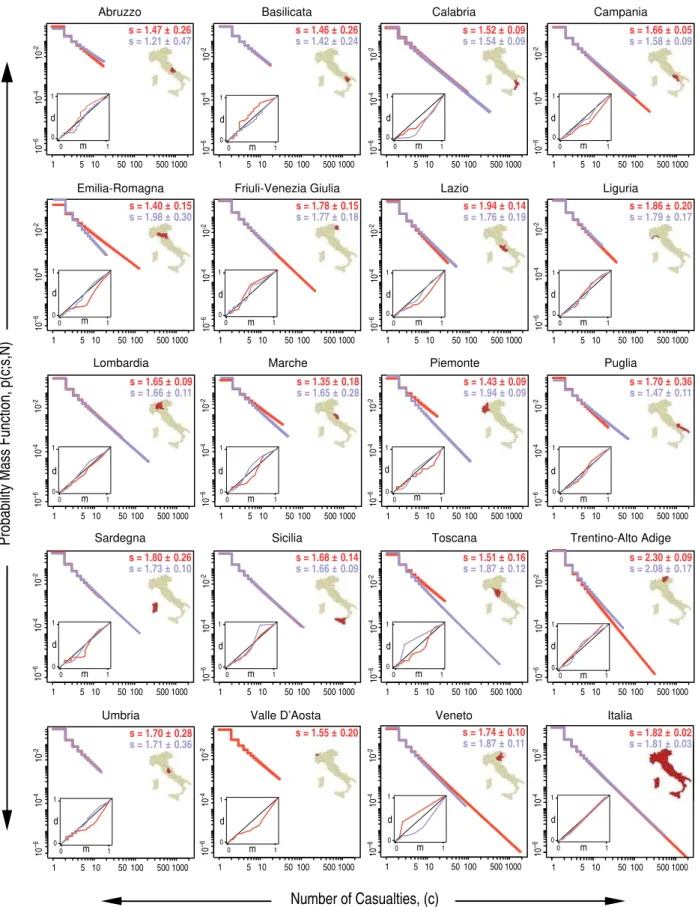
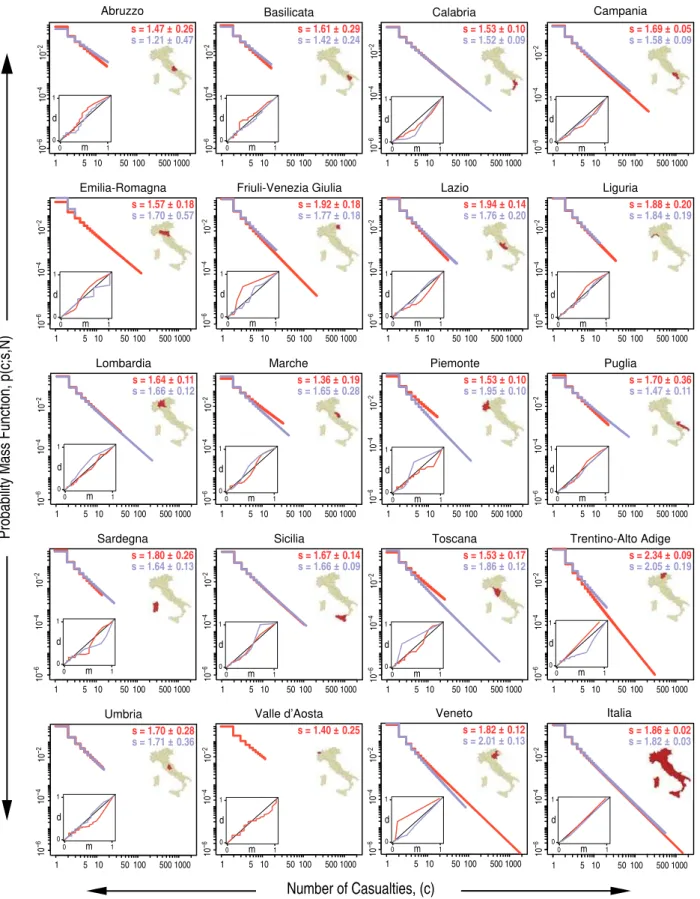
To ascertain the societal (collective) risk posed by landslides and floods in Italy, and in each of the 20 Italian Regions, we exploited the new catalogue of landslide and flood events that have resulted in casualties (deaths, missing persons, and injured people). To limit problems related to the incomplete-ness of the catalogue for the early periods, we used only the recent portion of the catalogue covering the 159-year period from 1850 to 2008.
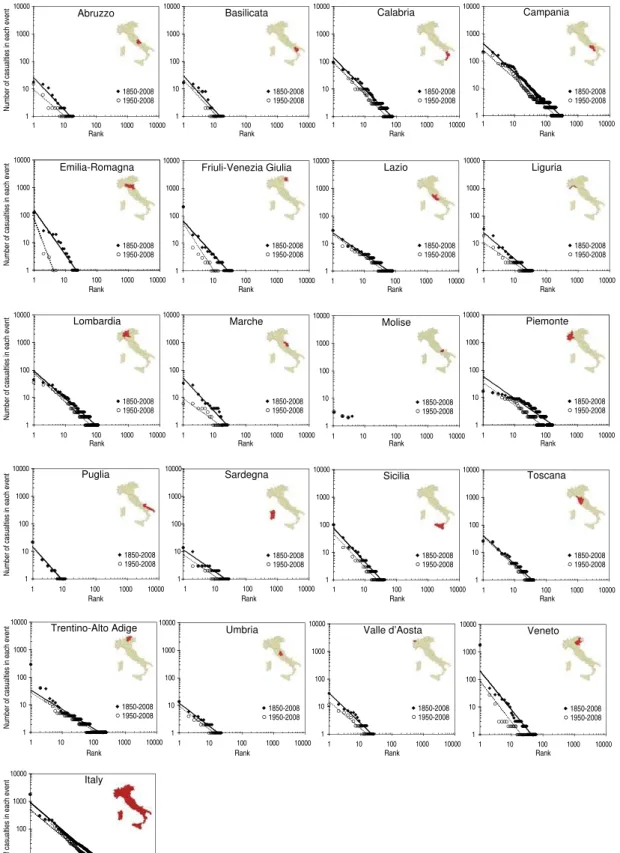
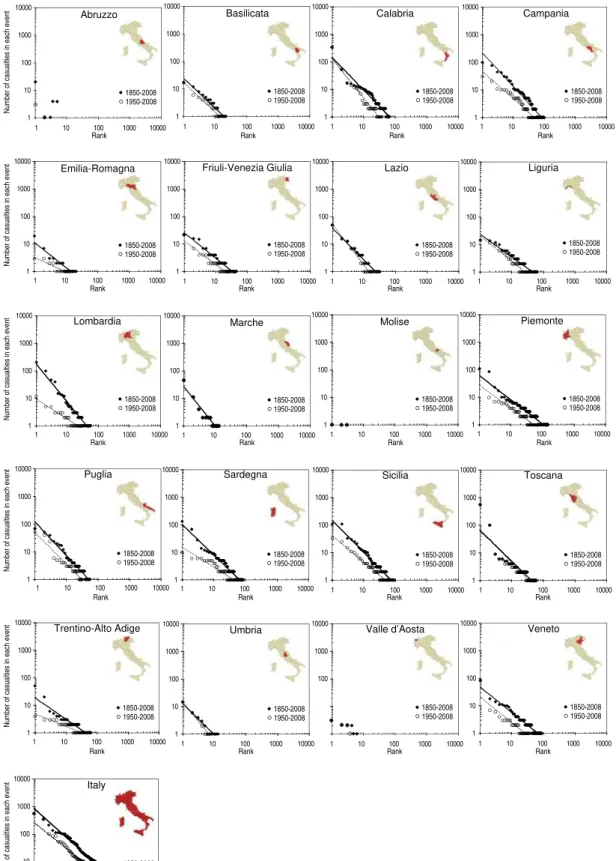
We started by ordering (ranking) the harmful events listed in the catalogue, for the whole of Italy and for the 20 indi-vidual Regions, on their intensity (the number of casualties), from smallest to largest events. Next, we plotted the number of casualties per event against their rank (i.e., the order in the catalogue), from smallest (low intensity) to largest (high in-tensity) events. Results are shown in Fig. 5 for landslides and Fig. 6 for floods, for the 159-year period 1850–2008 (open symbols) and for the 59-year period 1950–2008 (filled sym-bols). Inspection of the log-log plots reveals that the rela-tionship to link the intensity of the event (y-axis) to its rank (x-axis) is generally linear, and can be approximated by a power law. The power law trend holds in the range between 1 and about 20 casualties for the individual Regions, and be-tween 1 and about 30 casualties for the entire Italian territory. This is in an agreement with previous findings by Guzzetti et al. (2005b).
Comparison of the individual plots in Figs. 5 and 6 reveals significant differences, which are indicative of different so-cietal risk levels in the various Italian Regions. To quantify the differences, and obtain quantitative estimates for societal landslide and flood risk, we prepared a model for the prob-ability of the harmful events. When empirical data appear to be power-law distributed, i.e., when they follow a linear trend in log-log coordinates, the Pareto, Zeta, and Zipf distri-butions can be used to model the data (Reed, 2001; Guzzetti et al., 2005b; Newman, 2005; Rossi et al., 2010). The Pareto distribution prescribes a power-law probability for the size of a random event, given that the size can take any fractional value (real number) above a given minimum value. The Zeta
and the Zipf distributions are similar, and prescribe a power-law probability for the size of a random event that takes an integer value of at least one (natural number) (Reed, 2001; Newman, 2005; Rossi et al., 2010). Although the terms “Zeta distribution” and “Zipf distribution” are often used in-terchangeably, a difference exists between the two distribu-tions. The Zeta distribution is defined for a population of infinite size, whereas the Zipf distribution is defined for a population of finite size (Newman, 2005). Since the number of landslide and flood casualties is discrete (a landslide or flood can cause e.g., 1, 2, and 10 casualties, but not e.g., 1.5, 2.4, or 10.3 casualties), and because the maximum number of casualties in an event is finite (Table 1), the Zipf distribu-tion is best suited to describe the probability of a landslide or flood event with a given number of casualties.
For a Zipf distribution, the probability mass function, PMF (equivalent to the probability density function, pdf, for dis-crete data), is given by:
PMF(c;s, N )= 1
csH N,s
(1) Where cis the number of casualties per event, s is the distribution parameter (the scaling exponent for the Zipf dis-tribution that measures the proportion of small versus large events), andNis the largest number of casualties in a single event in the analyzed dataset, and
HN,s= XN
c=1
1 cs,
with
s∈R+;c∈ {1,2,...,N}.
We used maximum likelihood estimation, MLE (Fisher, 1922a, b; White et al., 2008) – a parametric method that requires the selection of a probability distribution to model the data – to determine the PMF for landslide and flood events with casualties in Italy, and in the 20 individual Re-gions. To investigate possible variations of societal risk with time, the analysis was performed for three overlapping pe-riods: (i) the 159-year period 1850–2008, (ii) the 109-year period 1900–2008, and (iii) the 59-year period 1950–2008. Figures 7, 8, and 9 summarize the results, for landslides (red lines) and floods (blue lines). To evaluate the performance of the Zipf models, we prepared Q-Q (quantile-quantile) plots (Wilk and Gnanadesikan, 1968), shown as insets in the indi-vidual plots in Figs. 7, 8, and 9, and we performed 2-sample Kolmogorov-Smirnov tests (Kolmogorov, 1933; Smirnov, 1933) (Tables 3 and 4). In the tests, lower values of theks
100 1000 10000
1 10
1 10 100 1000 10000
Abruzzo
1950-2008 1850-2008
Rank
Number of casualties in each event
100 1000 10000
1 10
1 10 100 1000 10000
Basilicata
1950-2008 1850-2008
Rank
100 1000 10000
1 10
Calabria
1 10 100 1000 10000
1950-2008 1850-2008
Rank
100 1000 10000
1 10
1 10 100 1000 10000
Campania
1950-2008 1850-2008
Rank
100 1000 10000
1 10
Emilia-Romagna
1 10 100 1000 10000
1950-2008 1850-2008
Rank
Number of casualties in each event
100 1000 10000
1 10
1 10 100 1000 10000
Friuli-Venezia Giulia
1950-2008 1850-2008
Rank
100 1000 10000
1 10
Lazio
1 10 100 1000 10000
1950-2008 1850-2008
Rank
100 1000 10000
1 10
Liguria
1 10 100 1000 10000
1950-2008 1850-2008
Rank
100 1000 10000
1 10
Lombardia
1 10 100 1000 10000
1950-2008 1850-2008
Rank
Number of casualties in each event
100 1000 10000
1 10
1 10 100 1000 10000
Marche
1950-2008 1850-2008
Rank
100 1000 10000
1 10
1 10 100 1000 10000
Molise
1950-2008 1850-2008
Rank
100 1000 10000
1 10
1 10 100 1000 10000
1950-2008 1850-2008
Piemonte
Rank
100 1000 10000
1 10
1 10 100 1000 10000
Puglia
1950-2008 1850-2008
Rank
Number of casualties in each event
100 1000 10000
1 10
Sardegna
1 10 100 1000 10000
1950-2008 1850-2008
Rank
100 1000 10000
1 10
1 10 100 1000 10000
Sicilia
1950-2008 1850-2008
Rank
100 1000 10000
1 10
Toscana
1 10 100 1000 10000
1950-2008 1850-2008
Rank
Rank 100
1000 10000
1 10
1 10 100 1000 10000
Trentino-Alto Adige
1950-2008 1850-2008
Rank
Number of casualties in each event
100 1000 10000
1 10
Umbria
1 10 100 1000 10000
1950-2008 1850-2008
Rank
100 1000 10000
1 10
Valle d’Aosta
1 10 100 1000 10000
1950-2008 1850-2008
Rank
100 1000 10000
1 10
Veneto
1 10 100 1000 10000
1950-2008 1850-2008
Rank
100 1000 10000
1 10
Italy
1 10 100 1000 10000
1950-2008 1850-2008
Number of casualties in each event
Fig. 5. Plots showing the intensity of the landslide events (y-axis), measured by the number of casualties in each event, versus the rank
Number of casualties in each event
Number of casualties in each event
Number of casualties in each event
Number of casualties in each event
Number of casualties in each event
Number of casualties in each event
Rank
Rank Rank Rank Rank
Rank Rank Rank Rank
Rank Rank Rank Rank
Rank Rank Rank Rank
Rank Rank Rank Rank
Abruzzo
1 10 100 1000 10000
100 1000 10000
1 10
1950-2008 1850-2008
Basilicata
1 10 100 1000 10000
100 1000 10000
1 10
1950-2008 1850-2008
Calabria
1 10 100 1000 10000
100 1000 10000
1 10
1950-2008 1850-2008
1 10 100 1000 10000
Campania
100 1000 10000
1 10
1950-2008 1850-2008
Emilia-Romagna
1 10 100 1000 10000
100 1000 10000
1 10
1950-2008 1850-2008
1 10 100 1000 10000
Friuli-Venezia Giulia
100 1000 10000
1 10
1950-2008 1850-2008
Lazio
1 10 100 1000 10000
100 1000 10000
1 10
1950-2008 1850-2008
Liguria
1 10 100 1000 10000
100 1000 10000
1 10
1950-2008 1850-2008
Lombardia
100 1000 10000
1 10
1 10 100 1000 10000
1950-2008 1850-2008
1 10 100 1000 10000
Marche
100 1000 10000
1 10
1950-2008 1850-2008
1 10 100 1000 10000
Molise
100 1000 10000
1 10
1950-2008 1850-2008
1 10 100 1000 10000
Piemonte
100 1000 10000
1 10
1950-2008 1850-2008
1 10 100 1000 10000
Puglia
100 1000 10000
1 10
1950-2008 1850-2008
100 1000 10000
1 10
1 10 100 1000 10000
Sardegna
1950-2008 1850-2008
1 10 100 1000 10000
Sicilia
100 1000 10000
1 10
1950-2008 1850-2008
Toscana
1 10 100 1000 10000
100 1000 10000
1 10
1950-2008 1850-2008
1 10 100 1000 10000
Trentino-Alto Adige
100 1000 10000
1 10
1950-2008 1850-2008
100 1000 10000
1 10
1 10 100 1000 10000
Umbria
1950-2008 1850-2008
Valle d’Aosta
1 10 100 1000 10000
100 1000 10000
1950-2008 1850-2008
Veneto
1 10 100 1000 10000
100 1000 10000
1 10
1950-2008 1850-2008
Italy
1 10 100 1000 10000
100 1000 10000
1 10
1950-2008 1850-2008
Fig. 6.Plots showing the intensity of the flood events (y-axis), measured by the number of casualties in each event, versus the rank (x-axis),
Probability Mass Function, p(c;s,N)
Number of Casualties, (c)
Abruzzo1 5 10 50 100 500 1000 s = 1.47 ± 0.26
s = 1.21 ± 0.47
10 −6 10 -4 10 -2 1 0 0 1 m d m d Basilicata
1 5 10 50 100 500 1000 s = 1.46 ± 0.26
s = 1.42 ± 0.24
10 −6 10 -4 10 -2 1 0 0 1 m d Calabria
1 5 10 50 100 500 1000 s = 1.52 ± 0.09
s = 1.54 ± 0.09
10 −6 10 -4 10 -2 1 0 0 1 m d Campania
1 5 10 50 100 500 1000 s = 1.66 ± 0.05
s = 1.58 ± 0.09
10 −6 10 -4 10 -2 1 0 0 1 m d Emilia-Romagna
1 5 10 50 100 500 1000 s = 1.40 ± 0.15
s = 1.98 ± 0.30
10 −6 10 -4 10 -2 1 0 0 1 Friuli-Venezia Giulia
1 5 10 50 100 500 1000 s = 1.78 ± 0.15
s = 1.77 ± 0.18
10 −6 10 -4 10 -2 1 0 0 1 m d Lazio
1 5 10 50 100 500 1000 s = 1.94 ± 0.14
s = 1.76 ± 0.19
10 −6 10 -4 10 -2 1 0 0 1 m d m d m d Liguria
1 5 10 50 100 500 1000 s = 1.86 ± 0.20
s = 1.79 ± 0.17
10 −6 10 -4 10 -2 1 0 0 1 m d Lombardia
1 5 10 50 100 500 1000 s = 1.65 ± 0.09
s = 1.66 ± 0.11
10 −6 10 -4 10 -2 1 0 0 1 m d Marche
1 5 10 50 100 500 1000 s = 1.35 ± 0.18
s = 1.65 ± 0.28
10 −6 10 -4 10 -2 1 0 0 1 m d Piemonte
1 5 10 50 100 500 1000 s = 1.43 ± 0.09
s = 1.94 ± 0.09
10 −6 10 -4 10 -2 1 0 0 1 Puglia
1 5 10 50 100 500 1000 s = 1.70 ± 0.36
s = 1.47 ± 0.11
10 −6 10 -4 10 -2 1 0 0 1 Sardegna
1 5 10 50 100 500 1000 s = 1.80 ± 0.26
s = 1.73 ± 0.10
10 −6 10 -4 10 -2 1 0 0 1 m d Sicilia
1 5 10 50 100 500 1000 s = 1.68 ± 0.14
s = 1.66 ± 0.09
10 −6 10 -4 10 -2 1 0 0 1 m d Toscana
1 5 10 50 100 500 1000 s = 1.51 ± 0.16
s = 1.87 ± 0.12
10 −6 10 -4 10 -2 1 0 0 1 m d Trentino-Alto Adige
1 5 10 50 100 500 1000 s = 2.30 ± 0.09
s = 2.08 ± 0.17
10 −6 10 -4 10 -2 1 0 0 1 m d Umbria
1 5 10 50 100 500 1000 s = 1.70 ± 0.28
s = 1.71 ± 0.36
10 −6 10 -4 10 -2 1 0 0 1 m d
1 5 10 50 100 500 1000 s = 1.55 ± 0.20
10 −6 10 -4 10 -2 Valle D’Aosta 1 0 0 1 m d Veneto
1 5 10 50 100 500 1000
10 −6 10 -4 10 -2
s = 1.74 ± 0.10
s = 1.87 ± 0.11
1 0 0 1 m d
s = 1.82 ± 0.02
s = 1.81 ± 0.03
1 5 10 50 100 500 1000
10 −6 10 -4 10 -2 Italia 1 0 0 1 m d
Fig. 7.For the 159-year period 1850–2008, the plots show the Probability Mass Function (PMF) of landslide (red) and flood (blue) events
Probability Mass Function, p(c;s,N)
Number of Casualties, (c)
Abruzzo1 5 10 50 100 500 1000 s = 1.47 ± 0.26
s = 1.21 ± 0.47
10 −6 10 −4 10 −2 1 0 0 1 m d Basilicata
1 5 10 50 100 500 1000 s = 1.61 ± 0.29
s = 1.42 ± 0.24
10 −6 10 −4 10 −2 1 0 0 1 m d Calabria
1 5 10 50 100 500 1000 s = 1.53 ± 0.10
s = 1.52 ± 0.09
10 −6 10 −4 10 −2 1 0 0 1 m d Campania
1 5 10 50 100 500 1000 s = 1.69 ± 0.05
s = 1.58 ± 0.09
10 −6 10 −4 10 −2 1 0 0 1 m d Emilia-Romagna
1 5 10 50 100 500 1000 s = 1.57 ± 0.18
s = 1.70 ± 0.57
10 −6 10 −4 10 −2 1 0 0 1 m d Friuli-Venezia Giulia
1 5 10 50 100 500 1000 s = 1.92 ± 0.18
s = 1.77 ± 0.18
10 −6 10 −4 10 −2 1 0 0 1 m d Lazio
1 5 10 50 100 500 1000 s = 1.94 ± 0.14
s = 1.76 ± 0.20
10 −6 10 −4 10 −2 1 0 0 1 m d Liguria
1 5 10 50 100 500 1000 s = 1.88 ± 0.20
s = 1.84 ± 0.19
10 −6 10 −4 10 −2 1 0 0 1 m d Lombardia
1 5 10 50 100 500 1000 s = 1.64 ± 0.11
s = 1.66 ± 0.12
10 −6 10 −4 10 −2 1 0 0 1 m d Marche
1 5 10 50 100 500 1000 s = 1.36 ± 0.19
s = 1.65 ± 0.28
10 −6 10 −4 10 −2 1 0 0 1 m d Piemonte
1 5 10 50 100 500 1000 s = 1.53 ± 0.10
s = 1.95 ± 0.10
10 −6 10 −4 10 −2 1 0 0 1 m d Puglia
1 5 10 50 100 500 1000 s = 1.70 ± 0.36
s = 1.47 ± 0.11
10 −6 10 −4 10 −2 1 0 0 1 m d Sardegna
1 5 10 50 100 500 1000 s = 1.80 ± 0.26
s = 1.64 ± 0.13
10 −6 10 −4 10 −2 1 0 0 1 m d Sicilia
1 5 10 50 100 500 1000 s = 1.67 ± 0.14
s = 1.66 ± 0.09
10 −6 10 −4 10 −2 1 0 0 1 m d Toscana
1 5 10 50 100 500 1000 s = 1.53 ± 0.17
s = 1.86 ± 0.12
10 −6 10 −4 10 −2 1 0 0 1 m d
s = 2.34 ± 0.09
s = 2.05 ± 0.19
Trentino-Alto Adige
1 5 10 50 100 500 1000
10 −6 10 −4 10 −2 m d 1 0 0 1 Umbria
1 5 10 50 100 500 1000
10 −6 10 −4 10 −2
s = 1.70 ± 0.28
s = 1.71 ± 0.36
1 0 0 1 m d Valle d’Aosta
1 5 10 50 100 500 1000 s = 1.40 ± 0.25
10 −6 10 −4 10 −2 1 0 0 1 m d Veneto
1 5 10 50 100 500 1000 s = 1.82 ± 0.12
s = 2.01 ± 0.13
10 −6 10 −4 10 −2 1 0 0 1 m d
1 5 10 50 100 500 1000
10 −6 10 −4 10 −2 Italia
s = 1.86 ± 0.02
s = 1.82 ± 0.03
1 0 0 1 m d
Fig. 8.For the 109-year period 1900–2008, the plots show the Probability Mass Function (PMF) of landslide (red) and flood (blue) events
Probability Mass Function, p(c;s,N)
Number of Casualties, (c) Abruzzo
1 5 10 50 100 500 1000 s = 1.91 ± 0.37
10 −6 10 −4 10 −2 1 0 0 1 m d Basilicata
1 5 10 50 100 500 1000 s = 1.61 ± 0.30
s = 1.23 ± 0.30
10 −6 10 −4 10 −2 1 0 0 1 m d Calabria
1 5 10 50 100 500 1000 s = 1.52 ± 0.11
s = 1.60 ± 0.13
10 −6 10 −4 10 −2 1 0 0 1 m d Campania
1 5 10 50 100 500 1000 s = 1.72 ± 0.06
s = 1.65 ± 0.14
10 −6 10 −4 10 −2 1 0 0 1 m d Emilia-Romagna
1 5 10 50 100 500 1000 s = 1.30 ± 0.32
s = 1.61 ± 0.68
10 −6 10 −4 10 −2 1 0 0 1 m d Friuli-Venezia Giulia
1 5 10 50 100 500 1000 s = 1.66 ± 0.23
s = 1.94 ± 0.25
10 −6 10 −4 10 −2 1 0 0 1 m d Lazio
1 5 10 50 100 500 1000 s = 1.89 ± 0.16
s = 1.50 ± 0.21
10 −6 10 −4 10 −2 1 0 0 1 m d Liguria
1 5 10 50 100 500 1000 s = 2.06 ± 0.27
s = 1.64 ± 0.22
10 −6 10 −4 10 −2 1 0 0 1 m d
1 5 10 50 100 500 1000 Lombardia
s = 1.59 ± 0.12
s = 2.01 ± 0.28
10 −6 10 −4 10 −2 1 0 0 1 m d Marche
1 5 10 50 100 500 1000 s = 1.29 ± 0.38
s = 1.65 ± 0.28
10 −6 10 −4 10 −2 1 0 0 1 m d
1 5 10 50 100 500 1000 Piemonte
s = 1.62 ± 0.13
s = 1.99 ± 0.14
10 −6 10 −4 10 −2 1 0 0 1 m d Puglia
1 5 10 50 100 500 1000 s = 1.61 ± 0.36
s = 1.46 ± 0.16
10 −6 10 −4 10 −2 1 0 0 1 m d Sardegna
1 5 10 50 100 500 1000 s = 2.08 ± 0.35
s = 1.61 ± 0.20
10 −6 10 −4 10 −2 1 0 0 1 m d Sicilia
1 5 10 50 100 500 1000 s = 1.78 ± 0.17
s = 1.73 ± 0.14
10 −6 10 −4 10 −2 1 0 0 1 m d Toscana
1 5 10 50 100 500 1000 s = 1.59 ± 0.18
s = 1.85 ± 0.13
10 −6 10 −4 10 −2 1 0 0 1 m d
s = 2.33 ± 0.10
s = 1.75 ± 0.33
Trentino-Alto Adige
1 5 10 50 100 500 1000
10 −6 10 −4 10 −2 1 0 0 1 m d Umbria
1 5 10 50 100 500 1000 s = 1.80 ± 0.33
s = 1.36 ± 0.41
10 −6 10 −4 10 −2 1 0 0 1 m d Veneto
1 5 10 50 100 500 1000 s = 1.86 ± 0.16
s = 2.00 ± 0.19
10 −6 10 −4 10 −2 1 0 0 1 m d
1 5 10 50 100 500 1000
10 −6 10 −4 10 −2 Italia
s = 1.89 ± 0.03
s = 1.90 ± 0.40
1 0 0 1 m d
Fig. 9. For the 59-year period 1950–2008, the plots show the Probability Mass Function (PMF) of landslide (red) and flood (blue) events
Salv
ati
et
al.:
Societal
lan
dslide
and
flood
risk
in
Italy
479
Table 3. Societal landslide risk criteria in Italy. The table lists the scaling exponent (s) and the associated standard error (ε) for Zipf models obtained through maximum likelihood
estimation (MLE) of the empirical casualty data, for four periods.ks(D-value) andp(p-value) measure the performance of the Zipf models. Figures for the Molise Region not shown due to lack of data.
1850–2008 1900–2008 1900–1949 1950–2008
events s ε ks p events s ε ks p events s ε ks p events s ε ks p
North
1 Valle d’Aosta 27 1.55 0.20 0.06 1.00 26 1.40 0.25 0.06 1.00 1.00
2 Piemonte 162 1.43 0.09 0.07 0.45 136 1.53 0.10 0.06 0.71 48 1.26 0.18 0.05 1.00 88 1.62 0.13 0.08 0.94
3 Lombardia 113 1.65 0.09 0.05 0.95 97 1.64 0.11 0.05 0.97 21 1.40 0.34 0.05 1.00 76 1.59 0.12 0.06 0.99
4 Trentino-Alto Adige 252 2.30 0.09 0.02 1.00 249 2.34 0.09 0.02 1.00 51 2.32 0.22 0.04 1.00 198 2.33 0.10 0.02 1.00
5 Friuli-Venezia Giulia 37 1.78 0.15 0.05 1.00 34 1.92 0.18 0.07 1.00 21 1.70 0.35 0.05 1.00 13 1.66 0.23 0.09 1.00
6 Veneto 61 1.74 0.10 0.07 0.92 56 1.82 0.12 0.09 0.72 24 1.65 0.20 0.07 1.00 32 1.86 0.16 0.12 0.70
7 Liguria 37 1.86 0.20 0.05 1.00 36 1.88 0.20 0.07 1.00 6 1.31 0.35 0.14 1.00 30 2.06 0.27 0.07 1.00
8 Emilia-Romagna 25 1.40 0.15 0.07 1.00 20 1.57 0.18 0.07 1.00 15 1.43 0.28 0.06 1.00 5 1.30 0.32 0.22 0.97
Central
9 Toscana 42 1.51 0.16 0.08 0.96 39 1.53 0.17 0.06 1.00 37 1.59 0.18 0.06 1.00
10 Marche 26 1.35 0.18 0.12 0.87 25 1.36 0.19 0.10 0.96 18 1.29 0.38 0.09 1.00
11 Umbria 22 1.70 0.28 0.06 1.00 22 1.70 0.28 0.06 1.00 17 1.80 0.33 0.07 1.00
12 Lazio 80 1.94 0.14 0.04 1.00 80 1.94 0.14 0.04 1.00 23 2.00 0.31 0.04 1.00 57 1.89 0.16 0.05 1.00
13 Abruzzo 19 1.47 0.26 0.08 1.00 19 1.47 0.26 0.08 1.00 15 1.91 0.37 0.10 1.00
South
14 Molise
15 Campania 321 1.66 0.05 0.11 8.1E−4 312 1.69 0.05 0.11 9.1E−4 81 1.62 0.09 0.11 0.24 231 1.72 0.06 0.11 0.01
16 Basilicata 19 1.46 0.26 0.14 0.87 18 1.61 0.29 0.12 0.94 16 1.61 0.30 0.15 0.85
17 Puglia 11 1.70 0.36 0.09 1.00 11 1.70 0.36 0.09 1.00 10 1.61 0.36 0.10 1.00
18 Calabria 77 1.52 0.09 0.11 0.29 75 1.53 0.10 0.11 0.31 21 1.45 0.20 0.11 0.97 54 1.52 0.11 0.11 0.52
19 Sicilia 43 1.68 0.14 0.03 1.00 41 1.67 0.14 0.04 0.31 8 1.13 0.31 0.12 1.00 33 1.78 0.17 0.05 1.00
20 Sardegna 29 1.80 0.26 0.11 0.89 29 1.80 0.26 0.11 0.89 9 1.18 0.43 0.21 0.84 20 2.08 0.35 0.07 1.00
Italy 1 407 1.82 0.02 0.07 1.5E−6 1329 1.86 0.02 0.07 1.7E−5 371 1.78 0.05 0.07 0.05 969 1.89 0.03 0.06 2.2E−3
.nat-hazards-earth-syst-sc
i.net/10/465/2010/
Nat.
Hazards
Earth
Syst.
Sci.,
10,
465–
483,
P.
Salv
ati
et
al.:
Societal
landslide
and
flood
risk
in
Table 4. Societal flood risk criteria in Italy. The Table lists the scaling exponent (s) and the associated standard error (ε) for Zipf models obtained through maximum likelihood
estimation (MLE) of the empirical casualty data, for four periods.ks(D-value) andp(p-value) measure the performance of the Zipf models. Figures for the Molise and Valle d’Aosta Regions not shown due to lack of data.
1850–2008 1900–2008 1900–1949 1950–2008
events s ε ks p events s ε ks p events s ε ks p events s ε ks p
North
1 Valle d’Aosta
2 Piemonte 149 1.94 0.09 0.21 8.1E−7 113 1.95 0.10 0.17 5.6E−4 40 1.86 0.16 0.20 0.05 73 1.99 0.14 0.15 0.03 3 Lombardia 56 1.66 0.11 0.07 0.70 47 1.66 0.12 0.08 0.61 16 1.19 0.15 0.43 1.3E−3 31 2.01 0.28 0.19 6.6E−3 4 Trentino-Alto Adige 62 2.08 0.17 0.05 0.45 57 2.05 0.19 0.06 0.29 15 1.51 0.29 0.27 5.2E−4 42 1.75 0.33 0.06 0.58 5 Friuli-Venezia Giulia 45 1.77 0.18 0.07 1.00 45 1.77 0.18 0.06 1.00 17 1.49 0.28 0.18 0.46 28 1.94 0.25 0.15 0.95 6 Veneto 88 1.87 0.11 0.08 0.86 79 2.01 0.13 0.08 0.89 42 1.75 0.20 0.13 0.81 37 2.00 0.19 0.07 1.00 7 Liguria 62 1.79 0.17 0.05 1.00 59 1.84 0.19 0.06 1.00 22 1.94 0.79 0.43 0.15 34 1.64 0.22 0.17 0.33 8 Emilia-Romagna 21 1.98 0.30 0.30 0.02 19 1.70 0.57 0.35 0.02 6 1.00 1.25 0.40 0.02 13 1.61 0.68 0.49 0.19
Central
9 Toscana 60 1.87 0.12 0.16 0.25 59 1.86 0.12 0.12 0.61 51 1.85 0.13 0.09 0.91
10 Marche 13 1.65 0.28 0.23 0.14 13 1.65 0.28 0.21 0.23 13 1.65 0.28 0.16 0.73
11 Umbria 13 1.71 0.36 0.06 1.00 13 1.71 0.36 0.06 1.00 8 1.36 0.41 0.19 0.54
12 Lazio 32 1.76 0.19 0.09 0.59 29 1.76 0.20 0.09 0.58 11 2.09 0.71 0.09 0.99 18 1.50 0.21 0.18 0.05 13 Abruzzo 5 1.21 0.47 0.17 0.61 5 1.21 0.47 0.17 0.61
South 14 Molise
15 Campania 97 1.58 0.09 0.08 0.02 89 1.58 0.09 0.09 0.02 30 1.35 0.14 0.15 0.05 59 1.65 0.14 0.10 0.02 16 Basilicata 22 1.42 0.24 0.14 0.87 22 1.42 0.24 0.17 0.68 13 1.23 0.30 0.25 0.26
17 Puglia 56 1.47 0.11 0.18 0.87 56 1.47 0.11 0.18 0.87 32 1.46 0.16 0.16 0.95
18 Calabria 66 1.54 0.09 0.11 0.35 60 1.52 0.09 0.10 0.38 23 0.70 0.22 37 1.60 0.13 0.13 0.29 19 Sicilia 91 1.66 0.09 0.04 1.00 91 1.66 0.09 0.04 1.00 30 1.39 0.14 0.14 1.00 61 1.73 0.14 0.06 1.00 20 Sardegna 83 1.73 0.10 0.19 0.23 74 1.64 0.13 0.19 0.26 23 1.31 0.20 0.28 0.49 51 1.61 0.20 0.15 0.77
Italy 1037 1.81 0.03 0.06 1.7E−5 942 1.82 0.03 0.05 1.7E−3 330 1.68 0.05 0.06 1.2E−3 613 1.90 0.40 0.06 1.6E−1
Hazards
Earth
Syst.
Sci.,
10,
465–
483,
2010
www
4 Discussion
In Figs. 7, 8, and 9, the empirical casualty data for Italy and for the 20 Italian Regions (symbols) are reasonably well de-scribed by the Zipf models (lines). We take this as indication that the Zipf distribution is suited to describe casualty (and fatality) data in Italy, and possibly elsewhere.
The Zipf models obtained for Italy, and for the 20 individ-ual Regions, give the expected relative proportion of small, medium and large intensity events, where the total number of casualties in an event measures the intensity. The scaling exponentssfor our Zipf models are listed in Table 3 for land-slides and in Table 4 for floods, for different periods. Con-sidering the period 1850–2008, the values are, for the entire Italian territory, s=1.82±0.02 for landslides (1407 events), and s=1.81±0.03 for floods (1037 events). The values of sincrease slightly when the most recent period 1950–2008 is considered: s=1.89±0.03 for landslides (371 events), and s=1.90±0.40 for floods (330 events).
The scaling behaviour of the intensity of the casualties found in this work is very similar to what was obtained by Guzzetti et al. (2005b), who used an earlier version of the catalogue of landslides and floods with fatalities in Italy, in the 103-year period 1900–2002. We attribute the observed differences to: (i) the addition of 227 landslide events and 56 flood events with casualties, which has improved the com-pleteness of the catalogue, (ii) the fact that our work was based on the analysis of the casualties (deaths, missing per-sons, and injured people) whereas Guzzetti et al. (2005b) based their study on the fatalities (deaths and missing per-sons), and (iii) the different statistical technique used to ob-tain the PMF of landslide and flood damage.
The scaling exponent (i.e., the slope)s of the modelled Zipf distributions can be used to compare the proportion of events with different intensity in the 20 Italian Regions. Re-gions exhibiting steep Zipf curves (i.e., having a large scaling exponents) have a smaller probability of experiencing large intensity events, when compared to Regions that have less steep curves (i.e., having small exponents), for which the relative proportion of large intensity events is larger.
Inspection of Figs. 7, 8, 9, and Tables 3 and 4, re-veals that variation exists in the scaling exponents ob-tained for the 20 Italian Regions. For the period 1850– 2008,s ranges between 1.35 and 2.30 for landslides (mean µ=1.66, standard deviationσ=0.23), and between 1.21 and 2.08 for floods (µ=1.71, σ=0.21). Considering the pe-riod 1950–2009, s ranges between 1.29 and 2.33 for land-slides (µ=1.73, σ=0.26), and between 1.23 and 2.01 for floods (µ=1.68, σ=0.23). Variations in space (geographi-cally) and time are the results of two main causes: differ-ent levels of completeness in the catalogue, geographically and temporally, and differences in societal landslide and flood risk. The latter, depends on: (i) the geological and morphological setting which determine the local susceptibil-ity to harmful landslides and floods, (ii) the frequency and
intensity of the triggers (i.e., rainfall, earthquakes, etc.), and (iii) the abundance and distribution of the population at risk.
Analysis of Tables 3 and 4 reveals a temporal and a spatial trend. For most of the Regions for which sufficient informa-tion was available to determine the PMF of the casualties, the scaling exponentsof the Zipf distribution increases with time, for both landslides and floods. This indicates that the expected (modelled) proportion of events with a large num-ber of casualties, compared to the proportion of events with fewer casualties, has decreased from 1850 to 2008. This may be the result of a decrease in societal risk, or it may be the result of incompleteness in the catalogue. Although warning systems and remedial measures have been installed in Italy to protect people from landslides and inundations, we attribute the larger values ofsprimarily to a systematic lack of small intensity events in the early part of the catalogue.
Interpretation of the geographical variation of thes val-ues in Italy is more difficult and uncertain. This is because the regional analysis of societal risk was based on admin-istrative subdivisions (the Regions) that have little relation with the physical (e.g., geological, morphological, hydrolog-ical, meteorological) setting, and because the standard error εassociated with the estimation ofs is significant for some of the Regions, a result of the reduced number of events in each Region (Tables 3 and 4). Despite these limitations, a trend emerges from the data. Considering the flood cata-logue, and limiting the analysis to the most recent period (1950–2008) that we judge complete for statistical purposes, we find that Regions in northern Italy have largers values (µ=1.85,σ=0.18) than Regions in central (µ=1.59,σ=0.21) and in southern (µ=1.55,σ=0.18) Italy. This indicates that the probability of experiencing a flood event with a large or very large number of casualties is largest in southern Italy and reduced in northern Italy. A similar, but less distinct, geographical trend exists for landslides. Regions in north-ern Italy have, on average, slightly largersvalues (µ=1.77, σ=0.34), than Regions in central (µ=1.70, σ=0.26) and in southern (µ=1.72,σ=0.20) Italy (Tables 3 and 4).
Abruzzo Basilicata
Calabria Campania Emilia-Romagna Friuli-Venezia Giulia
Lazio Liguria Lombardia
Marche Piemonte
Puglia Toscana Trentino-Alto Adige
Sardegna Sicilia Veneto Valle d’Aosta
Umbria 1 2 3 4 5 6 7 8 9 10 11 12 13 15 16 17 18 19 20
Number of landside casualties, c [#]
Frequency Density,
FD
[#
-1]
Annual Frequency Density,
FDA
[#
-1�
yr
-1]
10-5
10-4
10-3
10-2
10-1
10-7
10-6
10-5
10-4
10-3
10-2
10-1
100
101
102
100
100 101 102 103
8
4 20
19
17
15 2
5 3
12
18 7
6 9
11 13 10 16 1
A - Landslides
10-4
10-3
10-2
10-1
100
101
102
10-6
10-5
10-4
10-3
10-2
10-1
100
100 101 102 103 Number of flood casualties, c [#]
8 4 20 19
17 15 2
5 3
12
18 7
6
9 11
10 16
Basilicata
Calabria Campania Emilia-Romagna Friuli-Venezia Giulia
Lazio Liguria Lombardia
Marche Piemonte
Puglia Toscana Trentino-Alto Adige
Sardegna Sicilia Veneto
Umbria 2 3 4 5 6 7 8 9 10 11 12 15 16 17 18 19 20
Annual Frequency Density,
FDA
[#
-1�
yr
-1]
Frequency Density,
FD
[#
-1]
B - Floods
Fig. 10. Plots showing the frequency density (left y-axes) and the
annual frequency density (right y-axes) of landslide (upper graph) and flood (lower graph) events with casualties in the Italian Regions against the intensity of the landside and flood events (x-axes), mea-sured by the total number of casualties (deaths, missing persons and injured people), in the 59-year period 1950–2008. Molise and Valle d’Aosta Regions for landslides and floods, and Abruzzo for floods are not shown due to the lack of data.
In an attempt to consider the proportion of events of dif-ferent intensity and the temporal frequency of the events, for the evaluation and ranking of landslide and flood risk we scaled (i.e., normalized) the PMF obtained for each single Region to the total number of events with casualties in the Region, in the 59-year period 1950–2008 (Fig. 10). Inspec-tion of Fig. 10a reveals that the Trentino-Alto Adige (# 4) and the Campania (# 15) Regions exhibit the largest societal landslide risk, and the Emilia-Romagna Region (# 8) has the lowest landslide risk. For the other Regions, a ranking of so-cietal landslide risk can be obtained based on the location of the frequency curve in the plot, a function of the total num-ber of events with casualties in the catalogue (1950–2008),
and on the scaling exponents, a function of the proportion of events of different intensity in the catalogue. Similarly, analysis of Fig. 10b indicates that societal flood risk in Italy is largest in the Piedmont (# 2) and the Sicily (# 19) Re-gions, and lowest in the Umbria (# 11) and Basilicata (# 16) Regions, with the other Regions experiencing intermediate levels of societal flood risk.
Inspection of the historical catalogue indicates that the causes for the high landslide risk in the Trentino-Alto Adige Region (northern Italy) and in the Campania Region (south-ern Italy) are different. In Trentino-Alto Adige Region (# 4), landslide risk is due primarily to a combination of multiple types of fast-moving landslides, including rock falls, rock slides, and debris flows. In the Campania Region (# 15), harmful landslides concentrate in the area surrounding the Vesuvius volcano, and are chiefly soil slides, debris flows, and debris avalanches that involve loose volcanic materials (secondary lahars). In Piedmont Region (# 2), harmful floods occur mostly along large rivers, whereas in Sicily (# 19) flood casualties are caused chiefly by flash floods along ephemeral streams.
5 Conclusions
Acknowledgements. We thank J. Coe and a second anonymous reviewer for their constructive comments. We are grateful to the people who contributed to the compilation of the AVI catalogue and who maintain the information system on geo-hydrological catastrophes in Italy (SICI, http://sici.irpi.cnr.it). This work was partially supported by the Italian National Department for Civil Protection (DPC). PS, CB and MR supported by DPC grants.
Edited by: K.-T. Chang
Reviewed by: J. Coe and another anonymous referee
References
Esposito, E., Porfido, S., Violante, C., and Alaia, F.: Disaster in-duced by historical floods in a selected coastal area (Southern Italy), in: Proceedings of the Workshop PHEFRA (Palaeofloods, Historical Data and Climatic Variability), Barcelona, Spain, Oc-tober 2002, edited by: Thorndycraft, V. R., Benito, G., Barrien-dos, M., and Llasat, M. C., Application in Flood Risk Assess-ment, 143–148, 2003.
Fell, R. and Hartford, D.: Landslide risk management, in: Landslide risk assessment, edited by: Cruden, D. M. and Fell, R., Balkema, Rotterdam, 51–109, 1997.
Fisher, R. A.: On the mathematical foundations of theoretical statis-tics, Philos. T. R. Soc. Lond., 222, 309–368, 1922a.
Fisher, R. A.: The goodness of fit of regression formulae, and the distribution of regression coefficients, J. R. Stat. Soc., 85(4), 597–612, 1922b.
Guzzetti, F.: Landslide fatalities and evaluation of landslide risk in Italy, Eng. Geol., 58, 89–107, 2000.
Guzzetti, F.: Landslide Hazard and Risk Assessment, Ph.D. thesis, Mathematisch-Naturwissenschaftlichen Fakult¨at der Rheinis-chen Friedrich-Wilhelms-Universit¨at University of Bonn, Bonn,
389 pp., available at: http://hss.ulb.uni-bonn.de/diss online/
math nat fak/2006/guzzetti fausto/ (last access: 8 March 2010), 2006.
Guzzetti, F. and Tonelli, G.: Information system on hydrological and geomorphological catastrophes in Italy (SICI): a tool for managing landslide and flood hazards, Nat. Hazards Earth Syst. Sci., 4, 213–232, 2004,
http://www.nat-hazards-earth-syst-sci.net/4/213/2004/.
Guzzetti, F., Cardinali, M., and Reichenbach, P.: The AVI Project: A bibliographical and archive inventory of landslides and floods in Italy, Environ. Manage., 18(4), 623-633, 1994.
Guzzetti, F., Salvati, P., and Stark, C. P.: Evaluation of risk to the population posed by natural hazards in Italy, in: Landslide risk management, edited by; Hungr, O., Fell, R., Couture, R., and Eberhardt, E., Taylor & Francis Group, London, 381–389, 2005a.
Guzzetti, F., Stark, C. P., and Salvati, P.: Evaluation of flood and landslide risk to the population of Italy, Environ. Manage., 36(1), 15–36, 2005b.
Kolmogorov, A.: Grundbegriffe der Wahrscheinlichkeitsrechnung, Julius Springer, Berlin, 1933.
Newman, M. E. J.: Power laws, Pareto distributions and Zipf’s law, Contemp. Phys., 46(5), 323–351, 2005.
Porfido, S., Esposito, E., Alaia, F., Molisso, F., and Sacchi, M.: The use of documentary sources for reconstructing flood chronolo-gies on the Amalfi rocky coast (southern Italy), in: Geohazard in rocky coastal area, The Geological Society, London, Special Publications, 322, edited by: Violante, C., The Geological Soci-ety of London, 173–187, 2009.
Reed, W. J.: The Pareto, Zipf and other power laws, Econ. Lett., 74(1), 15–19, 2001.
Rossi, M., Witt, A., Guzzetti, F., Malamud, B. D., and Peruccacci, S.: Analysis of historical landslide time series in the Emilia-Romagna Region, Northern Italy, Earth Surf. Proc. Land., 2010. Salvati, P., Bianchi, C., and Guzzetti F.: Catalogo delle Frane e delle Inondazioni Storiche in Umbria, CNR IRPI e Fondazione Cassa di Risparmio di Perugia, ISBN-10 88-95172-00-0, ISBN-13 978-88-95172-00-2, 278 pp., 2006 (in Italian).
Salvati, P., Guzzetti, F., Reichenbach, P., Cardinali, M., and Stark, C. P.: Map of landslides and floods with human consequences in Italy, CNR Gruppo Nazionale per la Difesa dalle Catastrofi Idrogeologiche Publication n. 2822, scale 1:1 200 000, 2003. Smirnov, N.: Estimate of deviation between empirical distribution
functions in two independent samples, Bulletin of Moscow Uni-versity, 2(2), 3–16, 1933.
White, E. P., Enquist, B. J., and Green, J. L.: On estimating the exponent of power-law frequency distributions, Ecology, 89(4), 905–912, doi;10.1890/07-1288.1, 2008.