Transcriptional Profile of Muscle following
Acute Induction of Symptoms in a Mouse
Model of Kennedy's Disease/Spinobulbar
Muscular Atrophy
Katherine Halievski‡¤, Kaiguo Mo‡
, J. Timothy Westwood, Douglas A. Monks*
Department of Psychology, University of Toronto Mississauga, Mississauga, Ontario, Canada
¤ Current address: Neuroscience Program, Michigan State University, East Lansing, Michigan, United States of America
‡These authors contributed equally to this work. *ashley.monks@utoronto.ca
Abstract
Background
Kennedy’s disease/Spinobulbar muscular atrophy (KD/SBMA) is a degenerative neuromus-cular disease affecting males. This disease is caused by polyglutamine expansion muta-tions of the androgen receptor (AR) gene. Although KD/SBMA has been traditionally considered a motor neuron disease, emerging evidence points to a central etiological role of muscle. We previously reported a microarray study of genes differentially expressed in muscle of three genetically unique mouse models of KD/SBMA but were unable to detect those which are androgen-dependent or are associated with onset of symptoms.
Methodology/Principal Findings
In the current study we examined the time course and androgen-dependence of transcrip-tional changes in the HSA-AR transgenic (Tg) mouse model, in which females have a se-vere phenotype after acute testosterone treatment. Using microarray analysis we identified differentially expressed genes at the onset and peak of muscle weakness in testosterone-treated Tg females. We found both transient and persistent groups of differentially express-ed genes and analysis of gene function indicatexpress-ed functional groups such as mitochondrion, ion and nucleotide binding, muscle development, and sarcomere maintenance.
Conclusions/Significance
By comparing the current results with those from the three previously reported models we were able to identify KD/SBMA candidate genes that are androgen dependent, and occur early in the disease process, properties which are promising for targeted therapeutics.
OPEN ACCESS
Citation:Halievski K, Mo K, Westwood JT, Monks DA (2015) Transcriptional Profile of Muscle following Acute Induction of Symptoms in a Mouse Model of Kennedy's Disease/Spinobulbar Muscular Atrophy. PLoS ONE 10(2): e0118120. doi:10.1371/journal. pone.0118120
Academic Editor:Thomas M. Wishart, University of Edinburgh, UNITED KINGDOM
Received:August 27, 2014
Accepted:January 7, 2015
Published:February 26, 2015
Copyright:© 2015 Halievski et al. This is an open access article distributed under the terms of the
Creative Commons Attribution License, which permits unrestricted use, distribution, and reproduction in any medium, provided the original author and source are credited.
Data Availability Statement:All microarray data is MIAME compliant and has been deposited in GEO (accession number: GSE61886).
Introduction
Kennedy's Disease/Spinobulbar muscular atrophy (KD/SBMA) is an X-linked, androgen-dependent neuromuscular disease caused by polyglutamine (polyQ) mutation of the androgen
receptor (AR) gene [1,2]. KD/SBMA is characterized by a late-onset, progressive weakness of
proximal limbs and bulbar muscles in affected men as well as androgen insensitivity (such as gynecomastia and infertility) and some sensory deficits. Though this is predominately
consid-ered a“motor neuron disease”, myogenic origins have been proposed (reviewed in [3,4–7]).
Ev-idence of myopathy prior to motor neuron pathology (e.g., [8]) indicates that AR may first
cause dysfunction in muscles, which then leads to dysfunction of the motor neurons that inner-vate them. Similarly, selective AR overexpression limited to muscle is sufficient to cause motor
neuron pathology [9]. Moreover, a recent study in a KD/SBMA mouse model demonstrated
that removing mutant AR solely from muscles is sufficient to improve motor function and
sur-vival [10]. Since the motor unit (motor neuron and muscle fibre) is interdependent, it is of
in-terest to determine which pathological actions ofARcan occur in muscles as this may give
insight into the overall disease process in KD/SBMA.
We previously reported a microarray study of gene expression in muscle of three different
mouse models of KD/SBMA [11]. Briefly, the three male KD/SBMA mouse models we used for
comparison were: a polyQ expanded AR knock-in model (AR113Q KI; [8]); a transgenic (Tg)
model that overexpresses polyQ AR ubiquitously (AR97Q Tg; [12]); and a Tg model that
over-expresses wild-type (WT) AR solely in muscle (HSA-AR Tg; [9]). Identifying transcriptional
changes in muscle in mouse models of KD/SBMA helps to identify candidate therapeutic tar-gets. Importantly, a common pattern of altered gene expression was observed in these indepen-dently generated models, each with a distinct genetic basis. This common pattern of gene expression raises the possibility of identifying genes which are sufficient to cause KD/SBMA symptoms. Elucidating the molecular bases of KD/SBMA is of great potential benefit as there is currently no treatment for the disease. Although the previous study greatly narrowed down the list of candidate genes, we were unable resolve which genes are androgen-dependent nor were we able to distinguish between genes that are associated with the onset of the disease and those that are associated with later stages of the disease process and may therefore be involved with compensation or degeneration.
In this paper we present a study of transcriptional changes that occur early and late in motor dysfunction progression and, importantly, are androgen-dependent. To do so, we elected to use one of the models of KD/SBMA used in our previous study, which has the unique advantage of having a severe phenotype following acute androgen treatment in females. This HSA-AR Tg
mouse model overexpresses wild-type AR exclusively in myocytes [9]. The HSA-AR model
strongly reproduces the sex limited (i.e., male) and androgen dependent features of the KD/ SBMA phenotype. Treating non-symptomatic females with testosterone (T) induces disease symptoms within 3 days (d) and severe symptoms typical of diseased males are seen by 7d. Using microarray analysis of gene expression within muscle from both Tg and WT females T-treated for 3 or 7d we are therefore able to determine which candidate genes are androgen dependent, and which are associated with the onset and later progression of KD/SBMA in this mouse model.
Materials and Methods
Animals
Ten WT C57BL/6J mice (5 males and 5 females, 70d old, Jackson Laboratories) were used to make the RNA reference samples. Fifteen female HSA-AR mice from Line 141 (6 Tg, 9 WT;
120–200d old) and 5 male HSA-AR Tg line 141 mice (110–130d of age) were used in this
analysis, decision to publish, or preparation of the manuscript.
study. The production, genotyping, and phenotyping of HSA-AR transgenic mice has been
de-scribed previously [9]. All animal experiments conformed to NIH guidelines and were
ap-proved by the University Animal Care Committee of the University of Toronto Mississauga (Approved protocol #20007262).
Five sample groups of 3 animals each were performed: Tg female 3d T treatment; Tg female 7d T treatment; WT untreated; WT 3d T treatment; and WT 7d T treatment. We additionally
used microarray data from HSA-AR males [11] to compare with HSA-AR females.
Testosterone Treatment and Animal Surgery
Briefly, all female mice (Tg or WT) used in this study were ovariectomized under isoflurane an-esthesia and received subcutaneous Silastic implants that were either empty or filled with crys-talline T (1.57mm inner diameter and 3.18mm outer diameter; effective release length of 6mm;
for more detail see [13]). Such T implants result in low physiological levels of T similar to those
found in adult males [13]. After 3 or 7d of T treatment, mice were put under surgical anesthesia
and all hindlimb muscles (where most mass comes from quadriceps) were harvested and im-mediately frozen in liquid nitrogen before storage at -80°C.
Total RNA Preparation
Frozen limb muscles were placed in TRizol Reagent (Invitrogen Corporation, Carlsbad, CA) and homogenized before RNA extraction. The total RNA extraction was performed according
to the manufacturer’s guidelines. After purification, the RNA concentrations were determined;
theA260/A280andA260/A230ratios were calculated as indices of protein and volatile com-pound contamination, respectively, using a spectrophotometer (NanoDrop ND-1000; Ther-moScientific). The integrity of the total RNA was determined by electrophoresis of glyoxylated RNA through 1.2% agarose gel and visualization by staining with ethidium bromide. Total RNA was then used for microarray analysis and quantitative RT-PCR experiments.
Sample Labeling and Microarray Hybridization
Two-color microarray experiments were performed using 38.5K oligo mouse MEEBO arrays (Mouse Ready Arrays, Microarrays Inc., Nashville, TN). This array contains 35,302 oligonucle-otide (70mer) probes, largely derived from constitutively expressed exons and represents ap-proximately 25,000 mouse genes. Cyanine dyes were directly incorporated into cDNA
synthesized from total RNA following the procedure of Neal et al. [14]. Briefly, 38l reactions
Microarray Data Analysis
Microarray images and quantification data were then imported into GeneTraffic DUO (Strata-gene, La Jolla, CA) for analysis. The data were normalized using the Lowess algorithm at the subgrid level while ignoring flagged values. After normalization of the data, lists of differential-ly expressed genes were obtained using GeneTraffic. A universal RNA reference sample made from WT (C57BL/6J) mice was utilized on each array. Triplicate arrays using RNA samples from the different experimental animals (i.e., 3 of Tg female with 3d T treatment, 3 of Tg fe-male with 7d T treatment, 3 of untreated WT fefe-males, 3 of WT fefe-male with 3d T treatment, 3 of WT female with 7d T treatment) were performed. Log2 ratios of experimental samples (Cy5) versus reference RNA (Cy3) were obtained. The log2 ratios of Tg mice samples were then subtracted from log2 ratios of WT to find differentially expressed genes (3d T-treated Tg subtracted from 3d T-treated WT, 7d T-treated Tg subtracted from 7d T-treated WT). log2 ra-tios of T-treated WT were subtracted from log2 ratio of untreated WT. Gene lists were filtered in GeneTraffic to include only those genes that displayed at least 2-fold difference and whose coefficient of variance was less than 100% and had a p-value less than 0.05 using a T-test. Dye swap experiments were not performed as previous experiments in our lab had demonstrated
that they do not appreciably alter the lists of differentially expressed genes [14].
Hierarchical cluster analysis was performed in GeneTraffic DUO using the Pearson
algo-rithm and average linkage [15]. Cluster figures were made using the MultiExperiment Viewer
(MeV) in the TM4 suite of software tools (http://www.tm4.org). All microarray data is
MIAME compliant and has been deposited in GEO (accession number: GSE61886).
Real Time Quantitative RT-PCR
A two-step approach was taken in which the initial reverse transcription was followed by the quantitative PCR amplification. After DNase I (Invitrogen Corporation, CA) treatment,
DNA-free total RNA was reverse transcribed using a dT20VN primer (Sigma, Oakville, ON) with
Su-perScript II. Each RNA reaction had a control reaction without reverse transcriptase to evaluate
any genomic DNA contamination. Twoμl of the diluted reaction was used as template for each
25μL RT-PCR amplification. Reactions were assembled using SYBR Green JumpStart Taq ReadyMix (Sigma, Oakville, ON) and assayed on an Mx4000 Multiplex Quantitative PCR Sys-tem (Stratagene, La Jolla, CA) according to the instructions of the manufacturer. Samples were incubated at 95°C for 10 min prior to thermal cycling (40 cycles of: 95°C for 30s, 57°C for 30s, and 72°C for 30s). In order to confirm the amplification specificity and identity of the PCR products, a melting curve analysis between 55°C and 95°C was also carried out automatically with the software attached to Mx4000. The completed reactions were heated to 95°C for 1 min and cooled to 55°C and reactions were re-heated in 1°C increments back to 95°C in order to plot a dissociation curve. After exporting the ROX-normalized fluorescence measurements to
Microsoft Excel, the program LinRegPCR [16], was used to determine the efficiency of each
re-action. These efficiencies were used in the final calculation of fold induction from the Ctvalues
and the expression of each test gene was normalized to the level of glyceraldehyse 3’
dehydroge-nase (GAPDH) within each sample prior to comparisons between samples.
Primer Design
The cDNA sequences for the genesGapdh, Tpm3(Tropomyosin 3),Ky(Kyphoscoliosis
pepti-dase),Tnni1(Troponin I),Mss51(MSS51 mitochondrial translational activator),Ptgds
(Prosta-glandin D2 synthase),Lcn2(Lipocalin 2),Ighg2a(immunoglobulin heavy constant gamma 2A)
andGdnf(Glial cell line derived neurotrophic factor) were obtained from GenBank. PCR
Primer3 software. All oligonucleotide sequences and primer pairs were checked with
OligoA-nalyzer 3.0 (http://scitools.idtdna.com/Analyzer/) for secondary structure and dimer
forma-tion. Each primer and amplicon sequence was tested using the nucleotide-nucleotide BLAST alignment tool to ensure minimal similarity with any other sequence. Synthesis of all primers
was performed by Invitrogen. Primer sequences used in this study can be found inS1 Table.
Functional Classification of Differentially Expressed Genes
Functional analysis of differentially expressed genes was performed using Functional Annota-tion Tool. The gene bank ID of differentially expressed genes were uploaded into the Database
for Annotation, Visualization and Integrated Discovery (DAVID) (http://david.abcc.ncifcrf.
gov) to obtain DAVID functional annotation. The genes were classified into functional groups
using GO TERM biological processes and molecular functions at levels 3 and up.
Results
Using microarray analysis, we characterized gene expression in hindlimb muscle of HSA-AR Tg female mice following 3 and 7d T treatment relative to WT females that received either 3 or 7d T treatment, respectively. WT females T-treated for 3 and 7d were compared to untreated WT females. Genes that displayed at least 2-fold difference from their comparison WT female
group andp-value smaller than 0.05 were identified. Complete gene lists and fold changes are
presented inS2 Tablefor Tg andS3 Tablefor WT mice).
We then performed hierarchical cluster analysis using these results in order to evaluate both T dependence of alterations in gene expression in skeletal muscle of KD/SBMA models and also to evaluate changes in gene expression that occur early in the disease progression. Tg fe-males begin losing motor ability 3d following T treatment and at 7d are comparable to Tg
males [9,13]. In contrast, no motor deficits or histopathology results from this treatment in
WT females. We can therefore compare the time course of T responsive genes in WT and Tg females to identify candidate genes involved in producing motor deficits characteristic of KD/ SBMA as well as rule out genes which are T differentially expressed in healthy female mice.
The hierarchical cluster analysis of genes that displayed at least a 2-fold difference from
sim-ilarly T-treated WT females and had ap<0.05 (Fig. 1) generated 12 distinguishable clusters. As
compared to WT mice with the same T treatment, downregulated genes were found in Tg mice after 3 and 7d of T treatment in clusters 5, 6 and upregulated genes were found in clusters 9,
10, 12 (Fig. 1). Generally, T-treated WT females did not show differential expression of most
genes, indicating that the disease allele in addition to T treatment, and not T treatment alone, is playing a major role in altering transcription. Clusters 2 (upregulated) and 8 (downregu-lated) contain genes that are differentially expressed in 3d, but not 7d treated females,
suggest-ing that those genes may be important ininitiatingmotor dysfunction. Cluster 9 contains
genes that are increased solely in the only in the 7d group, indicating that these genes may be
important later in the course of disease, and perhaps have a role inmaintainingdisease.
Fig. 2shows the relationship of differentially expressed genes in 3 and 7d Tg females and 7d
WT females. A total of 108 genes overlap between WT and Tg females, indicating that perhaps expression changes in these genes are a response to T and do not predict deficits in motor func-tion. Nevertheless, there are a total of 231 genes differentially expressed in both 3 and 7d T-treated Tg females, that are not differentially expressed in 7d WT females.
We next performed a functional classification on the differentially expressed genes from
Fig. 1for T-treated Tg females (i.e., clusters 5, 6, 9, 10, and 12) using Functional Annotation
Tool (DAVID Bioinformatics Resources) according to biological processes and molecular
indicated that the differentially expressed genes were implicated in a wide variety of gene ontol-ogy (GO) functions, including: muscle contraction and development, ion and nucleotide bind-ing, mitochondrion, myofibril, actin skeletal, glucose metabolism, ATPase, neuron
development, and vasculature development.
Fig 1. Hierarchical cluster analysis of gene expression in female HSA-AR Tg and WT mice after 3 and 7 days testosterone treatment.Cluster output represents colorimetrically indicated log2 ratio change. Female HSA-AR Tg and WT mice after 3 and 7 days testosterone treatment are represented by columns and rows represent a single gene. Clusters of genes differentially expressed in a similar pattern are labeled.
We then compared gene expression alterations in acutely T-treated Tg females with those we have previously reported for chronically diseased Tg males, which exhibit many similarities
in gene expression in skeletal muscle with polyQ mouse models of KD/SBMA [11]. This
com-parison allows us to identify which of the previously identified candidate genes are androgen dependent. A hierarchical cluster analysis of gene expression in Tg males and 3 and 7d T treat-ed Tg females generattreat-ed 18 distinguishable clusters (using a criteria of at least 2-fold change
and p<0.05;Fig. 3). Each of these clusters is represented with the mean pattern of expression
of the genes in each group; down and upregulated genes were found in clusters 5, 6, 7, 9 and 14, 15, 17, respectively. Note that many clusters are differentially expressed in a similar pattern Fig 2. Venn diagram of microarray results in female HSA-AR Tg mice after 3 and 7 days testosterone treatment and WT mice after 7 days testosterone treatment.Diagram representing the number of genes whose expression differed from controls. Gene numbers were obtained by examining gene lists generated by a 2-fold, p<0.05 criterion.
Table 1. Functional clustering of differentially expressed genes in female Tg (as compared to WT) with testosterone treatment.
Function Go Terms Number of down-regulated genes Number of up-regulated genes
muscle contraction regulation of muscle contraction 4
sarcoplasmic reticulum 7
muscle contraction 13
mitochondrion mitochondrion 31 12
organelle envelope 15 6
mitochondrial membrane 12 6
glucose metabolism glucose metabolic process 9 glycogen metabolic process 6
Actin actin cytoskeleton 10 4
actin binding 6 6
Myofibril myofibril 9 6
sarcomere 8 6
muscle development muscle organ development 7 6
striated muscle cell development 4 5
muscle cell differentiation 4 4
ion binding ion binding 49 25
calcium ion binding 20
zinc ion binding 17
ion transport ion transport 13
voltage-gated channel activity 6 potassium channel activity 3
ATPase ATPase activity 4
ATP metabolic process 5
nucleotide binding nucleotide binding 30 12
ATP binding 20 12
phosphate metabolism phosphate metabolic process 10
phosphorylation 7
skeletal development skeletal system development 5
bone development 3
neuron neuron/nervous system development 3 4
neuron differentiation 3 3
neurogenesis 3
vasculature development vasculature development 5
blood vessel development 5
cell adhesion cell adhesion 7
biological adhesion 7
proteolysis proteolysis 10
peptidase activity 6
oxidation reduction oxidation reduction 6
oxidoreductase 4
cell motion cell motion 4
cell motility 3
protein transport protein transport 3
protein localization 3
apoptosis apoptosis 4
programmed cell death 4
between chronically diseased Tg males and acutely diseased Tg females (clusters 5, 7, 9, 14, 15, 17), suggesting that those disease processes occurring early on may persist, and that these changes may be important in maintaining motor dysfunction. There are also some clusters that show differential gene expression in 3d females (clusters 4, 6, and 12) but not in the more se-verely affected females (7d treated) or chronically diseased males. Additionally, cluster 2 shows opposite responses between the 3d females and the more affected 7d females and males. The Fig 3. Hierarchical cluster analysis of gene expression in male AR Tg (M-141) and female HSA-AR Tg after 3 days (F-T3d) and 7 days (F-T7d) testosterone treatment.Cluster output represents colorimetrically indicated log2 ratio change. Male Tg mice and female Tg mice after 3 and 7 days testosterone treatment are represented by columns and rows represent a single gene. Clusters of genes differentially expressed in a similar pattern are labeled.
genes that are altered early on in the 3d group may be important for initiating motor
dysfunc-tion. Complete gene lists and fold changes are presented inS4 Table.
Furthermore, examining the overlap between genes differentially expressed after 3 and 7d T treatment in females and Tg males helps us to distinguish between genes which initiate pathol-ogy from those that are more likely involved with more chronic wasting or compensatory changes. A Venn diagram shows that at least 127 genes are differentially expressed in all three
groups: T-treated Tg females (3 and 7d) and Tg males (Fig. 4).
Another advantage to the current study is that we are able to identify early, transient changes in gene expression following T exposure (i.e., genes that are differentially expressed in
Fig 4. Venn diagram of microarray results in male HSA-AR Tg (M-141) and female HSA-AR Tg after 3 days (F-T-3days) and 7 days (F-T-7days) testosterone treatment.Diagram representing the number of genes whose expression differed from controls. Gene numbers were obtained by examining gene lists generated by a 2-fold, p<0.05 criterion.
3d treated females but not in 7d treated Tg females and Tg males). There are a total of 203 genes that are differentially expressed specifically in Tg females treated for only 3d, but not dif-ferentially expressed in the animals exposed to disease and motor dysfunction for longer. Thus, it is possible that these temporary changes are not critical for maintaining disease progression.
Perhaps the most interesting and valuable comparisons are those between disease-induced Tg female and unmanipulated male KD/SBMA mice (described above). Genes that overlap
be-tween the females in the current study and the three male models from Mo et al. [11] lend
in-sight into gene expression changes that are androgen dependent and consistently associated with motor dysfunction. We chose the 7d treated female group rather than 3d as their motor ability is comparable to diseased male KD/SBMA mice. A total of 20 genes were found to
over-lap across the four groups (Table 2). Note that some of these genes were also differentially
ex-pressed in other models like Huntington’s disease (HD; [17]), AR knock out (ARKO; [18]),
and Atrophy [19,20] (Table 2). The significance and possible relationship of these candidate
genes to the disease process is described further below.
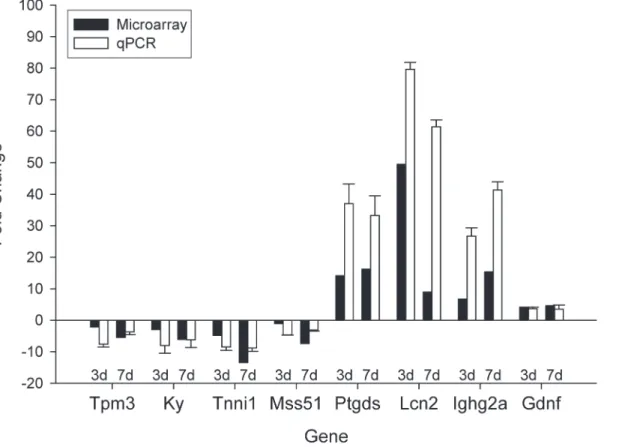
Finally, to validate our microarray analysis, we performed quantitative real-time PCR (qRT-PCR) on several important genes with higher, middle, and lower levels of mRNA as detected
by the microarray (Fig. 5). Genes included: MSS51 mitochondrial translational activator
(Mss51), Tropomyosin 3 (Tpm3), Kyphoscoliosis peptidase (Ky), Troponin I (Tnni1),
Prosta-glandin D2 synthase (Ptgds), Lipocalin 2 (Lcn2), immunoglobulin heavy constant gamma 2A
(Ighg2a) and Glial cell line derived neurotrophic factor (Gdnf). All samples were compared to WT controls to evaluate fold changes. Although the magnitudes of changes in levels of mRNA Table 2. The list and fold change of differentially expressed genes found in three KD/SBMA mouse models (as compared to WT controls) and female HSA-AR Tg mice with 7 days testosterone treatment (as compared to WT with 7 days testosterone treatment).
ID Symbol UniGene Name Female 141–7d Male 141 Tg 97Q KI 113Q Also in other models
AK009352 Nmrk2 Nicotinamide riboside kinase 2 -9.71 -4.63 -81.97 -13.01 ARKO
NM_008832 Phka1 Phosphorylase kinase alpha 1 -2.85 -5.46 -5.54 -3.95 Atrophy
NM_009505 Vegfa Vascular endothelial growth factor A -2.73 -1.86 -5.11 -2.22 NM_009601 AChRb Cholinergic receptor (acetylcholine receptor) 2.25 3.20 4.89 2.03 HD
NM_010135 Enah Enabled homolog 4.76 3.63 3.97 2.01
NM_010271 Gpd1 Glycerol-3-phosphate dehydrogenase 1 -3.58 -2.49 -7.15 -2.72 HD NM_010585 Itpr1 Inositol 1,4,5-triphosphate receptor 1 -2.46 -8.72 -3.43 -5.94 HD
NM_013456 Actn3 Actinin alpha 3 -2.38 -4.59 -5.10 -1.93 HD
NM_013602 Mt1 Metallothionein 1 2.22 3.78 2.69 2.45 Atrophy
NM_017379 Tuba8 Tubulin, alpha 8 -2.01 -3.36 -2.71 -2.21 HD
NM_023049 Asb2 Ankyrin repeat and SOCS box-containing protein 2 -5.03 -3.45 -2.28 -2.92
NM_026633 RIKEN cDNA 9530058B02 gene -4.44 -2.73 -3.11 -2.54
NM_030143 Ddit4l DNA-damage-inducible transcript 4-like -3.14 -6.45 -6.23 -5.51
NM_145533 Smox Spermine oxidase -3.20 -7.27 -33.20 -15.25 ARKO
NM_153744 Prkag3 Protein kinase, AMP-activated, gamma 3 -3.01 -2.52 -2.51 -2.06
NM_175031 Stk36 Serine/threonine kinase 36 -2.16 -2.19 -3.41 -3.42
NM_181390 Mustn1 Musculoskeletal, embryonic nuclear protein 1 5.17 2.92 11.01 5.57 NM_207530 Osbpl1a Oxysterol binding protein-like 1A 2.50 3.57 2.51 2.14
NM_029104 Mss51 Mitochondrial translational activator -7.36 -9.47 -8.79 -32.22 ARKO XM_358335 Cacna1s Calcium channel, voltage-dependent, alpha 1S -3.43 -2.97 -2.76 -2.08
Some of these genes were also differentially expressed in other models like Huntington’s disease (HD; [17]), AR knock out (ARKO; [18]), and Atrophy [19,20].
were different, qRT-PCR analyses were consistent with microarray results and similar patterns of regulation in female Tg mice with T were observed.
Discussion
In this study, we examined the transcriptional changes in muscles of females that overexpress
ARspecifically in myocytes. Following 7d of T treatment, motor dysfunction is profound in
these mice, comparable to their chronically diseased male siblings [13]. We found that many of
the genes dysregulated in muscle of KD/SBMA male mice [11] are also dysregulated in females,
indicating that these specified genes are both T-dependent, thus relevant for KD/SBMA,and
important in early disease progression rather than a byproduct of prolonged disease. A total of 20 commonly differentially expressed genes were identified in 7d T-treated HSA-AR females
and three previously characterized male mouse models (HSA-AR, 97Q, and 113Q;Table 2).
Notably, many of the candidate genes are involved in muscle regeneration and/or differenti-ation. Dysregulation of such genes may explain the inability of these mice to maintain muscle
fiber integrity and thus endure motor tests. For example, expression of theNmrk2gene
(previ-ously known asItgb1bp3) is decreased. This codes for the protein MIBP and is important for
communication with laminin in the extracellular matrix. It is expressed at high levels prior to
myoblast fusion and decreases following differentiation [21].Asb2(codes for a subunit of E3
ubiquitin ligase complex) is also downregulated. This gene is induced during myogenic
differ-entiation and a knockdown of it leads to delayed myotube formation [22].Stk36(coding for
Fig 5. Validation of the results of microarray experiments by qRT-PCR analysis.Overall, we find consistency between qPCR and microarray analysis. Genes of varying fold changes were chosen to demonstrate the validity of microarray data. Bars show Tg females treated with testosterone for 3 days as compared to WT treated for 3 days, and Tg females treated for 7 days as compared to female WT treated for 7 days. Error bars represent standard error of the mean.
homolog of the Drosophila Fused gene) is reduced in female and male KD/SBMA muscle. This protein is important in vertebrates as demonstrated by its effects on muscle differentiation in
zebrafish, acting via the hedgehog pathway [23]. However, knocking out this gene in mice did
not cause apparent detrimental effects [24].Smoxis downregulated in all of the male models
and in females treated with T for 3 or 7d. The protein coded by this gene, spermine oxidase, is important for maintaining polyamine homeostasis. It is associated with muscle differentiation
and increases during late differentiation stages [25]. Furthermore, some diseases are associated
with dysregulation of spermine oxidase, and inhibition of polyamine catabolism can be fatal
(reviewed in [26]). Additionally, theGpd1gene (coding for glycerol-3-phosphate
dehydroge-nase 1) is important in lipid biosynthesis and also linked to muscle cell differentiation, being
expressed more in adult muscle [27]. We detected decreased expression ofGpd1in adult KD/
SBMA muscle, indicating a shift towards more myoblasts suggestive of a regenerative response. Alternatively, it may be a side effect of weight loss, as a decrease has been reported in humans
following gastric bypass surgery [28].
TheEnahgene codes for the Mena protein in mammals and is important for cytoskeletal
actin dynamics [29]. A recent study demonstrated that overexpression of Mena in cardiac
myo-cytes caused hypertrophy and negatively impacted heart function following injury, leading to
contractile dysfunction [30]. We show that expression ofEnahis increased in skeletal muscle
of KD/SBMA mice, which may lead to perturbed myocyte homeostasis and/or regeneration
ability. Another gene important for maintaining myocyte homeostasis isPrkag3, as it codes for
the gamma-3 subunit of the AMP-activated protein kinase (AMPK). Activation of AMPK re-sults in glucose uptake, which is important during muscle contraction. Also, differentiation of
myoblasts to myocytes results in increased gamma-3 mRNA.Prkag3transcripts were reduced
in KD/SBMA muscle, which may lead to altered contraction ability.Mustn1transcripts (which
code for Mustang) are increased in KD/SBMA muscles of female and male models.
Upregula-tion of this gene occurs during adult regeneraUpregula-tion, hypertrophy, and exercise [31,32]. Increased
Mustang in KD/SBMA mice may contribute to their ability to recover following T removal [8,9,12,13].
Denervation-like responses are also present in muscles of these KD/SBMA mice. For
exam-ple, an AchR subunit (alpha) was upregulated in the HSA-AR model [9,13]. The current study
revealed that the beta polypeptide 1 subunit (AchRb) is also increased, which is also
representa-tive of what occurs in the denervated diaphragm and inmdxmice [33].
We observedVegfadownregulation in T-treated HSA-AR females in the current study,
which is consistent with what was previously reported in male and female KD/SBMA mice
[9,11,13,34]. Interestingly, local application of this growth factor at the muscle ameliorates
axo-nal transport deficits in HSA-AR and 113Q male mice [35] and improves disease progression
in an amyotrophic lateral sclerosis rat model [36]. TheOsbpl1agene, coding for oxysterol
bind-ing protein-like 1A (ORP1l), is important for positionbind-ing late endosomes [37] and is
upregu-lated in KD/SBMA muscle. Overexpression of ORP1l results in reduced endosome motility
[38]. Furthermore, ORP1l interacts with Rab7 [39], a GTPase that is important for vesicle
traf-ficking. Rab7 is important for trafficking neurotrophic factors such as BDNF and its receptor
[40] and thus impairments in ORP1l regulation may ultimately deprive the muscle and/or
mo-toneuron of receiving growth factor signals. Additionally, theTuba8gene codes for an alpha
tubulin, which makes up cytoskeletal microtubules. Its downregulation in KD/SBMA muscle may contribute to deficits in growth factor transport.
Proteins involved in calcium handing are downregulated in muscle of KD/SBMA mouse
models (Itpr1, inositol 1,4,5-triphosphate receptor 1 andCacna1s, voltage-dependent calcium
channel alpha 1s). Oki et al. [41] examined contractile properties of T-treated HSA-AR females
handling. Additionally, we note deficits in transcript levels ofActn3(Actinin alpha 3) in KD/ SBMA muscle. Actn3 knockout results in reduced glycogen phosphorylase activity in mice and
slower calcium handling kinetics in cultured primary mouse myotubes [42]. Decreased
expresstion of these three genes may contribute to some of the contractile deficits examined in
Oki et al. [41].
In the current study we present data for which androgen-dependent transcriptional alter-ations occur during KD/SBMA disease onset. It would be interesting in the future to identify transcriptional alterations that occur during recovery (either castration in males or T-removal in females). This will be particularly useful for identifying those genes which mediate recovery. Furthermore, those genes that do not change during early recovery can be ruled out as they are not involved in motor improvements. Likewise, those genes that are differentially expressed prior to any T treatment in Tg females with intact motor function might also be excluded as important in disease progression, as they may be differentially expressed solely due to transgene presence.
Supporting Information
S1 Table. List of primers used for quantitative RT-PCR validation of microarray results. (XLS)
S2 Table. Genes altered in transgenic females following testosterone treatment.Genes al-tered in transgenic muscle following 3D or 7D testosterone treatment. For inclusion, each gene
had to appear in the gene list generated by a 2 fold change, p0.05 criteria. Fold change values
relative to wildtype controls treated for equivalent time are presented, as are Genbank acces-sion numbers, unigene symbols and names.
(XLS)
S3 Table. Genes altered in wildtype females following testosterone treatment.Genes altered in wildtype muscle following 3D or 7D testosterone treatment. For inclusion, each gene had to
appear in the gene list generated by a 2 fold change, p0.05 criteria. Fold change values relative
to untreated wildtype controls are presented, as are Genbank accession numbers, unigene sym-bols and names.
(XLS)
S4 Table. Comparison of genes altered in transgenic males with those altered in transgenic females following testosterone treatment.Genes altered in transgenic males relative to
wild-type males [11] and transgenic females treated with testosterone relative to wildtype controls
treated for equivalent time relative to wildtype muscle following 3D or 7D testosterone treat-ment. Fold change values, as are Genbank accession numbers, unigene symbols and names. (XLS)
Author Contributions
Conceived and designed the experiments: KM JTW DAM. Performed the experiments: KM. Analyzed the data: KH KM JTW DAM. Wrote the paper: KH KM JTW DAM.
References
1. Kennedy WR, Alter M, Sung JH (1968) Progressive proximal spinal and bulbar muscular atrophy of late onset. A sex-linked recessive trait. Neurology 18: 671–680. PMID:4233749
3. Boyer JG, Ferrier A, Kothary R (2013) More than a bystander: the contributions of intrinsic skeletal mus-cle defects in motor neuron diseases. Front Physiol 4: 356. doi:10.3389/fphys.2013.00356PMID: 24391590
4. Dupuis L, Echaniz-Laguna A (2010) Skeletal muscle in motor neuron diseases: therapeutic target and delivery route for potential treatments. Curr Drug Targets 11: 1250–1261. PMID:20840067
5. Jordan CL, Lieberman AP (2008) Spinal and bulbar muscular atrophy: a motoneuron or muscle dis-ease? Curr Opin Pharmacol 8: 752–758. doi:10.1016/j.coph.2008.08.006PMID:18775514
6. Monks DA, Rao P, Mo K, Johansen JA, Lewis G, et al. (2008) Androgen receptor and Kennedy dis-ease/spinal bulbar muscular atrophy. Horm Behav 53: 729–740. doi:10.1016/j.yhbeh.2007.12.009 PMID:18321505
7. Rocchi A, Pennuto M (2013) New routes to therapy for spinal and bulbar muscular atrophy. J Mol Neu-rosci 50: 514–523. doi:10.1007/s12031-013-9978-7PMID:23420040
8. Yu Z, Dadgar N, Albertelli M, Gruis K, Jordan C, et al. (2006) Androgen-dependent pathology demon-strates myopathic contribution to the Kennedy disease phenotype in a mouse knock-in model. J Clin In-vest 116: 2663–2672. PMID:16981011
9. Monks DA, Johansen JA, Mo K, Rao P, Eagleson B, et al. (2007) Overexpression of wild-type androgen receptor in muscle recapitulates polyglutamine disease. Proc Natl Acad Sci U S A 104: 18259–18264. PMID:17984063
10. Cortes CJ, Ling SC, Guo LT, Hung G, Tsunemi T, et al. (2014) Muscle expression of mutant androgen receptor accounts for systemic and motor neuron disease phenotypes in spinal and bulbar muscular at-rophy. Neuron 82: 295–307. doi:10.1016/j.neuron.2014.03.001PMID:24742458
11. Mo K, Razak Z, Rao P, Yu Z, Adachi H, et al. (2010) Microarray analysis of gene expression by skeletal muscle of three mouse models of Kennedy disease/spinal bulbar muscular atrophy. PLoS One 5: e12922. doi:10.1371/journal.pone.0012922PMID:20886071
12. Katsuno M, Adachi H, Kume A, Li M, Nakagomi Y, et al. (2002) Testosterone reduction prevents pheno-typic expression in a transgenic mouse model of spinal and bulbar muscular atrophy. Neuron 35: 843– 854. PMID:12372280
13. Johansen JA, Yu Z, Mo K, Monks DA, Lieberman AP, et al. (2009) Recovery of function in a myogenic mouse model of spinal bulbar muscular atrophy. Neurobiol Dis 34: 113–120. doi:10.1016/j.nbd.2008. 12.009PMID:19211034
14. Neal SJ, Gibson ML, So AK, Westwood JT (2003) Construction of a cDNA-based microarray for Dro-sophila melanogaster: a comparison of gene transcription profiles from SL2 and Kc167 cells. Genome 46: 879–892. PMID:14608405
15. Eisen MB, Spellman PT, Brown PO, Botstein D (1998) Cluster analysis and display of genome-wide ex-pression patterns. Proc Natl Acad Sci U S A 95: 14863–14868. PMID:9843981
16. Ramakers C, Ruijter JM, Deprez RH, Moorman AF (2003) Assumption-free analysis of quantitative real-time polymerase chain reaction (PCR) data. Neurosci Lett 339: 62–66. PMID:12618301
17. Strand AD, Aragaki AK, Shaw D, Bird T, Holton J, et al. (2005) Gene expression in Huntington's disease skeletal muscle: a potential biomarker. Hum Mol Genet 14: 1863–1876. PMID:15888475
18. MacLean HE, Chiu WS, Notini AJ, Axell AM, Davey RA, et al. (2008) Impaired skeletal muscle develop-ment and function in male, but not female, genomic androgen receptor knockout mice. FASEB J 22: 2676–2689. doi:10.1096/fj.08-105726PMID:18390925
19. Sacheck JM, Hyatt JP, Raffaello A, Jagoe RT, Roy RR, et al. (2007) Rapid disuse and denervation atro-phy involve transcriptional changes similar to those of muscle wasting during systemic diseases. FASEB J 21: 140–155. PMID:17116744
20. Lecker SH, Jagoe RT, Gilbert A, Gomes M, Baracos V, et al. (2004) Multiple types of skeletal muscle at-rophy involve a common program of changes in gene expression. FASEB J 18: 39–51. PMID: 14718385
21. Li J, Mayne R, Wu C (1999) A novel muscle-specific beta 1 integrin binding protein (MIBP) that modu-lates myogenic differentiation. J Cell Biol 147: 1391–1398. PMID:10613898
22. Bello NF, Lamsoul I, Heuze ML, Metais A, Moreaux G, et al. (2009) The E3 ubiquitin ligase specificity subunit ASB2beta is a novel regulator of muscle differentiation that targets filamin B to proteasomal degradation. Cell Death Differ 16: 921–932. doi:10.1038/cdd.2009.27PMID:19300455
23. Wolff C, Roy S, Ingham PW (2003) Multiple muscle cell identities induced by distinct levels and timing of hedgehog activity in the zebrafish embryo. Curr Biol 13: 1169–1181. PMID:12867027
25. Cervelli M, Fratini E, Amendola R, Bianchi M, Signori E, et al. (2009) Increased spermine oxidase (SMO) activity as a novel differentiation marker of myogenic C2C12 cells. Int J Biochem Cell Biol 41: 934–944. doi:10.1016/j.biocel.2008.09.009PMID:18852063
26. Cervelli M, Amendola R, Polticelli F, Mariottini P (2012) Spermine oxidase: ten years after. Amino Acids 42: 441–450. doi:10.1007/s00726-011-1014-zPMID:21809080
27. Dobson DE, Groves DL, Spiegelman BM (1987) Nucleotide sequence and hormonal regulation of mouse glycerophosphate dehydrogenase mRNA during adipocyte and muscle cell differentiation. J Biol Chem 262: 1804–1809. PMID:3027100
28. Park JJ, Berggren JR, Hulver MW, Houmard JA, Hoffman EP (2006) GRB14, GPD1, and GDF8 as po-tential network collaborators in weight loss-induced improvements in insulin action in human skeletal muscle. Physiol Genomics 27: 114–121. PMID:16849634
29. Gertler FB, Niebuhr K, Reinhard M, Wehland J, Soriano P (1996) Mena, a relative of VASP and Dro-sophila Enabled, is implicated in the control of microfilament dynamics. Cell 87: 227–239. PMID: 8861907
30. Belmonte SL, Ram R, Mickelsen DM, Gertler FB, Blaxall BC (2013) Cardiac overexpression of Mam-malian enabled (Mena) exacerbates heart failure in mice. Am J Physiol Heart Circ Physiol 305: H875– 884. doi:10.1152/ajpheart.00342.2013PMID:23832697
31. Krause MP, Moradi J, Coleman SK, D'Souza DM, Liu C, et al. (2013) A novel GFP reporter mouse re-veals Mustn1 expression in adult regenerating skeletal muscle, activated satellite cells and differentiat-ing myoblasts. Acta Physiol (Oxf) 208: 180–190. doi:10.1111/apha.12099PMID:23506283
32. Vuocolo T, Byrne K, White J, McWilliam S, Reverter A, et al. (2007) Identification of a gene network contributing to hypertrophy in callipyge skeletal muscle. Physiol Genomics 28: 253–272. PMID: 17077277
33. Ghedini PC, Viel TA, Honda L, Avellar MC, Godinho RO, et al. (2008) Increased expression of acetyl-choline receptors in the diaphragm muscle of MDX mice. Muscle Nerve 38: 1585–1594. doi:10.1002/ mus.21183PMID:19016551
34. Sopher BL, Thomas PS Jr., LaFevre-Bernt MA, Holm IE, Wilke SA, et al. (2004) Androgen receptor YAC transgenic mice recapitulate SBMA motor neuronopathy and implicate VEGF164 in the motor neuron degeneration. Neuron 41: 687–699. PMID:15003169
35. Kemp MQ, Poort JL, Baqri RM, Lieberman AP, Breedlove SM, et al. (2011) Impaired motoneuronal ret-rograde transport in two models of SBMA implicates two sites of androgen action. Hum Mol Genet 20: 4475–4490. doi:10.1093/hmg/ddr380PMID:21873607
36. Krakora D, Mulcrone P, Meyer M, Lewis C, Bernau K, et al. (2013) Synergistic effects of GDNF and VEGF on lifespan and disease progression in a familial ALS rat model. Mol Ther 21: 1602–1610. doi: 10.1038/mt.2013.108PMID:23712039
37. Rocha N, Kuijl C, van der Kant R, Janssen L, Houben D, et al. (2009) Cholesterol sensor ORP1L con-tacts the ER protein VAP to control Rab7-RILP-p150 Glued and late endosome positioning. J Cell Biol 185: 1209–1225. doi:10.1083/jcb.200811005PMID:19564404
38. Vihervaara T, Uronen RL, Wohlfahrt G, Bjorkhem I, Ikonen E, et al. (2011) Sterol binding by OSBP-re-lated protein 1L regulates late endosome motility and function. Cell Mol Life Sci 68: 537–551. doi:10. 1007/s00018-010-0470-zPMID:20690035
39. Johansson M, Lehto M, Tanhuanpaa K, Cover TL, Olkkonen VM (2005) The oxysterol-binding protein homologue ORP1L interacts with Rab7 and alters functional properties of late endocytic compartments. Mol Biol Cell 16: 5480–5492. PMID:16176980
40. Deinhardt K, Salinas S, Verastegui C, Watson R, Worth D, et al. (2006) Rab5 and Rab7 control endocy-tic sorting along the axonal retrograde transport pathway. Neuron 52: 293–305. PMID:17046692
41. Oki K, Wiseman RW, Breedlove SM, Jordan CL (2013) Androgen receptors in muscle fibers induce rapid loss of force but not mass: implications for spinal bulbar muscular atrophy. Muscle Nerve 47: 823–834. doi:10.1002/mus.23813PMID:23629944