A parametric and indexing method for
faces and textures recognition
Tarek FRIKHA1, Yamen SIALA2, Kais LOUKIL3, Wijden REKIK4, Mohamed ABID5
1,3,4,5
Sfax University, National engineering school of Sfax, CES Laboratory, Sfax, TUNISIA 2
Sfax University, National engineering school of Sfax, REGIM Laboratory, Sfax, TUNISIA
Abstract
Image recognition which is one large library of images is really an important topic in multimedia research. Several methods such as wavelet transform or raw pyramid transform methods are used in image recognition. Many other techniques which are based on
statistical image’s analysis exist. These methodsusing statistics give interesting results without being touching the images characteristics. The proposed approach is based on multi resolution and wavelet transform. The chosen distance for distance comparison is the Kullback-Lieber one. This approach is tested for texture images and for facial recognition one.
Keywords:Indexing set; face; texture; wavelet transform; Kullback Lieber distance; Gaussian distribution
1. Introduction
Images and videos span all aspects of life. In fact, due to the technological and electronic progress, increases in resolution and quality of images and videos are likewise expected to continue. Digital cameras and camcorders are more available and surround everybody.
In the world of ever-growing data capacity, computers can store vast amounts of data and make them more available and accessible to users and the progress of the Internet makes it easier.
Thanks to the Internet which allows the exchange of data between more than a hundred Internet-linked countries worldwide, computer users can remotely access to the other computers and information stores easily. This makes the Internet an enormous carrier of various information resources and services, such as text and multi-media data: pictures, music, videos, etc.
Indexing the Internet [1] (the global index model) is the fashionable approach to meet these needs and to information discovery. Thanks to search engines such as Google, Yahoo, MSN, etc. and online encyclopedias like Wikipedia which are an attractive manner lending to efficient navigation, finding documents becomes more simple by using simply a keyword. For texts, indexing produces [2] satisfying results while searching images is not efficient. In Indeed, we can make as a query "portrait of Lena" and find the desired image as a place far away as well as full other irrelevant results.
In this paper we represent our approach. The aim of this work is to compare different images and to sort them by the nearest in term of Kullback-Lieber distance.
This paper is organized into three sections. Section 2 presents the state of art of indexing and the choice of the index method used. In section 3, we summarize the theoretical study of our work in the first part and different results in the second part. Section 4 concludes.
2. Description of the indexing the method
based on wavelet transform
The main purpose of this paper consists in the implementation of an algorithm which aims at finding similar images to some image of reference.
The intuitive solution consists in making a pixel by pixel comparison which is actually efficient but very time consuming especially for large image.
To do so, we use a method based on wavelet transform. This mathematical tool transforms an image to a set of sub-bands with low sizes. Thanks to wavelets, we get all the characteristics of the image represented by the different sub bands. Thus, to compare two images, we compare the sub-bands.
This method enables indexation by taking into account certain characteristics of the image and reducing computing time as sub bands have small sizes.
2.1 Different indexing methods
In this part, different indexing methods are represented. We’ll
represent textual indexing and visual indexing methods.
2.1.1
Textual indexing
The textual indexing can be either manual or automatic. Manual indexing is on one hand subjective as it depends on users who judge information is relevant or not and on other hand expensive.
2.1.2
Visual indexing [3]:
The first technique consists in comparing two images point by point. Although it calculates the real difference between two images, this method does not consider the semantic content of the image. It depends on the angle of view of the object and it is not robust to classical transformations that can be applied to images such as symmetries, translations, rotations, changes of scale, etc.
Computational techniques on similarities related to the content of the image have been found.
We can distinguish between two types of attributes:
Reversible attributes:
These attributes describe the image and enable the reconstruction of the image (the Fourier transforms for example).
Non-reversible attributes:
These attributes are called also signatures. They characterize the image but they cannot enable us to reconstruct the image. For example, the color, texture and shape, are signatures. The common used attributes are color, texture and shape. After describing the techniques used for each of them, we will see how we can use transforms to extract directly data indexing.
2.2 Wavelet Transform
2.2.1
Mathematical definition
A wavelet transform is the representation of a function by wavelets. The wavelets are scaled and translated copies and known as "daughter wavelets" of a mother wavelet [4]. The Wavelet functions constitute the family of functions
ψ
a,b:Where a is a positive scale and b definesthe shift. It’sany real number.
The wavelet function is characterized by:
•
The inevitability of the transform involving the condition of eligibility following the functionψ:
where Ψ (ω) the Fourier transform of ψ.
• A null average:
2.2.2
2D wavelet transform:
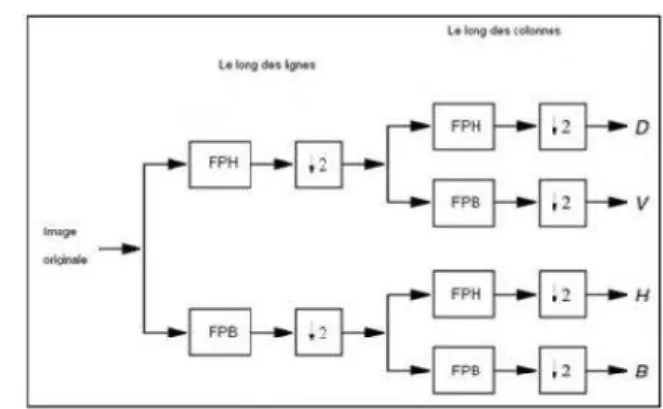
Working on images means the use of the 2D wavelet transform. This transformation is first of all applied on rows row by row and then column by column. Thus, we get four smaller detail images [5]:
• The smaller detail image on the upper left contains the approximation of the original image.
• The smaller detail image on the upper right contains horizontal details.
• The smaller detail image on the lower left contains vertical details.
• The smaller detail image on the lower right contains details of the diagonal.
The procedure of decomposition is described in Figures 1 and 2.
Figure 1: Representation of a stage of Wavelet Transform
The different steps of decomposition can be cascaded together while decomposing periodically the baseband; the sub-bands in this case are usually arranged in to get the pyramid form as it is shown in the Figure. In fact, the sub-band Sj is the sub band of S at the stage j of the decomposition. Sϵ{H, V, D, B}.
The four obtained sub-bands have the same size. The number of pixels of the sub-bands is equal to the sum of the original
image’s pixels.
For example, in Figure 1 and 2, the sub bands are extracted from an original image where its size is 512*512. We obtain a pyramid form after applying the wavelet transform to the sub-band Bi and this process is applied iteratively until getting the number of desired stages.
As it is shown in Figure 2, after the first decomposition, we get D1, V1, H1 and B1. We apply the Wavelet transform to B1 and we obtain D2, V2 and H2 and B2. Applying this mathematical tool to B2, results in getting the sub bands D3, V3, H3 and B3.
The different sub-bands have the following sizes: The size of D1, V1, H1 and B1 is 256 * 256 pixels. The size of D2, V2, H2 and B2 is 128 * 128 pixels.
The size of D3, V3, H3 and B3 is 64 * 64 pixels.
Appro-ximation
Virtual data
horizon-tal data
Diagonal data
M
N
M/2
N/2
3. Global indexing method
3.1 Theoretical study:
The main use of the global method consists in generating a histogram composed of the coefficients of sub band after applying wavelet transform. The signature of our image is represented by a vector obtained by juxtaposing the histograms. So that, comparing two images requires comparing their signatures. The Kullback-Lieber function is used for comparison. To make a compact signature of the image, we should restraint the number of stages considered for making histograms.
For each sub band, the coefficients of a wavelet transform are distributed with respect to the Gaussian distribution. This approach is justified for different thigh frequencies images. The Gaussian distribution follows the equation [6]:
Where:
• α: scale parameter representing the standard deviation in the case of a classic Gaussian distribution.
• β: shape parameter: it determines the decrease in speed in the probability density (2 in the case of a Gaussian distribution and 1 in the Laplacian one).
• Γ: it is the gamma function having the following expression:
Figure 3 represents a comparison between the histogram of a red-colored sub band image and its Gaussian distribution
parameters α and β.
In order to set up the parameters ὰand β of the Gaussian
distribution, we use the coefficients of the selected sub band. X is the vector containing thecoefficients: x=(x1….xl).
According to Varanasi and Aazhang [7], an estimation of the maximum of similarity is used to calculate values (α, β). We suppose that the coefficients xi are independent and identically distributed.
We identify the likeness function V satisfying the number of points L in the compared vector:
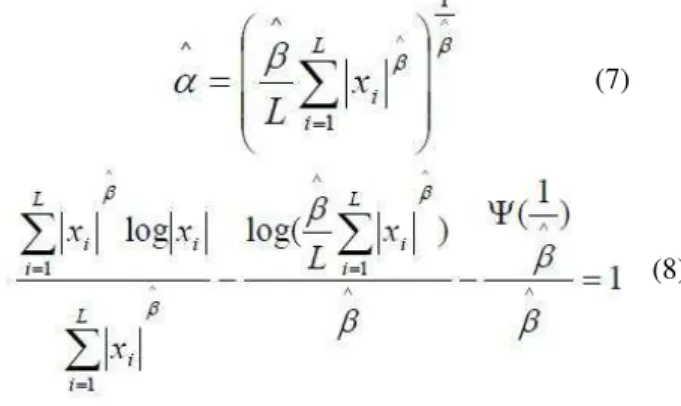
To findthis maximum, we derive (3) with respect to αthen to
β, weobtain the following equations:
With the function ψ (or digamma function) defined as:
For β> 0, the values are calculated by solving the following equations:
The value of β is calculated by solving the equation (7). We notice that the equation (7) is not a linear equation which makes its resolution difficult.
To deal with this problem, we use the method of Newton-Raphson for its efficiency and its rapid convergence.
To compare the different images, we use the Kullback-Lieber distance.
For the Gaussian used model, the probability of wavelet coefficients distribution (PDF) in each sub-band is defined by the variables:α,β.
Basing on a parametric approach, the density of the probability knowing the hypothesis p(X|Hi) could be modeled by the elementp(X; θi)of the PDF familywhere θiis a series ofmodel’s parameters.
The criterion of the maximum of similarity is equivalent to:
By introducing the equation (3) in (9), we obtain a distance similar to the Kullback-Leiber one (KLD) between two Gaussian distributions:
(9) (3)
(4)
(5)
(6)
(2)
(7)
(8)
Therefore, comparing the similarity between two sub-bands of two images after the wavelet transform could be done easily. To make the model more efficient and to generalize it, we should use several sub-bands and not just one. The used sub bands are those mentioned previously (Figure 4). Different wavelet coefficients are independents in each sub bands. This independences enables computing the Kullback distance between two images without redundancy: this distance is the sum of the Kullback distances related to the sub-bands. [8] We obtain the following formula:
Where B is the number of the analyzed sub-bands. I1 and I2 are the images that will be compared.
3.2 Our results:
We focused on the textures using the Vistex library [9] and for the portraits; we chose three portraits which are taken from different places, and with different luminosities and contrasts. After determining the variables:α, β,Gaussian parameters are superposed to those variables on the histograms of each sub band. So, we obtain Gaussian histograms which characterize correctly the histograms of sub bands.
In this work, we used colored images.
We note that if the textures with the gray level give relevant results for portraits color component gives more accurate ones.
3.2.1
Case of textures:
For textures, we note that the variables α and β have an
average of 0.5 and 1.5 receptively. The comparison of the Kulback distance for different images provides values between 0 and 7.
We use the Vistex library to which we add some similar images resembling to the reference. The next example proved the efficiency of used method.
Figure 4: Base of images: Vistex
The images which are similar have a Kullback distance smallest than 1 and the further away the longer, the distance becomes bigger and the result diverges.
After applying our method, the result is really interesting. We take the image of the sky (22nd image starting from left to right and from top to bottom) as a reference.
Figure 5: Sorted Image
In this example, the Kullback distance, between the 6 first images and the reference which is the first image in the classification, is represented in the following table:
For the distances d of the other images, they belong to [1, 7]: d∈[1, 7].
By adding more images similar to the reference but having other colors, classification gives accurate results.
Referring to 200 images, the values of precision and recall found are as it is shown in the following table:
Table 2: Values of precision and recall for textured images
Precision
80%
Recall
100%
3.2.2
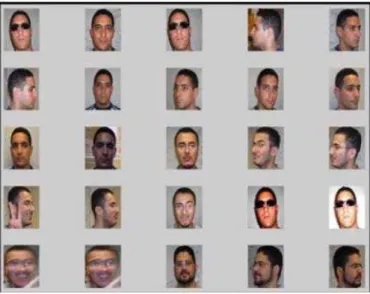
Case of portraits:
First of all, we test gray level images. Then we test color images which are decomposed into the Y, U and V component. These components are tested independently to sum the distances and to make comparison.
The used base of images is essentially based on this series of portraits.
(10)
Table 1: Kullback Lieber distance
Figure 6: Sorted portraits
We note that the variables: α and β have average values
respectively 10-2 and 0.5.
The value of the Kullback distance in the case of portraits is near to highly textured images.
As the case, we note that the adopted method gives interesting results. For example, if image 1 is our reference, the same person will be sorted in a growing order basing on similarity. For images where person wear glasses, we get an error but at a remote level in the classification.
We can notice that a little variation of the contrast or the luminance causes a little variation for the Kullback distance. Above a certain threshold, we remark a great jump. The little distance becomes enormously larger. This threshold is the saturation threshold (this threshold is reached for the images 19 and 20).
The recall and precision values for portraits in the gray level are quite small in comparison with the use of the components of color.
Table 3: The recall and precision values for portraits
Precision ng
40%
Precision cl
92%
Recall ng
60%
Recall cl
97%
Taking in account the colors has resulted in a stable result in the case of gray levels.
Indeed, the U and V component provide additional information.
4. Conclusion:
In this work, we tested a parametric method which enables us to make a comparison between an image of reference and other images of the base basing on the histograms of sub bands of the image of reference after the wavelet transform. As we obtained different results, we can conclude that: First, this method enables us to get interesting results of indexing in case of textures. The major difference between
textured images in the Vistex base allows us to sort them correctly visually and to have a satisfying result.
As getting satisfying results for textured images is really classical, we tend to improve our method in order to measure the similarity between the portraits.
Basing on this method, it is possible to distinguish faces effectively from textures in the Vistex base. In fact, the algorithm enables us to distinguish the forms of face, the presence of some details such as wearing glasses, the rear plan, the beard, etc.
It is also possible to distinguish the contrast. The luminance and color do not have a large variation in results. The method is invariant to both of them reaching a certain threshold and after it, it divergences.
When combining textured images and portraits, comparing to a reference, Kullback distances are really important when we moved from one type of images to another totally different. The translation of the original image does not affect the Kullback distance: by translating an image horizontally or vertically, we are able to identify our original image.
The rotation of the image implies automatically the variation of the portion taken into consideration. Thus, the Kullback distance diverges: the images which are taken from the profile are so different from the original images that are considered. In our work, we have used several types of wavelet: in the orthogonal, we used with the Haar wavelet, Daubechies, etc. We have also used the bi-orthogonal wavelets, 7 9 and whatever the type of wavelet, results are similar and independent of this type.
As our base of images does not contain enough varied portraits, we could not make general and accurate deductions basing on this method.
Using this indexing and multi-resolution approach enables us to gain time. Yet, it does not take in account the geometrical characteristics of the image.
REFERENCES
[1] Glenda Browne and Jonathan Jermey, Website indexing: enhancing access to information within websites, 2nd Edition [2] C. J. Van Rijsbergen, Information Retrieval, Butterworth-Heinemann, Newton, MA
[3] F.Tonin Thèse : ‘Description locale d’images fixes dans le
domaine,
TEXMEX-
TEMICS compressé’
.
[4] M.Antonini, M.Barlaud, P.Mathieu and I.Debauchies :
‘Image configusing wavelet transform’ IEEE transaction on
image processing, vol1, n°2 Avril 1992.
[5] Press, WH; Teukolsky, SA; Vetterling, WT; Flannery, BP (2007), "Section 13.10. Wavelet Transforms", Numerical Recipes: The Art of Scientific Computing (3rd ed.), New York: Cambridge University Press, ISBN 978-0-521-88068-8 [6]M.Do, M.Vitterli, ‘Wavelet based texture retrieval using
generalizedgaussain density and kullback leiber distance.’
IEEE transaction on image processiong, vol11, n°2, Fevrier. [7] M.K.Varansi et B. Aazhang, ‘Parametric generalized Gaussian density estimation’. J Acoust Soc.Amer 1982.
A generic and robust
-2009 -Ince, Kiranyaz, Gabbouj ]
[8
system for automated patient-specific classification of ECG signals