Oxygen Transport and Stem Cell Aggregation in
Stirred-Suspension Bioreactor Cultures
Jincheng Wu1, Mahboubeh Rahmati Rostami1, Diana P. Cadavid Olaya2, Emmanuel S. Tzanakakis1*
1Department of Chemical and Biological Engineering, Tufts University, Massachusetts, United States of America, 2Department of Chemical and
Abstract
Stirred-suspension bioreactors are a promising modality for large-scale culture of 3D aggregates of pluripotent stem cells and their progeny. Yet, cells within these clusters experience limitations in the transfer of factors and particularly O2which is characterized by low solubility in aqueous media. Cultured stem cells under different O2levels may exhibit significantly different proliferation, viability and differentiation potential. Here, a transient diffusion-reaction model was built encompassing the size distribution and ultrastructural characteristics of embryonic stem cell (ESC) aggregates. The model was coupled to experimental data from bioreactor and static cultures for extracting the effective diffusivity and kinetics of consumption of O2within mouse (mESC) and human ESC (hESC) clusters. Under agitation, mESC aggregates exhibited a higher maximum consumption rate than hESC aggregates. Moreover, the reaction-diffusion model was integrated with a population balance equation (PBE) for the temporal distribution of ESC clusters changing due to aggregation and cell proliferation. Hypoxia was found to be negligible for ESCs with a smaller radius than 100mm but became appreciable for
aggregates larger than 300mm. The integrated model not only captured the O2profile both in the bioreactor bulk and inside ESC aggregates but also led to the calculation of the duration that fractions of cells experience a certain range of O2 concentrations. The approach described in this study can be employed for gaining a deeper understanding of the effects of O2on the physiology of stem cells organized in 3D structures. Such frameworks can be extended to encompass the spatial and temporal availability of nutrients and differentiation factors and facilitate the design and control of relevant bioprocesses for the production of stem cell therapeutics.
Citation:Wu J, Rostami MR, Cadavid Olaya DP, Tzanakakis ES (2014) Oxygen Transport and Stem Cell Aggregation in Stirred-Suspension Bioreactor Cultures. PLoS ONE 9(7): e102486. doi:10.1371/journal.pone.0102486
Editor:Francesco Pappalardo, University of Catania, Italy
ReceivedFebruary 13, 2014;AcceptedJune 19, 2014;PublishedJuly 17, 2014
Copyright:ß2014 Wu et al. This is an open-access article distributed under the terms of the Creative Commons Attribution License, which permits unrestricted use, distribution, and reproduction in any medium, provided the original author and source are credited.
Funding:Funding support has been provided by the National Institutes of Health (NHLBI, R01HL103709) and the New York Stem Cell Science Trust (NYSTEM, contracts C024355 and C026714) to EST. JW is the recipient of a Mark Diamond Research Foundation award. The funders had no role in study design, data collection and analysis, decision to publish, or preparation of the manuscript.
Competing Interests:The authors have declared that no competing interests exist.
* Email: [email protected]
Introduction
Realization of the therapeutic potential of pluripotent stem cells (PSCs) including embryonic stem cells (ESCs) and induced pluripotent stem cells (iPSCs) hinges on the development of platforms for large-scale PSC expansion and directed differenti-ation. The culture of PSCs has been demonstrated in laboratory scale stirred-suspension bioreactors (SSBs) as cell aggregates [1] or on various scaffold types [2,3]. Compared to static culture, SSBs afford higher cell densities and tighter control of process variables leading to more efficient utilization of media and growth factors [1].
Despite the advantages of culturing PSCs as aggregates in stirred-suspension vessels, less attention has been devoted to limitations in the transfer of medium components to and within PSC clusters. Concentration gradients in the bioreactor environ-ment contribute to stem cell population heterogeneity leading to variable responses to self-renewal or differentiation stimuli. Such unevenness is more pronounced for oxygen characterized by low solubility in aqueous solutions and increased rate of consumption by metabolically active stem cells. Oxygen availability affects directly the viability, proliferation and differentiation propensity of stem cells in vivo and in vitro [4]. Cultivated human ESCs
(hESCs) are less prone to spontaneous differentiation and chromosomal aberrations at hypoxic (2–5%) than normoxic (21%) O2 level without significantly reduced proliferation [5,6].
Lower O2tension (pO2) in culture also predisposes stem cells to
commit along particular lineages including endothelial cells [7] and chondrocytes [8] similar to in vivo processes [4]. More details emerge about O2 modulation of the activity of stem cell-fate
controlling pathways such as the canonical Wnt/b-catenin [9] and Notch cascades [10]. These effects are largely mediated by transcriptional regulators such as the hypoxia-inducible factors (HIF) interacting with a wide gamut of genes including the pluripotency marker POU5F1 (Oct4) [11]. Hence, knowledge of O2profile among stem or progenitor cells is important for cell fate
prediction and control.
The distribution of O2was reported for single hESC aggregates
under static conditions [12,13]. The findings from these studies however may not apply directly to aggregate cultures of ESCs in SSBs where the transfer of O2 through multiple interfaces
complicates the analysis of the O2 tension (pO2) that each cell
experiences. In most small-scale setups, O2is transferred via the
gas/liquid interface (headspace aeration) to the culture medium under agitation. From the medium bulk O2 fluxes to cells via a
boundary layer surrounding each aggregate and a pore network
within each cluster. These ultrastructural characteristics of aggregates have also not been considered explicitly to date. And although a steady state assumption simplifies the mathematical framework for O2transfer in stem cell aggregate culture, it may
not proper in the case of SSB cultures. This is because the continuous cell proliferation and dynamics of agitation-induced aggregation result in the temporal modulation of O2 levels.
Furthermore, eliminating time as a variable in the analysis of mass transfer does not allow the calculation of the duration that a particular cell (or fraction) experiences a pO2 below a certain
threshold. Differences in the ‘‘residence time’’ at a certain O2
concentration among cells may be consequential for the differen-tiation and/or self-renewal of the stem cell population.
Here, the distribution of O2was calculated from experimental
data linked with a mathematical model for mouse ESC (mESC) and hESC aggregates cultivated in dishes and spinner flasks. Aggregates cultured in spinner flasks under different agitation rates were analyzed at different time points and ultrastructural attributes such as porosity and tortuosity were determined for the first time. The effective diffusivity of O2within the aggregates
and parameters associated with the specific rate of O2
consump-tion were also computed by coupling measurements with a transient diffusion-reaction model. This model was subsequently paired to a population balance equation (PBE) depicting the time evolution of aggregate size distribution of proliferating ESCs under agitation. The multiscale PBE/diffusion-reaction model facilitated the calculation of the O2profile in the medium bulk and inside the
aggregates in stirred suspension. Moreover, the fraction of cells experiencing hypoxia was predicted. The computational model described in this study can be utilized in the development of differentiation strategies and the design and control of relevant bioprocesses for the production of stem cell therapeutics.
Material and Methods
Experimental methods
Embryonic stem cell culture. Human ESCs (H9 cells, WiCell, Madison, WI; passages 30–60) were maintained on dishes coated with Matrigel (BD Biosciences, San Jose, CA) and grown in 5% CO2/95% air at 37uC with mTESR1 medium (Stem Cell
Technologies, Vancouver, BC) replaced daily. Four hours before harvesting, cells were treated with the Rho-associated kinase inhibitor (ROCKi) Y-27632 (10mM, EMD Chemicals,
Gibbs-town, NJ). Colonies were dissociated with Accutase (Innovative Cell Technologies, San Diego, CA) into single hESCs. For static aggregate culture, cells were transferred to poly HEMA-treated (Sigma-Aldrich, St. Louis, MO) Petri dishes with mTESR1. Dispersed hESCs (105/ml) were seeded in 125-ml ProCulture spinner flasks (Corning, Corning, NY) with mTESR1 medium and 10mM ROCKi. Agitation was kept constant during each
experiment and medium was replaced daily thereafter without the addition of ROCKi.
Mouse E14Tg2a ESCs (Mutant Mouse Regional Resource Centers (MMRRC), University of California-Davis, CA) were maintained in defined serum-free medium (DSFM) as described [14] (see Materials S1). For stirred-suspension culture [14], mESCs were transferred in DSFM to 125-ml ProCulture spinner flasks at 56104 cells/ml. The agitation was kept constant (60– 100 rpm) throughout each run.
Oxygen consumption. Cell aggregate samples of known volumes were transferred to 15 ml-centrifuge tubes and allowed to settle. Without removing aggregates, the medium was replaced by PBS (pH 7.4) containing 0.35 g/L HEPES, 0.5 g/L bovine serum albumin, and 300 mg/dL glucose (Sigma-Aldrich, St. Louis, MO)
with a Bunsen solubility coefficient of am= 1.2761029 mol/
(cm3mm Hg) at 37uC [15,16]. The cell suspension was transferred to a 30-ml cylindrical container (2.3 cm wide) with a magnetic cylindrical stirring bar (1.59 cm60.79 cm). The container was set on a submersible magnetic stirrer plate in a water bath at 37uC bath and agitation was set to 60 rpm. A dissolved O2 (DO)
polarographic probe (VWR, Bridgeport, NJ) was inserted in the container through the cap with a rubber seal ensuring airtight fitting. DO data (mg/l) were logged on a computer connected to the DO probe/meter. Then, aggregates were transferred to a 96-well plate and images were taken and processed (see below) to obtain the total number of aggregates and pertinent size distributions [17].
Stem cell aggregate micrograph acquisition and analysis. Samples of known volume from spinner flasks, dishes or the DO chamber were transferred to a 96-well plate and images from each well were acquired at 4x magnification with a camera (Moticam 2300, Motic, Richmond, BC) connected to the microscope. Raw images were imported into ImageJ (U.S. National Institutes of Health, Bethesda, Maryland, USA, http:// imagej.nih.gov/ij/) and for counting total numbers of aggregates. After background subtraction (rolling ball method), the diameter of each aggregate was calculated as the mean of two perpendicular diameters and size distributions were generated [17].
Porosity e and tortuosity t were determined in aggregates transferred to culture medium containing 10 mg/ml fluorescein isothiocyanate (FITC)-dextran (MW: 4.4 kDa, Sigma). The aggregate suspension was then transferred to a microscopy slide with a well, sealed with a coverslip and visualized by confocal laser scanning microscopy (CLSM) with a Zeiss LSM 510 Metal NLO system (Zeiss, Thornwood, NY). Aggregates were optically sectioned (10–12 sections per aggregate) at 5-mm steps and the micrographs were processed in MATLAB (Mathworks, Natick, MA) to obtain porosity and tortuosity values (Fig. 1A; see
Materials S1).
Statistical Analysis. Data were expressed as mean6st.dev. unless stated otherwise. ANOVA and thepost hocTukey test were performed using Minitab (Minitab Inc, State College, PA) with p,
0.05 considered as significant.
Modeling methods
Transient reaction-diffusion model. For the transient reaction-diffusion model employed in this study, the aggregates were assumed to be spherical and thus spherical coordinates were employed to describe the O2 concentration (C) profile in each
aggregate:
LC Lt~
Dt r2
L Lr r
2LC Lr
{VO2 ð1Þ
where r is the aggregate radius, t is the time andD
t is the effective
diffusion coefficient. Taking into account the porosity e and tortuosityt,D
t is calculated as
Dt~eDt
t ð2Þ
where Dtis the diffusion of O2in the tissue (aggregate).
The consumption of O2(VO2in mol/(cm3.s)) was described by
Michaelis-Menten (M-M)-type kinetics:
VO2~
VmaxC
KMzC
where Vmaxis the maximum O2consumption rate and KMis the
M-M constant. Because the system comprises aggregates of multiple sizes, cell clusters were classified into Lgroups or bins. Here, the utilization of 7 bins provided sufficient resolution of the aggregate size distribution. Equation 1 was solved for each group [18] (seeMaterials S1) subject to appropriate initial and boundary conditions.
C~C rð,0Þ ð4Þ
LC Lr
r~0
~0 symmetry about the aggregate centerð Þ ð5Þ
DtLC Lr
r~
Rl
~klðCM{C Rð Þl Þ ð6Þ
whereRlis the radius for the aggregates in thelthbin. Calculation of the value of the O2transfer coefficientklfrom the bulk liquid to the aggregates was based on the Fro¨ssling equation [19] relating the particle Sherwood (Sh) and Schmidt (Sc) numbers shown in theMaterials S1section.
The total rate of O2transfer from the bulk to all aggregates
(Lgroups) is:
{VM
dCMð Þt
dt ~
XL
l~1 flztotal
ð Rl
0
VmaxC rð Þ,t
KMzC rð Þ,t
4pr2dr
ð7Þ
where fl and ztotal are the fraction of aggregates with average
diameter 2Rl and the total number of aggregates, respectively.
Integrals were calculated via the trapezoidal rule using C values from solving Equation 1 and the Euler method was implemented yield estimates of the O2concentrationCMtz1Dcalc in the medium
bulk at the(tz1)-time step in Equation 7.
Values forDt,VmaxandKM were obtained by minimizing the
objective function [20] comparing the calculated valuesCtz1
M Dcalc
with the experimental onesCtz1
M Dexp at each time point:
DC~
Ctz1
M Dexp{C tz1
M Dcalc
Ctz1
M Dexp !2
ð8Þ
Development of PBE model for the bioreactor culture of ESC aggregates. A size-structured PBE model was employed to simulate the temporal evolution of size of ESC aggregates cultured in spinner flasks [1] considering the contributions of ESC proliferation and collisions between particles to aggregate size growth:
Ln xð ,tÞ
Lt z
L n xð ,tÞLx
Lt
Lx ~
1 2
ð
x
xo
n xð C,tÞn xð ’,tÞK xð CDx’Þdx’
{
ð
?
xo
n xð ,tÞn xð ’,tÞK xDxð ’Þdx’
ð9Þ
The density functionn xð ,tÞis defined such thatn xð ,tÞdxis the fraction of aggregates with sizes betweenxandxzdxat timetper unit volume of the culture. The sizexcorresponds either to the
Figure 1. Structural characteristics (tortuosity and porosity) of mESC and hESC aggregates under different conditions.(A) Optical sections were acquired for each aggregate via CLSM and processed to obtained tortuosity and porosity values. For each condition, at least 10 aggregates were imaged by CLSM (30 sections/aggregate) for data analysis. Tortuosity (lines) and porosity (bars) data are shown for (B) mESC aggregates at different time points at 100 rpm, (C) mESC aggregates at different agitation rates on day 3, and (D) hESC aggregates at different agitation rates on day 4. The values in (B–D) are shown as mean6st. dev.
doi:10.1371/journal.pone.0102486.g001
aggregate volume or mass since the buoyant density of cells does not vary significantly during the cell cycle [21,22]. The mass of individual cells was taken as xo and xC~x{x0. Aggregate
breakage was not observed particularly after the first day of culture and therefore was not considered.
The rate of aggregate size change,Lx
Lt, due to cell proliferation
was modeled after the Gompertz equation [23]:
Lx Lt~aGxln
M x
ð10Þ
where M is the aggregate mass reached as t?? and aG is a
constant characteristic of the cell proliferation. Both parameters were estimated from temporal data of aggregates in static cultures. Different aggregation kernels K x xð j 0Þ have been reported in various systems [24,25]. Given the non-rigid nature of cells/ aggregates, we applied here an aggregation kernel (Eq. 11) for liquid-liquid dispersions assuming dynamic deformation of the colliding bodies [26]. The coalescence efficiency (exponential term) decreases with increasing average size of the colliding aggregates. The parametersk,k1andaare obtained from ESC aggregate size distributions measured in spinner flask cultures.
K xDxð ’Þ~kexpð{k1xxaÞ
x13zx’13
73
k1,aw0
ð11Þ
The PBE was expressed with respect to the aggregate radius, which was measured experimentally, assuming spherical aggre-gates. However, the density function was transformed in terms of the logarithm of the aggregate radius normalized to that of a single cell (,7.5mm) to allow for an extended range of aggregate sizes to
be considered (see [17] andMaterials S1).
The integro-partial differential PBE was solved numerically by finite (backward) differences over equally spaced nodes in thelnr
domain. Kernel parameters for different agitation rates were obtained from aggregate size data. The total number of aggregates and biomass were calculated as the zeroth and first moments of the cell distribution.
Integration of PBE and reaction-diffusion models. The PBE and reaction-diffusion models were combined for predicting the O2 profile in stirred-suspension cultures of ESC aggregates
(Fig. 1). The total number of aggregatesztotal, size distribution of
aggregates fl, oxygen concentration in the medium bulk CM,
working volume of bioreactorVM (assumed equal to that of the
medium) and agitation rateNRPMwere used for initialization of the
integrated model (seeMaterials S1). Cell growth and aggregation were modeled (Eq. 10–11) and the consumption of O2by all the
aggregates in the bioreactor was determined (Eq. 7). This required knowledge of the O2concentration distribution within individual
aggregates (Eq. 1). Subsequently, the bulk O2levelCMwas updated
based on the net effect of O2consumption and supply:
VM
dCMð Þt
dt ~k
la:C
{C
Mð Þt
ð Þ
{X
L
l~1 flztotal
ð Rl
0
VmaxC rð Þ,t
KMzC rð Þ,t
4pr2drfl
ð12Þ
The rate of O2supply through headspace aeration was:
VM
dCMð Þt
dt ~k
la:ðC{CMð Þt Þ ð13Þ
whereCis the O2partial pressure in the gas phase (95% air/5%
CO2, 37uC, 760 mm Hg),CM is the oxygen partial pressure in
bulk medium,klais the mass transfer coefficient at the gas-liquid
interface. Values of kla were determined experimentally (see
Materials S1).
Results
Porosity and tortuosity of ESC aggregates
The transport of O2, nutrients and pluripotency-maintaining or
differentiation-inducing factors to and within stem cell aggregates is greatly influenced by the aggregate ultrastructure. Moreover, whether the intra-aggregate ultrastructure is strongly affected by culture conditions in SSBs -particularly agitation- remains unknown. Thus, before proceeding with the solution of the diffusion-reaction model for ESC aggregates, we used CLSM and image analysis to determine two ultrastructural descriptors – porosity (e) and tortuosity (t)– for mESC and hESC aggregates formed in dishes or spinner flasks at different stirring rates (Fig. 1A). The porosity of mESC aggregates in spinner flasks at 100 rpm was 0.22960.016 at 24 hours (Fig. 1B) and decreased slightly after 3 (0.21860.011) and 5 days (0.22060.011) of culture suggesting that aggregates were undergoing compaction. For 3-day cultures theevalues for 60 and 80 rpm were 0.21760.02 and 0.21060.025, respectively (Fig. 1C). When cultured in dishes, mESCs formed looser aggregates with e= 0.25960.041 (day 3). Yet, no statistically significant differences were noted in the porosity between aggregates cultured in dishes and spinner flasks at different agitation rates. Human ESCs in static culture formed aggregates with a porosity of 0.25460.017 (Fig. 1D) whereas hESC aggregates from spinner flasks at 45 and 60 rpm displayed porosities of 0.25860.011 and 0.27060.007, respectively.
The tortuosity of mESC aggregates at 100 rpm was 1.42760.083 at 24 hours and did not change significantly after 3 (1.50460.093) and 5 days (1.54760.181) of culture (Fig. 1B). Moreover, clusters formed at 60 rpm (1.46060.035), 80 rpm (1.53460.086) and in dishes (1.45760.422) exhibited similar tortuosity. Human ESC aggregates were characterized by slightly higher averaget values than mESC clusters (Fig. 1D). After 4 days in stirred suspension an averagetof 1.61260.135 (45 rpm) or 1.55160.086 (60 rpm) was determined whereas the tortuosity of dish aggregates was 1.63860.136.
Our findings provide a first account of porosity and tortuosity values determined directly for mESC and hESC aggregates formed in dish and stirred-suspension cultures at different times and under typical agitation rates. The data did not show strong dependence of the ultrastructural descriptors considered here on the cultivation mode, i.e. dish vs. stirred suspension nor on the stirring speeds tested.
Effective diffusion and consumption of O2
A transient reaction-diffusion model was employed to determine the values of the diffusion coefficient Dt and consumption
(Vmax,KM) of O2 in the ESC aggregates from experimentally
measured O2concentration values in the medium. First, the mean
(173.8623.9mm) and 80 rpm (169.01616.13mm). The mean diameter of hESC aggregates at 45 and 60 rpm at day 4 was 163.8 and 192.45mm, respectively and similar to those in static cultures (166.61612.4mm) (Fig. 2B). For each sample, the number fractionfldistribution was determined (Fig. 2C).
Cells within aggregates consumed O2 resulting in a gradual
decrease of the DO level in the medium (Fig. 2D). Typically, DO measurements were performed until the O2concentration in the
medium dropped below 10 mm Hg. Solution of the model coupled with experimental data on DO, yielded values for
D
t,Vmax and KM (Table 1). It should be noted that parameter
values were calculated for a minimum (critical) O2concentration
at the aggregate center of either (i) 0 mm Hg, or (ii) 8 mm Hg [27]. Irrespective of the minimum O2level considered, the values
ofDt(see Eq. 2) were lower than that of the diffusion coefficient
DO2 of O2 in pure water at 37uC (2.786102 5
cm2/s). As a measure of maximum O2consumption rate, Vmaxwas higher for
mESCs in suspension culture at 60 rpm than for hESCs (p,0.05). Mouse ESCs also displayed greater Vmax at 100 vs. 60 rpm
suggesting an effect of the agitation on O2metabolism (p,0.05).
The mean Vmax for hESCs at 45 and 60 rpm did not differ
significantly.
Oxygen profile within ESC aggregates in static and stirred-suspension cultures
Once the values of D
t,Vmax and KM were determined, the
reaction-diffusion model was implemented to calculate the O2
profile for ESC aggregates of different size. The diffusion of O2
becomes limited as the aggregate radius increases leading to reduced O2 levels for cells residing closer to the core. To better
illustrate this, the O2 distribution was calculated in hESC
aggregates sampled from spinner flask cultures assuming a constant O2concentration in the bulk of 148 mm Hg (saturation)
(Fig. 3A). Because hypoxia studies typically employ pO2 of
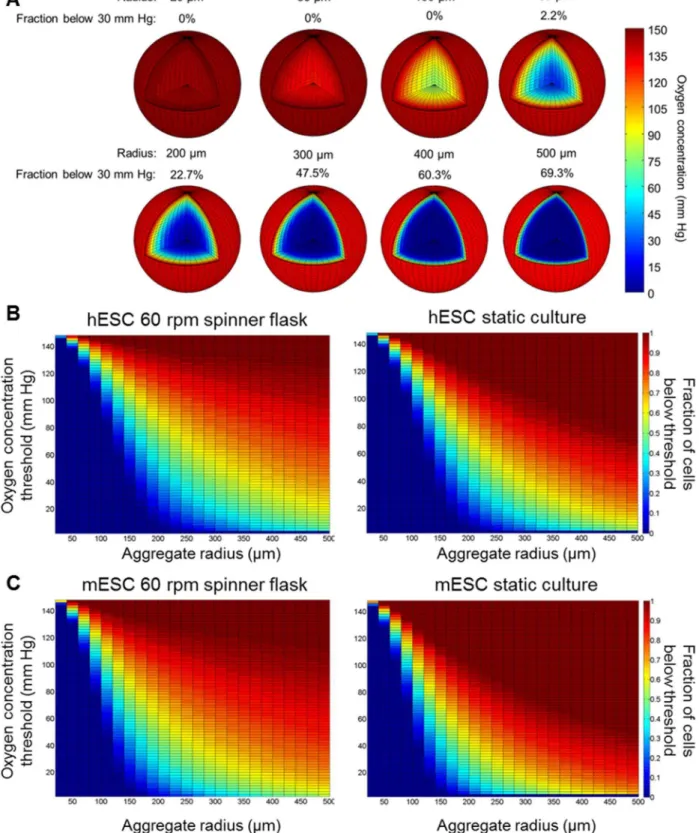
,30 mm Hg (4–5% O2) [5], we calculated the fractions of ESCs
exposed to O2 below this level for different aggregate sizes.
Human ESC aggregates smaller than 200mm were normoxic
throughout their volume. In contrast, almost 23% of the hESCs in aggregates larger than 400mm were under hypoxia. This fraction
increased to 70% for aggregates with 1,000mm diameter (Fig. 3A).
The O2profiles in hESC aggregates of various sizes maintained in
suspension (60 rpm) or static culture are shown in Fig. 3B. Similarly, the O2distributions within mESC aggregates cultured at
60 rpm or statically are also shown (Fig. 3C). It should be noted that the results shown inFigs. 3B–Cwere obtained assuming that
Figure 2. Experimental measurement of ESC aggregate size and O2consumption profiles for static and spinner flask cultures.Mean aggregate diameter data are shown for dish and bioreactor cultures at different agitation rates for (A) mESCs (*p,0.05 vs. 60 and 80 rpm) and (B) hESCs. (C) A representative ESC aggregate size distribution is shown (mESC culture at 100 rpm). (D) Experimental (solid line) and simulation (dotted line) results for the consumption of O2over time. Parameter (Vmax,D, and KM) values were acquired by fitting the transient reaction-diffusion model to the experimental data for different agitation rates (Table 1).
doi:10.1371/journal.pone.0102486.g002
all aggregates in culture are the same size. Simulation results for additional agitation rates are shown inFigure S1.
In general, the fractions of cells experiencing an O2
concentra-tion below a particular threshold were lower in stirred suspension compared to dish cultures for given size clusters. For instance, the hypoxic cell fractions are larger in the plots from dishes compared to spinner flask cultures for the same size aggregates (Figs. 3B–C). This is most likely due to the faster transfer (kl) of O2 from the
medium bulk to each aggregate in agitated vessels compared to static cultures (Eq. S2). Practically however, we rarely observed aggregates with a radius over 300mm and only in static cultures.
The higher hindrance for O2 (and nutrient) transport to large
clusters possibly impacts ESC viability and reduces proliferation by stimulating differentiation. This and the agitation-induced shear in spinner flask cultures may limit further growth of bigger aggregates.
Aggregates from stirred-suspension cultures showed similar O2
profiles across all the agitation rates we tested (Fig. S1). As the aggregate size increased, cells positioned over 100mm from the
aggregate surface experienced less than 10 mm Hg of O2.
Compared to hESCs, the fractions of mESCs under the same O2concentration threshold were greater for equal size aggregates
owing most likely to the higher Vmaxof the latter. The difference
was most significant for aggregates with a radius between 100– 250mm.
Nevertheless, the expansion of mESCs and hESCs in spinner flasks gave rise to aggregate diameters mostly below 200–300mm
(Fig. 2). Thus, if a normoxic concentration of O2 can be
maintained in the bulk only 2.2% of the cells (located in the aggregate center) experience O2 tension below 30 mm Hg
(Fig. 3A). In fact, when we analyzed cells by qPCR for HIF1a
expression (Fig. S2) there was no notable differences between static and stirred-suspension cultures. Also, compared to mono-layer cultures at normoxia, HIF1a expression increased only slightly for mESCs (,2.0-fold) and hESCs (,1.5-fold) within aggregates.
PBE model for ESC aggregation in stirred-suspension culture
For the O2 profiles presented above, the O2concentration in
the medium was assumed to be fixed at saturation (,148 mm Hg). This assumption is valid if O2 can be supplied efficiently and
continuously to the cultivation system or the culture is sparse so that O2 consumption is trivial. However, stirred-suspension
cultures accommodate high cell densities resulting in fluctuating O2levels in the bioreactor. Agitation and proliferation also drive
the formation and growth of aggregates over time with concom-itant changes in the intra- and inter-aggregate concentrations of O2. Given the multitude of effects of O2on stem cell physiology,
predicting the time-variant distribution of O2 in scalable ESC
aggregate cultures is highly desirable.
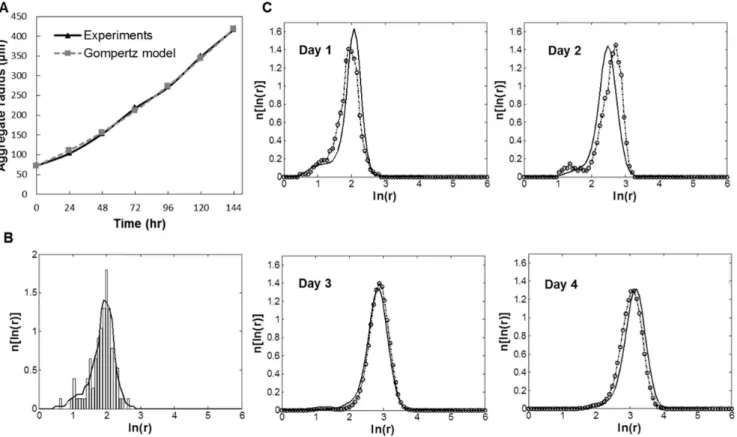
To that end, a PBE model was developed for the temporal evolution of the ESC cluster size distribution in an SSB. The growth rate of ESC aggregates due to cell proliferation was described by the Gompertz equation. For this purpose, the growth of sparsely cultured mESC aggregates in dishes was monitored and the Gompertz parameters were evaluated (M = 9.716106, aG= 5.7261023hr21) based on the recorded size changes
(Fig. 4A). The Gompertz model accurately described the growth of mESC aggregates (R2= 0.99, n = 20). The maximum attainable
size for mESC aggregates was calculated at 1600mm (lnrmax~5:4).
Parameters for the aggregation kernel were determined from size data of mESC aggregates cultured in spinner flasks (Fig. 4B). It should be noted that the kernel parameters were calculated from data of cell cultures at 0–72 hours (Table 2). At longer times, aggregation was negligible and cell proliferation drove the increase in cluster size. With increasing agitation rate, the parameter value trends are such that the coalescence frequencies (i.e. collisions leading to aggregate formation) become lower. At 60 rpm, the mean aggregate radius increased to,105mm on day 2 (mainly
due to collision-driven aggregation) in line with the model predictions (Fig. 4C). Subsequent increase in aggregate size was less pronounced as the mean radius was approximately 150mm
(day 4). The corresponding average size at higher agitation rates was lower (e.g. ,90mm at 100 rpm, Fig. S3). The simulation
results were corroborated by observations that a lower agitation rate generally promotes formation of larger aggregates. It should also be noted that the cell viability was not affected significantly by agitation (.90%).
Taken together, the PBE model developed here allowed the prediction of the temporal evolution of the ESC aggregate size distribution (and the total aggregate number and biomass; see below). Simulation results were in good agreement with the
Table 1.Parameter values with a critical concentration of 8 mm Hg.
Culture condition Dt(6105cm2/s) Vmax(6108mol/cm3.s) KM(6108mol/cm3)
mESCs
Static culture (aggregates) 1.63160.19 [0.24260.024] 2.61560.997 [4.73260.318] 2.8161.904 [0.51860.165]
60 rpm 1.71660.223 [0.36460.02] 2.66760.378*,#
[5.05560.163] 2.72160.385 [0.78260.329]
80 rpm 1.28360.864 [0.41860.05] 3.10361.03 [3.60261.06] 4.57561.915 [0.39260.233]
100 rpm 2.37560.199 [0.38660.114] 4.83160.593 [7.32260.83] 4.06360.693 [0.56360.06]
hESCs
Static culture (aggregates) 1.2060.170 [0.21760.022] 0.99560.464 [2.02960.478] 3.47360.232 [0.06260.033]
45 rpm 1.53660.322 [0.54760.093] 1.1660.355 [1.59160.963] 3.2360.257 [1.56460.155]
60 rpm 1.16360.454 [0.6960.223] 1.3660.427 [1.26660.542] 4.12661.138 [0.87660.443]
Values in brackets are calculated with a 0 mm Hg critical concentration. *p = 0.005 [0.019] for Vmaxat 60 vs. 100 rpm,
#
p = 0.032 [0.001] for Vmaxfor mESCs vs. hESCs at 60 rpm.
Figure 3. Steady-state O2profile within ESC aggregates of varying sizes.(A) Three-dimensional distribution of O2and hypoxic cell fraction of hESC aggregates with radius ranging from 20mm to 500mm. The bulk oxygen level was taken as 148 mm Hg. Fractions of ESCs exposed to O2 below a particular threshold (y-axis) for different size aggregates cultured at 60 rpm or in dishes (static) shown for (B) hESCs and (C) mESCs. Results were obtained assuming that all cultured aggregates were the same size. The minimum intra-aggregate O2level was fixed at 8 mm Hg (critical concentration).
doi:10.1371/journal.pone.0102486.g003
experimental observations from stirred-suspension ESC culture at different agitation rates.
Prediction of O2profile and hypoxia fraction in ESC
aggregate stirred-suspension culture
With the PBE model of ESC aggregation in the SSB in place, the O2distribution in the medium and within ESC aggregates was
computed by coupling the diffusion reaction and PBE models. For this purpose, the coefficientklwas measured for the O2transfer
via headspace aeration to the bulk medium (air-liquid interface, Fig. S4). The slope (kl:a=VM) was 4.8760.13 hr21yielding akl
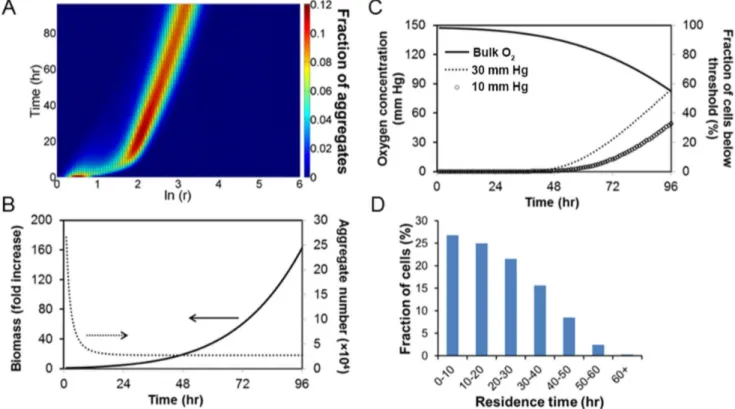
of 16.5760.43 cm/hr for our cultivation system. Simulations were run for spinner flask cultures of mESCs at 60 rpm and a seeding density of 56104cells/ml. The temporal size distribution of mESC aggregates is shown inFig. 5A. During the first day, there was a
significant increase in mean cluster size mainly due to aggregation. By day 3, mESC aggregates had a mean diameter of around 200mm in agreement with our cell culture data. The total number
of aggregates dropped substantially during the first day due to aggregation but remained relatively steady afterwards (Fig. 5B). At day 4, the calculated total number of aggregates was around 2.76104/50 ml of culture similar to our experiments and the corresponding biomass had increased 160-fold.
The fractions of cells exposed to various levels of O2in spinner
flask cultures were also predicted. Here, the fractions were computed of cells experiencing O2 tension below 30 mm Hg,
which may be favorable for maintenance of ESC pluripotency (Fig. 5C). We also calculated the fractions for extremely low pO2
(,10 mm Hg), which hampers ESC self-renewal and induces death [5]. The pO2in the medium decreased to 82 mm Hg after 4 Figure 4. PBE model for the ESC aggregate culture in spinner flasks.(A) Mouse ESC aggregates in dishes were monitored and their size was measured over several days. The experimental data for aggregate growth due to mESC proliferation were compared with the Gompertz model. Relevant parameters were determined: M = 9.716106,a
G= 5.7261023hr21. (B) Representative data of size (radius) distribution for mESC aggregates cultured at 60 rpm (day 1). Histogram and a continuous distribution curve are shown. (C) Model size distributions (lines) shown for a 96-hour culture at 60 rpm. The original distributions (dash-circle lines) for each time point are shown for comparison.
doi:10.1371/journal.pone.0102486.g004
Table 2.Kernel parameter values at different agitation rates.
Agitation rate (rpm) k(hr21
mm27/3) k1(mm23a) a(unitless)
60 1.2660.7761023* 1.94
61.1261024 8.06
60.7961021*
80 6.3664.4761026 4.62
63.2561024 5.96
60.08561021*
100 6.5366.2361026 4.11
60.6361025 9.91
60.6561021*
The parameter values were shown as mean6st.dev. calculated by model simulation to experimental data from mESC cultures (at least 3 independent runs per agitation rate).
days with 58% of cells experiencing O2less than 30 mm Hg. The
corresponding fraction of ESCs at 10 mm Hg or less was 32%. If the O2concentration in the culture bulk was fixed at 148 mm Hg
throughout the cultivation period, only 33% of cells would be at pO2,30 mm Hg by day 4 (data not shown).
In addition, the residence time distribution (Fig. 5D) shows that mESCs entered low O2 level (,30 mm Hg) at different time
points. This variation is attributed to the distributed size of cell clusters and random aggregation under stirring. The data clearly illustrate that although a group of cells is exposed to a particular O2 range (e.g. below 30 mm Hg), not all cells within the group
experience the O2level for the same amount of time. Therefore,
information about the fraction of cells at different pO2 levels
should be coupled to residence times provided by the model presented here. Our findings show that stem cell aggregate size heterogeneity is linked to population heterogeneity with respect to the duration of exposure at different levels of O2 concentration
despite the fairly homogeneous environment induced by mixing in SSBs.
Discussion
The transport of factors among cells within 3D structures such as aggregates is an important aspect of the performance of cultivation systems. The importance becomes even more pro-nounced for stem cell culture modalities given the central role of O2 in pluripotency and lineage specification. We employed a
transient reaction-diffusion model to predict the O2profile inside
ESC aggregates of varying sizes. The effective diffusivity and consumption rate parameters of O2 in hESC and mESC
aggregates were determined for the first time based on experi-ments without a steady state constraint. A PBE model was further developed for the SSB culture of ESC aggregates. The combined diffusion-reaction/PBE framework was utilized to predict the aggregation outcome and the O2profile inside ESC clusters and
the medium bulk in stirred-suspension over time. As a result, the fractions of cells exposed to particular levels of O2and pertinent
residence times were determined allowing to draw conclusions about the ensuing population heterogeneity and state of the cells (e.g. viability, differentiation potential).
The oxygen level to which ESCs are exposed to significantly affects cell fate decisions. Hypoxia (,30 mm Hg) does not modulate adversely the proliferation rate of hESCs, which exhibit reduced spontaneous differentiation and chromosomal abnormal-ities [5,6,28]. Human ESCs and iPSCs exhibit differentiation efficiencies along particular lineages dependent on O2availability.
For instance, low pO2 enhances hESC differentiation to
chon-drogenic, endothelial and cardiac cells [7,8,29]. Mouse ESC EBs generate significantly more myeloid and erythroid progenitors when cultured at 3% O2 instead of 21% O2 [30]. However,
extremely low pO2can be detrimental for cells. Thus, delicate pO2
control is essential in culture systems to avoid hampering stem cell growth, viability and self-renewal or commitment. This is particularly relevant in scaling up stem cell cultivation where local concentration gradients and transfer of factors are more pronounced. The model presented in this study permits the prediction of the actual O2 level facilitating informed decisions
about dynamic pO2control and optimal aggregate size in systems
for stem cell expansion.
Figure 5. Model prediction of cluster size and O2concentration distribution in a stirred suspension bioreactor of cultured mESC
aggregates. (A) Density plot of mESC aggregate size distribution during a 4-day culture. (B) Total aggregate number and biomass of mESC aggregates over 4 days of culture. (C) Oxygen concentration in the medium bulk and fraction of ESCs experiencing pO2below 30 mm Hg. The model was run for a 50-ml working volume and 60 rpm with mESCs seeded at 56104cells/ml. Specific model parameters are from Tables 1–2. (D)
Distribution of residence time of ESCs exposed to#30 mm Hg pO2during a 4-day culture. doi:10.1371/journal.pone.0102486.g005
For the results reported here, an implicit assumption was made that the O2consumption rate (i.e. KMand Vmax) does not vary
with time or the location of cells within each cluster. Although this is a premise that is common with previous reports, we cannot exclude the possibility of ESC metabolism adaptation to available O2 levels. For example, Vmax was estimated to vary with pO2
albeit within the same order of magnitude [31]. Human ESCs reportedly lower their O2 uptake rate when the dissolved O2
decreases from 21% to at 5% and 1% O2[32]. Such adjustment
may aid the cells to maintain the concentration of available O2
above zero at the core of aggregates with a diameter .200mm
thereby reducing the likelihood for necrosis (Fig. S1 in the absence of the constraint of 8 mm Hg critical pO2). However,
further studies are warranted on the adaptation of O2
consump-tion by pluripotent stem cells in response to microenvironment O2
levels. With more information becoming available, our model can accommodate spatially (e.g. radial distance from the aggregate surface) and temporally changing O2consumption rates.
Our study also raises the issue of ‘residence time’ (duration of exposure) of cells especially to low O2levels. To our knowledge,
this has not been investigated previously and even in reports of stem cell aggregate cultivation in stirred-suspension vessels, emphasis is placed on the actual pO2 the cells experience. It is
important to note that even after the first 5 minutes of mESC culture in 2.2% O2, increases are observed in HIF-1aexpression
and reactive O2species [33]. At 12–24 hours of hypoxia, cell-cycle
regulatory proteins such as cyclins D1 and E, CDK2 and CDK4 along with retinoblastoma phosphorylation increase yielding a larger fraction of mESCs in the S phase and higher overall cell numbers. Accelerated cell proliferation in aggregate regions of hypoxia will lead to increased O2consumption further depressing
pO2levels. As our model indicates, an increasing fraction of cells
will reside in the hypoxic region of the aggregates which grow continuously. The ‘cut-off’ time of cell exposure to low pO2before
hypoxia-induced changes (e.g. cell differentiation, apoptosis etc.) become irreversible is unknown. Such information will be essential in formulating strategies (e.g. by modulating agitation (Table 2)) to achieve ESC aggregate sizes so that a high cell fraction remains pluripotent for downstream differentiation to a desired phenotype. The effects of O2on gene expression are mediated largely by
HIF transcription factors and as noted, mESCs upregulate HIF-1a
within 5 minutes of exposure to 2.2% O2. Cells in our cultures did
not exhibit significant differences in HIF-1a expression under different agitation rates (Fig. S2). This may be attributed to the average cluster diameter, which generally ranged between 200– 300mm (Fig. 3), leading to rather limited fractions of cells exposed
to 2.2% O2or less. Yet, we acknowledge that HIF-1atranscripts
(probed by qPCR) may not be representative of the corresponding protein amount and activity levels. Moreover, the qPCR results are population ‘averages’ and HIF expression variation at locales with different pO2 cannot be discerned. Lastly, changes due to
fluctuating O2 can be brought about by HIF-independent
mechanisms such as the environmental sensing mammalian target of rapamycin (mTOR) [34].
Although this study focused on the transport of O2 in ESC
aggregates in dish and stirred-suspension cultures, the concurrent availability and consumption of other components such as nutrients and factors for self-renewal or differentiation should be considered. A steady state analysis of the diffusion of glucose and (generic) cytokines (in addition to O2) in human EBs was recently
presented [12]. The diffusivities of glucose and cytokine were lower than that of O2suggesting that their transport places further
limits on ESC aggregates to avoid cell starvation and death. Such limitations on transport may actually hinder the growth of
aggregates and cause their size to stabilize. Interestingly enough, Cameron et al. [35] reported that over 21 days hESC aggregates displayed a maximum size at day 10 ranging between 400 and 500mm without further increase. These observations support the
choice of the Gompertz equation for modeling aggregate growth due to cell proliferation. The Gompertz equation in our study suggested a maximum radius larger than our experimental observations. This discrepancy may be explained by the fact that experimental data were obtained from static cultures with relatively constant bulk concentration of substrates (oxygen, glucose, etc.) due to daily medium changes whereas realistically these concentrations should decrease markedly over time. The maximum radius attained by ESC aggregates may be lower if substrate-dependent growth kinetics are considered. Additional mass balance equations for nutrients and growth factors can be incorporated in the model presented here to provide a more accurate representation of the bioreactor stem cell culture.
The diffusion and consumption of O2 in mESC and hESC
cultures has been investigated in various studies [12,13,31,36,37] although only in a subset of these reports parameters were determined from experiments. The values reported for Vmaxand
KM are the same order of magnitude (1028 mol.cm23.s21 and
1028 mol.cm23, respectively) as those presented here. The O2
consumption rate for mESCs was previously [38] measured at 4610217
(mol/cell.s), i.e. close to our observed rate assuming cells are spherical with a 15mm diameter. Values for the diffusion
coefficient based on experimentally determined ultrastructural ESC characteristics of aggregates such as porosity and tortuosity were not available to date in the literature for comparison. In fact, the e and t values did not vary significantly with the culture modality, i.e. dish or stirred suspension and the agitation speeds tested. This could suggest that cells adopt particular arrangements in the aggregate interior without significant influence from external mechanotransduction but this warrants further investiga-tion. Such organizations may be mediated by cytoskeletal actions, which are central to the assembly of other cell types into aggregates [39].
It should be noted that no overt changes were observed in the values of Vmax, KMor Dtat different agitation rates. In part this
More importantly, the coalescence efficiency (collisions leading to new aggregate formation) decreases with increasing aggregate size in line with our experiments. Because of these attributes, the kernel is deemed suitable for describing the aggregation of stem cells in stirred-suspension vessels despite its original derivation for droplet coalescence in liquid-liquid dispersions. Explicit functions of the kernel parameters dependent on agitation rates can be estimated from the data (Table 2), and additional operating variables may be included (e.g. cell seeding density which was kept constant for all experiments here). Since transient size distributions of ESC aggregates cultivated in spinner flasks are available, a proper approach to determining the kernel for the PBE model is to solve the inverse problem [43]. Work is underway for deriving kernel functions via solving the inverse problem and comparing the solution to the functional utilized in this study.
The approach described here is certainly not without limitations but amenable to improvements. As already mentioned, the transport and consumption or secretion of factors other than O2
were not considered. Fluctuations in the consumption of nutrients and/or accumulation of waste will almost certainly affect the microenvironment within aggregates. These can be considered by expanding the model, for instance, to include reaction-diffusion equations (see Equation 1) for additional species. Moreover, O2
consumption was assumed invariant with the position of each cell within aggregates. Pertinent variations can be introduced by considering different expressions for Vmax and KM based on
spatial criteria or other conditions (e.g. concentration of particular nutrients). In the context of envisioned stem cell process designs, the model in its current or expanded form can be used in conjunction with investigating relevant bounds in culture vari-ables.
Nonetheless, the framework presented here can be applied widely to address both basic questions of stem cell physiology and issues surrounding relevant bioprocesses utilizing SSBs. The model can be employed to generate maps of concentrations of O2(and
other factors) expediting research on the role of hypoxia on stem cell self-renewal or commitment along particular lineages. Gaining a better understanding of the effects of O2 on fate selection is
critical in developing optimal strategies for stem cell differentia-tion. The design and control of stem cell bioprocesses will also benefit from quantitative multiscale approaches such as the one described here, thereby bringing us closer to the realization of the potential of stem cell therapeutics.
Supporting Information
Figure S1 Steady-state O2profile for ESC aggregates of different sizes cultured under different conditions.
Oxygen concentration profile for (A) hESC aggregates cultured in static or stirred suspension (45 rpm and 60 rpm) culture, and (B) mESC aggregates cultured in static or stirred suspension (60 rpm, 80 rpm and 100 rpm) culture. The distance in the horizontal axis is measured from the aggregate center. The O2level in the medium
bulk was kept fixed at 148 mm Hg for all conditions. The aggregate radius ranged from 30mm to 500mm. Values for Vmax,
KMandDt were taken from Table 1.
(TIF)
Figure S2 HIF1agene expression in (A) mESCs and (B)
hESCs cultured as aggregates in dishes and spinner flasks.
(TIF)
Figure S3 Comparison of experimental data (dash-circle lines) and model (solid lines) results for different agitation rates at day 4 of culture: (A) 60 rpm, (B) 80 rpm, (C) 100 rpm.
(TIF)
Figure S4 Measurement of O2transfer to the medium through headspace aeration in spinner flasks.(A) Oxygen concentration during the experiment. The dissolved O2 in the
medium bulk was first depleted by gassing with nitrogen. After the depletion phase, air was allowed to fill the space above the medium and the O2level was measured. (B) Linear regression of
the recovery phase for O2marked in (A). The standard deviation
was calculated from at least three independent experiments. The O2transfer coefficient was determined from the slope of the curve.
(TIF)
Materials S1 Supplemental information on cell culture, image analysis, modeling methods and measurements of bioreactor O2 transfer coefficient and HIF1a gene expression levels.
(DOCX)
Acknowledgments
We are thankful to Prof. Johannes Nitsche for critical discussions during the preparation of the manuscript. This work was performed in part at the University at Buffalo’s Center for Computational Research.
Author Contributions
Conceived and designed the experiments: JW MRR EST. Performed the experiments: JW MRR DCO. Analyzed the data: JW EST. Contributed reagents/materials/analysis tools: JW MRR EST DCO. Wrote the paper: JW EST.
References
1. Kehoe DE, Jing D, Lock LT, Tzanakakis EM (2010) Scalable Stirred-suspension Bioreactor Culture of Human Pluripotent Stem Cells. Tissue Eng Part A 16: 405–421.
2. Jing D, Parikh A, Tzanakakis ES (2010) Cardiac cell generation from encapsulated embryonic stem cells in static and scalable culture systems. Cell Transplant 19: 1397–1412.
3. Lock LT, Tzanakakis ES (2009) Expansion and differentiation of human embryonic stem cells to endoderm progeny in a microcarrier stirred-suspension culture. Tissue Eng Part A 15: 2051–2063.
4. Simon MC, Keith B (2008) The role of oxygen availability in embryonic development and stem cell function. Nat Rev Mol Cell Biol 9: 285–296. 5. Ezashi T, Das P, Roberts RM (2005) Low O2 tensions and the prevention of
differentiation of hES cells. Proc Natl Acad Sci U S A 102: 4783–4788. 6. Forsyth NR, Musio A, Vezzoni P, Simpson AH, Noble BS, et al. (2006)
Physiologic oxygen enhances human embryonic stem cell clonal recovery and reduces chromosomal abnormalities. Cloning Stem Cells 8: 16–23.
7. Prado-Lopez S, Conesa A, Arminan A, Martinez-Losa M, Escobedo-Lucea C, et al. (2010) Hypoxia promotes efficient differentiation of human embryonic stem cells to functional endothelium. Stem Cells 28: 407–418.
8. Koay EJ, Athanasiou KA (2008) Hypoxic chondrogenic differentiation of human embryonic stem cells enhances cartilage protein synthesis and biomechanical functionality. Osteoarthritis Cartilage 16: 1450–1456.
9. Mazumdar J, O’Brien WT, Johnson RS, LaManna JC, Chavez JC, et al. (2010) O2 regulates stem cells through Wnt/beta-catenin signalling. Nat Cell Biol 12: 1007–1013.
10. Gustafsson MV, Zheng X, Pereira T, Gradin K, Jin S, et al. (2005) Hypoxia requires notch signaling to maintain the undifferentiated cell state. Dev Cell 9: 617–628.
11. Covello KL, Kehler J, Yu H, Gordan JD, Arsham AM, et al. (2006) HIF-2alpha regulates Oct-4: effects of hypoxia on stem cell function, embryonic development, and tumor growth. Genes Dev 20: 557–570.
12. Van Winkle AP, Gates ID, Kallos MS (2012) Mass transfer limitations in embryoid bodies during human embryonic stem cell differentiation. Cells Tissues Organs 196: 34–47.
13. Khoury M, Bransky A, Korin N, Konak LC, Enikolopov G, et al. (2010) A microfluidic traps system supporting prolonged culture of human embryonic stem cells aggregates. Biomed Microdevices 12: 1001–1008.
14. Kehoe DE, Lock LT, Parikh A, Tzanakakis ES (2008) Propagation of Embryonic Stem Cells in Stirred Suspension without Serum. Biotechnol Prog 24: 1342–1352.
15. Panten U, Klein H (1982) O2 consumption by isolated pancreatic islets, as measured in a microincubation system with a Clark-type electrode. Endocri-nology 111: 1595–1600.
16. Groebe K, Thews G (1989) Effects of red cell spacing and red cell movement upon oxygen release under conditions of maximally working skeletal muscle. Adv Exp Med Biol 248: 175–185.
17. Cadavid Olaya DP (2012) Bioreactor culture of embryonic stem cell aggregates: Oxygen transfer dynamics and population balance modeling of aggregation [M.S.]. Ann Arbor: State University of New York at Buffalo. 88 p. 18. Tosaka N, Miyake S (1982) Analysis of a nonlinear diffusion problem with
Michaelis-Menten kinetics by an integral equation method. Bulletin of mathematical biology 44: 841–849.
19. Fro¨ssling N (1938) Uber die Verdunstung fallender Tropfen. Gerlands Gerlands Beitrage zur Geophysik 52: 170–175.
20. Nelder JA, Mead R (1965) A Simplex-Method for Function Minimization. Computer Journal 7: 308–313.
21. Anderson EC, Petersen DF, Tobey RA (1970) Density invariance of cultured Chinese hamster cells with stage of the mitotic cycle. Biophys J 10: 630–645. 22. Loken MR, Kubitschek HE (1984) Constancy of cell buoyant density for
cultured murine cells. Journal of Cellular Physiology 118: 22–26.
23. Brunton GF, Wheldon TE (1980) The Gompertz equation and the construction of tumour growth curves. Cell Tissue Kinet 13: 455–460.
24. Aldous DJ (1999) Deterministic and stochastic models for coalescence (aggregation and coagulation): a review of the mean-field theory for probabilists. Bernoulli 5: 3–48.
25. Smit DJ, Hounslow MJ, Paterson WR (1994) Aggregation and gelation- I. Analytical solutions for CST and batch operation. Chemical Engineering Science 49: 1025–1035.
26. Tobin T, Muralidhar R, Wright H, Ramkrishna D (1990) Determination of coalescence frequencies in liquid-liquid dispersions - Effect of drop size dependence. Chemical Engineering Science 45: 3491–3504.
27. Wartenberg M, Donmez F, Ling FC, Acker H, Hescheler J, et al. (2001) Tumor-induced angiogenesis studied in confrontation cultures of multicellular tumor spheroids and embryoid bodies grown from pluripotent embryonic stem cells. FASEB J 15: 995–1005.
28. Ludwig TE, Levenstein ME, Jones JM, Berggren WT, Mitchen ER, et al. (2006) Derivation of human embryonic stem cells in defined conditions. Nat Biotechnol 24: 185–187.
29. Burridge PW, Thompson S, Millrod MA, Weinberg S, Yuan X, et al. (2011) A universal system for highly efficient cardiac differentiation of human induced pluripotent stem cells that eliminates interline variability. PLoS One 6: e18293. 30. Adelman DM, Maltepe E, Simon MC (1999) Multilineage embryonic
hematopoiesis requires hypoxic ARNT activity. Genes Dev 13: 2478–2483. 31. Powers DE, Millman JR, Huang RB, Colton CK (2008) Effects of oxygen on
mouse embryonic stem cell growth, phenotype retention, and cellular energetics. Biotechnol Bioeng 101: 241–254.
32. Abaci HE, Truitt R, Luong E, Drazer G, Gerecht S (2010) Adaptation to oxygen deprivation in cultures of human pluripotent stem cells, endothelial progenitor cells, and umbilical vein endothelial cells. Am J Physiol Cell Physiol 298: C1527– 1537.
33. Lee SH, Lee MY, Han HJ (2008) Short-period hypoxia increases mouse embryonic stem cell proliferation through cooperation of arachidonic acid and PI3K/Akt signalling pathways. Cell Prolif 41: 230–247.
34. Arsham AM, Howell JJ, Simon MC (2003) A novel hypoxia-inducible factor-independent hypoxic response regulating mammalian target of rapamycin and its targets. J Biol Chem 278: 29655–29660.
35. Cameron CM, Hu WS, Kaufman DS (2006) Improved development of human embryonic stem cell-derived embryoid bodies by stirred vessel cultivation. Biotechnol Bioeng 94: 938–948.
36. Gassmann M, Fandrey J, Bichet S, Wartenberg M, Marti HH, et al. (1996) Oxygen supply and oxygen-dependent gene expression in differentiating embryonic stem cells. Proc Natl Acad Sci U S A 93: 2867–2872.
37. Cochran DM, Fukumura D, Ancukiewicz M, Carmeliet P, Jain RK (2006) Evolution of oxygen and glucose concentration profiles in a tissue-mimetic culture system of embryonic stem cells. Ann Biomed Eng 34: 1247–1258. 38. Zur Nieden NI, Cormier JT, Rancourt DE, Kallos MS (2007) Embryonic stem
cells remain highly pluripotent following long term expansion as aggregates in suspension bioreactors. J Biotechnol 129: 421–432.
39. Tzanakakis ES, Hansen LK, Hu WS (2001) The role of actin filaments and microtubules in hepatocyte spheroid self-assembly. Cell Motil Cytoskeleton 48: 175–189.
40. Powers DE, Millman JR, Bonner-Weir S, Rappel MJ, Colton CK (2010) Accurate control of oxygen level in cells during culture on silicone rubber membranes with application to stem cell differentiation. Biotechnol Prog 26: 805–818.
41. von Smoluchowski M (1917) Versuch einer mathematischen Theorie der Koagulationskinetik kolloider Lo¨sungen. Zeitschrift f Physik Chemie 92: 129– 168.
42. Belval TK, Hellums JD (1986) Analysis of shear-induced platelet aggregation with population balance mathematics. Biophys J 50: 479–487.