Abstract— Fan day is an annual sports event that allows people to meet and get the autograph or photograph of different sports teams and coaches. This kind of event normally attracts thousands of people. Since a large group of people will come to the same place at the same time, poor management will lead to chaos. The most significant problem is the length of the queues because the time is limited. In this paper, we analyze and improve the current queuing systems of Auburn University Fan Day. The results of the current layout and suggested layout are compared.
Index Terms — Queuing Theory; Simulation; Constant Work-in-Process Systems (CONWIP).
I. INTRODUCTION
NIVERSITY fan day in United States is an annual event
that allows people to meet and get the autograph or photograph of different sports teams and coaches. This event is generally held in the sports stadium. There are many university sports teams that participate in this event. Football team is the most famous. Most of the fans want to get their signatures and take photograph with them. Coach and university mascot also serve the fans in this event. This event attracts thousands of people per year in average. Therefore, poor crowd management will lead to chaos.
The most significant problem is the length of the queues because players will stay in the stadium for a specific period of time after that they will leave without concerning the existing queues. Some fans cannot get the signatures they seek. Some fans spent their entire time in the queue and cannot make it to the player before the event ends. Many fans were disappointed and went back home empty handed.
The other problem is lack of organization. Because it is very crowed inside the stadium, people will be confused and cannot find what they are looking for when they enter the stadium. The suggested layout may improve the flow of people so fans can get more signatures than before.
In this paper, we use Auburn University fan day as a case study. There are many sports teams that participate in this event. Since the football team get more attentions from fans than any other team, we will only focus on the queuing systems of football team in this paper. The main objective of this paper is to improve fan day queuing systems and see more happy fans. We first investigate the current layout and queuing systems. Next, the proposed layout and queuing systems are analyzed. We consider the proposed layout as constant work-in-process systems (CONWIP) with a buffer between each player. Both configurations are compared to show the efficiency of the new layout.
Manuscript received July 23, 2013;
Pavee Siriruk is with Department of Industrial Engineering, Suranaree University of Technology, Nakhon Ratchasima, Thailand 30000 (phone: +66-81-470-7706; e-mail: [email protected]).
CONWIP systems are widely used in manufacturing systems. Prakash and Feng [1] describe various models of CONWIP used to date; basic CONWIP system, the hybrid CONWIP system, the multi-product CONWIP system, and the parallel CONWIP system. In 2011, Kumar and Ananth [2] develops a new approach for evaluating the performance of Multi-product manufacturing systems operating under CONWIP with batch size constraints. CONWIP can also applies to other problems. Duranik, Ruzbarsky, and Stopper [3] combine CONWIP with production planning to improve delivery reliability and throughput. The results show that this system can greatly help medium size industries. The paper is organized as follows. Section two briefly describes the current and new layout of the stadium. In section three, the queuing model from the new and previous layout are presented. Section four, the discussion of results on the new and current model is presented. Section five gives conclusions
II. CURRENT LAYOUT V.S.PROPOSED LAYOUT
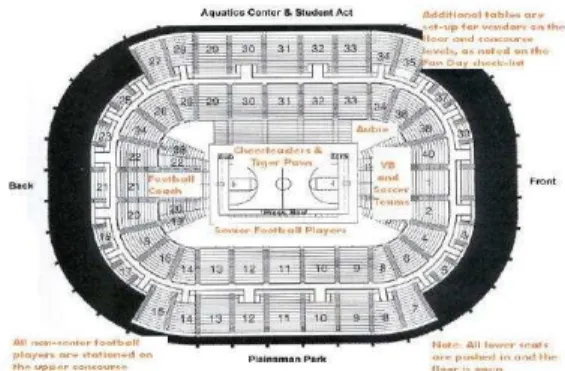
Auburn university fan day is held in Beard-Eaves Memorial Coliseum. The Coliseum has a capacity of 15,000.There are football team, volley ball team, soccer team, Tiger paws, and cheerleaders that participate in this event. The football team attracts more fans than any other team. Coach and Aubie, university mascot, also serve the fans in this event. The current layout of the Coliseum for this event is depicted in Figure 1. This event attracts 3000-5000 people per year in average. All teams will stay in the Coliseum only 2 hours between 3:00 PM and 5:00 PM after that they will leave without concerning the existing queues. A lot of disappointed fans spent their entire time in the queue and cannot make it to the player before 5:00 PM.
Fig. 1. The layout of Beard-Eaves Memorial Coliseum.
A. Current Layout
Football team is divided into two groups: senior football players and non-senior football players.
There are 13 senior football players and 7 tables. The tables are arranged in one serial line, as 10 of them are organized into 5 tables, 2 per table, and the 3 most famous
Fan Day Queueing Systems
Pavee Siriruk
U
Proceedings of the World Congress on Engineering and Computer Science 2013 Vol II WCECS 2013, 23-25 October, 2013, San Francisco, USA
ISBN: 978-988-19253-1-2
ISSN: 2078-0958 (Print); ISSN: 2078-0966 (Online)
football players left will share 2 tables. The tables of senior football players are located on the South to prevent fans from blocking the entrance of the coliseum.
There are 100 non-senior football players who sit in one long serial line. They are stationed on the upper concourse which is located on the Southwest corner.
The queue of both senior and non-senior football players starts from the first table to the last table. Fans will have to go through every player even though they do not want to get autographs or signatures of some players.
B. Proposed Layout
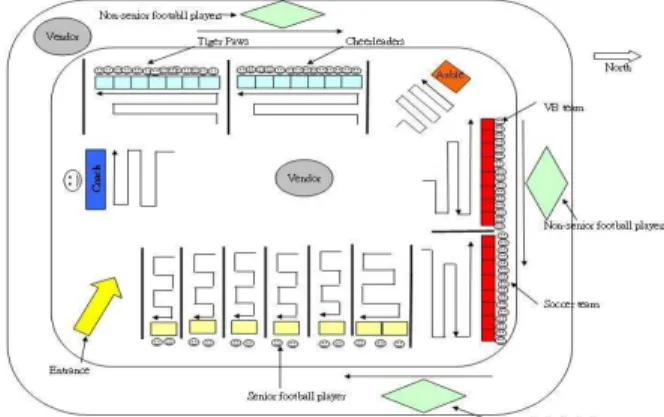
Senior football players are divided into six groups: 10 of them are organized into 5 tables, 2 per table. The most three famous football players will share 2 tables. Those tables are arranged in a row. The queue of each group is independent, which means the fans can only get the signatures of players according to which line they are lining up. After getting the signatures, fans need to leave that system instead of moving to the next table directly. In order to let the fans know whose signatures they would get from this waiting line, we put the name tags of players at the entrance of waiting line and also in the back of each player. The queues at each table are extended in zigzag shapes to save the space used in the court. The new layout is shown in Figure 2.
Fig. 2. The proposed layout of Beard-Eaves Memorial Coliseum.
Non-senior football players are divided into 3 groups instead of one group. The reason is that the length of the original set up is too long. Though the length of the waiting line in front of this group looks quite short, it takes the fan lots of time to go through 100 players. Once we separate those players into three groups, then there will be an independent waiting line for each group. The fans do not need to spend time on getting signatures from the players they even do not know. Moreover, the space on the upper concourse level is enough for three groups, which are two with 33 players and one with 34 players; they are located on each side of the upper concourse level except for the South side.
The event should be organized as follows. Fans would arrive at the coliseum earlier than all football players. They can choose the queue they are going to line up according to the name tags at the entrance of each line. When the activity starts, the first player of each table takes the item that the fans offer and signs it. After finishing signing, the first player gives the items to the player seated next to him or her, and so on. When the last player finishes signing, the fan needs to leave that queue immediately and chooses the next
queue that he or she is going to line up. Arranging the queue this way, the probability of the fans getting blocked is much smaller than the original model.
III. MATHEMATICAL MODEL
Due to the redesign of the layout for some groups, we make some assumptions in the model, and then compare the results coming out between the original and the new model.
From the data in the past, we assume that the total number of people is 3,500 this year for two hours. First, we do not consider the collector and atypical fans which are 15 percent of all fans because they will concentrate on football players. Moreover, we also assume that people would arrive to the line constantly during 2 hours as a uniform distribution. In the system of senior football players, non-senior football players, as a result of their popularity, we just assume that the length of the queue in front of their system would never decrease apparently, which means they have a queue with infinite number of people.
In the system of the senior football players and the non-senior football players, due to the assumption of infinite length of queue in front of each system, so the utilization of the first player in each group would be equal to 1, which means that the player would always be busy signing for the fans. The throughput is the same as the processing rate ( ), which is the inverse of mean processing time ( [ ]). We consider these two systems as constant work-in-process systems (CONWIP) with a buffer between each player. The size of buffer between each player is two. Assume that the systems are always full and the amount of work-in-process (WIP) cannot be reduced. So the work-in-process for the original model of senior football players is exactly 37 all the time, for the new model of senior football player is 4 in the two-player groups and 7 in the three-player groups, for the original model of non-senior football players is 298, and for the new model of non-senior football players is 97 in the group of three players and 100 in the group of thirty-four players. The logic behind this number is, for example, there are 13 players in the original model of senior football players. Each player signs for one fan so there are 13 fans in the line. Moreover, there are 12 buffer locations with size 2 for each, so it is 24 fans in the buffer location. Therefore, there are 37 fans in the system.
We assume that the squared coefficient of variation of inter-arrive ( ) equals to 1. we can get the squared coefficient of variation of processing ( ) for the system as follows,
= [ ] (1) As mentioned above, we assume that the mean processing time of each individual player is normally distributed random variable, which equals to the mocked data ( , ) ~ (15.18, 6.95 ) for the system of senior football players, and ( , ) ~ (20.67, 4.75 ) for the system of non-senior football player that we use simulation method to approximate it.
We use the general service model in CONWIP to solve the cycle time ( ) as follows and utilization ( ) of individual. are shown as followed:
Proceedings of the World Congress on Engineering and Computer Science 2013 Vol II WCECS 2013, 23-25 October, 2013, San Francisco, USA
ISBN: 978-988-19253-1-2
ISSN: 2078-0958 (Print); ISSN: 2078-0966 (Online)
( ) = ( )− ( )+ 1 [ ] +
( ) [ ]/(2 [ ]) (2)
where [ ] = [ ] × (1 + [ ]). (3) Throughput ( ) with − 1 jobs is
( )=∑ − 1
( ). (4)
Work-in-process ( ) can be computed as follows
( )= ( ) ( ) (5)
The utilization ( ) of individual can be calculated as
( )= ( ) [ ] (6)
where is the number of work in process, and is the relative flow rate.
Since there’s only one path for each operation and no re-entrance flow, so the relative flow would always be equal to 1 for all players. From equation (1) - (5), we get a set of data to get the cycle time of the whole system, and then we repeat the simulation method to get one thousand sets of individual mean processing time to approximate the cycle time of the system, just like what we did in the systems above. Take the 2-player group in the new model of senior football players system for example, just like the Figure 3 shows.
IV. NUMERICAL EXAMPLES
From the mock data we made for this project, the mean processing time of each player is 15.17 seconds per people and the variance is 48.34824. We know that = 1. Then we can calculate
[ ] = [ ] = [ ] = .. = 0.21.
From equation (6), we can find that
[ ] = [ ] = [ ] × (1 + [ ]) = 15.17 × (1 + 2.01) = 278.48.
In the first iteration, from equation (2), we can compute cycle time as follows
(1) = (2) = (0 − 0 + 1) × 15.17 + 0 ×2 × 15.17278.477 = 15.17 seconds
From equation (4), (5), and (6), we can calculate
( )=1 × 15.17 + 1 × 15.17 = 0.03296,2 − 1
( )= 1 × 0.03296 × 15.17 = 0.5, and
( )= 1 × 0.03296 × 15.17 = 0.5.
Repeat the same procedure above for iterations; then the results we get for original and new model are shown in Table 1 below:
TABLEI
CYCLE TIME FOR SYSTEMS OF SENIOR FOOTBALL PLAYERS
Senior Football PlayersOriginal Model New Model
Number of Players in a
group 13.00 2.00 3.00
Work in process (people) 37.00 4.00 7.00 Std Dev (sec.) 135.86 18.52 35.58 Average of CTs (sec.) 979.56 70.77 125.40 Throughput (people/sec.) 0.04 0.06 0.06
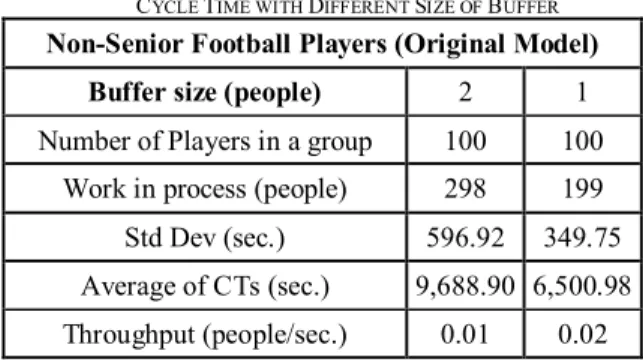
In the system of non-senior football players, we have assumed that the size of buffer located between each player is two. But after we simulate and try to approximate the cycle time of the whole system, we find that it does not fit the reality because of the extreme large number of people and the long service time in the system. So we try to use the buffer size equal to 1 to do the simulation again to see if the result becomes more realistic. Table 2 below shows the difference of cycle time caused by different size of buffer.
TABLEII
CYCLE TIME WITH DIFFERENT SIZE OF BUFFER
Non-Senior Football Players (Original Model)
Buffer size (people) 2 1
Number of Players in a group 100 100 Work in process (people) 298 199 Std Dev (sec.) 596.92 349.75 Average of CTs (sec.) 9,688.90 6,500.98 Throughput (people/sec.) 0.01 0.02 Since the cycle time of buffer size equal to 1 is much smaller than the size of 2, so we think that it is better to use buffer size one for the original model. However, we still use buffer size two in the new model to compare with the one in the original model. The Table 3 followed shows the results of original model and new model with buffer size of two.
TABLEIII
CYCLE TIME FOR SYSTEMS OF NON-SENIOR FOOTBALL PLAYERS
Non-Senior Football
Players Original Model New Model
Number of Players in a group 100 33 34
Work in process (people) 199 65 67
Std Dev (sec.) 349.75 207.00 210.77 Average of CTs (sec.) 6,500.98 2,952.973,052.20 Throughput (people/sec.) 0.01538 0.02201 0.02195 In the system of senior football players, we consider it as a CONWIP system by placing a buffer between each player; in which contains two fans. And we separate the original one serial line model into five 2-player groups and one most famous 3-player group. We assume that while the fan gets done from one group, he or she will immediately enter the next senior football player group until he or she collects all the signatures of senior football players. If so, the ending Proceedings of the World Congress on Engineering and Computer Science 2013 Vol II
WCECS 2013, 23-25 October, 2013, San Francisco, USA
ISBN: 978-988-19253-1-2
ISSN: 2078-0958 (Print); ISSN: 2078-0966 (Online)
result for fans of getting all the signatures is the same no matter in the original or new model. We can just sum up the cycle time of each group in the new model to get the cycle time of whole system. And then we can compare the average of cycle time spend in the system to decide the better layout method. In the original model, the average cycle time for a fan getting processed in the system is 979.56 seconds, on the other way, in the new model, the average cycle time is equal to 5x70.77+125.40=479.25 seconds. Apparently, the cycle time of new model is much shorter than the one of original model.
In the system of non-senior football players, the length of queue in the whole one hundred players system is too long. So we separate the system into three minor groups to see if we can get a better efficiency of processing, which is shorter cycle time of the system. The same as the senior football players system, we assume that after the fan getting done from one group, he or she would be in the next group immediately until finishing all the signing in this system. We try to experiment that which buffer size is better for using in the original model, so at first, we use buffer size two between each player to see how long would the cycle time of system be. Then we find that the result cycle time is 9,688.899 seconds for the original system, and it is too long for reality. Second, we try to use buffer size one to see what happened, the result is 6,500.976 seconds, which is much better than the one of buffer size two. Then we can say that the buffer size one makes the original model work more efficiently. However, we still use buffer size two in the groups of new model to compare with the one in the original model. For the 33 players group, the cycle time of system is 2,952.971 seconds, and for the 34 players group, it is 3,052.203 seconds. Due the assumption of mentioned above, we sum up the cycle time of each group to compare with the one of original model to see the difference. The total cycle time of the new model is 8,958.145 seconds, which is shorter than the 9,688.899 seconds of original model. The cycle time decreases only a little although the length of it is still too long in the new model. From the mocked data of the experiment we did in class, the mean processing time and variance we got are not precise for each non-senior football players, and in the real situation the mean processing time may be shorter.
V. CONCLUSIONS
This paper has presented the proposed layout for Auburn university fan day queuing systems. This paper focuses on the queuing systems of senior and non-senior football players. We consider these two systems as constant work-in-process systems (CONWIP) with a buffer between each player. The buffer size of the systems of senior football players is two. However, the buffer size of the systems of non-senior football players is one. The results show that the cycle time of modified model is much shorter than the original model.
REFERENCES
[1] J. Prakash, C. Feng “Variation of CONWIP systems,” World Academy of science, Engineering and Technology Vol. 72, 2012, pp. 1131-1135.
[2] K. Satyam, A. Krishnamurthy, “Performance analysis of CONWIP systems with batch size constraints,” Annual of Operations Research, April, 2011 (Accepted).
[3] T. Duranik, J. Ruzbarsky, M. Stopper, “Improving of delivery reliability and throughput using production planning with CONWIP aspects,” Annals of DAAAM for 2012, Vol. 23, No.1, 2012, pp.907-910.
Proceedings of the World Congress on Engineering and Computer Science 2013 Vol II WCECS 2013, 23-25 October, 2013, San Francisco, USA
ISBN: 978-988-19253-1-2
ISSN: 2078-0958 (Print); ISSN: 2078-0966 (Online)