IJCSI International Journal of Computer Science Issues, Vol. 7, Issue 4, No 2, July 2010 ISSN (Online): 1694‐0784
ISSN (Print): 1694‐0814 18
An Improved k-Nearest Neighbor Classification Using
Genetic Algorithm
N. Suguna1, and Dr. K. Thanushkodi2
1
Professor in Computer Science and Engg, Akshaya College of Engineering and Technology, Coimbatore, Tamil Nadu, India.
2
Director, Akshaya College of Engineering and Technology, Coimbatore, Tamil Nadu, India.
Abstract
k-Nearest Neighbor (KNN) is one of the most popular algorithms for pattern recognition. Many researchers have found that the KNN algorithm accomplishes very good performance in their experiments on different data sets. The traditional KNN text classification algorithm has three limitations: (i) calculation complexity due to the usage of all the training samples for classification, (ii) the performance is solely dependent on the training set, and (iii) there is no weight difference between samples. To overcome these limitations, an improved version of KNN is proposed in this paper. Genetic Algorithm (GA) is combined with KNN to improve its classification performance. Instead of considering all the training samples and taking k-neighbors, the GA is employed to take k-neighbors straightaway and then calculate the distance to classify the test samples. Before classification, initially the reduced feature set is received from a novel method based on Rough set theory hybrid with Bee Colony Optimization (BCO) as we have discussed in our earlier work. The performance is compared with the traditional KNN, CART and SVM classifiers. Keywords: k-Nearest Neighbor, Genetic Algorithm, Support Vector Machine, Rough Set.
1. Introduction
Nearest neighbor search is one of the most popular learning and classification techniques introduced by Fix and Hodges [1], which has been proved to be a simple and powerful recognition algorithm. Cover and Hart [2] showed that the decision rule performs well considering that no explicit knowledge of the data is available. A simple generalization of this method is called K-NN rule, in which a new pattern is classified into the class with the most members present among the K nearest neighbors, can be used to obtain good estimates of the Bayes error and its probability of error asymptotically approaches the Bayes error [3]. The traditional KNN text classification has three limitations [4]:
1.
High calculation complexity: To find out the k nearest neighbor samples, all the similarities between thetraining samples must be calculated. When the number of training samples is less, the KNN classifier is no longer optimal, but if the training set contains a huge number of samples, the KNN classifier needs more time to calculate the similarities. This problem can be solved in 3 ways: reducing the dimensions of the feature space; using smaller data sets; using improved algorithm which can accelerate to [5];
2.
Dependency on the training set: The classifier isgenerated only with the training samples and it does not use any additional data. This makes the algorithm to depend on the training set excessively; it needs re-calculation even if there is a small change on training set;
3.
No weight difference between samples: All the training samples are treated equally; there is no difference between the samples with small number of data and huge number of data. So it doesn’t match the actual phenomenon where the samples have uneven distribution commonly.A wide variety of methods have been proposed to deal with these problems [6-9]. Another problem is that the classification algorithms will be confused with more number of features. Therefore, feature subset selection is implicitly or explicitly conducted for learning systems [10], [11]. There are two steps in neighborhood classifiers. First an optimal feature subspace is selected, which has a similar discriminating power as the original data, but the number of features is greatly reduced. Then the neighborhood classifier is applied. In this paper, we have used a novel method based on Rough set theory hybrid with Bee Colony Optimization (BCO) to select the optimal feature set as discussed in our previous work [12]. Then the proposed GKNN classifier is analyzed with this reduced feature set.
k-IJCSI International Journal of Computer Science Issues, Vol. 7, Issue 4, No 2, July 2010 19 www.IJCSI.org
neighbors with greater distances are taken for classification. In our proposed method, by using GA, k-number of samples are chosen for each iteration and the classification accuracy is calculated as fitness. The highest accuracy is recorded each time. Thus, it is not required to calculate the similarities between all samples, and there is no need to consider the weight of the category. This paper is structured as follows: the following section presents the traditional KNN algorithm. Section 3 explains the proposed GKNN classifier. The comparative experiments and results are discussed in Section 4 and the work is concluded in Section 5.
2. KNN Classification Algorithm
In pattern recognition field, KNN is one of the most important non-parameter algorithms [13] and it is a supervised learning algorithm. The classification rules are generated by the training samples themselves without any additional data. The KNN classification algorithm predicts the test sample’s category according to the K training samples which are the nearest neighbors to the test sample, and judge it to that category which has the largest category probability. The process of KNN algorithm to classify sample X is [14]:
Suppose there are j training categories C1,C2,…,Cj and the sum of the training samples is N after feature reduction, they become m-dimension feature vector.
Make sample X to be the same feature vector of the form (X1, X2,…, Xm), as all training samples.
Calculate the similarities between all training
samples and X. Taking the ith sample di
(di1,di2,…,dim) as an example, the similarity SIM(X, di) is as following:
2
1 2
1 1
.
.
)
,
(
m
j ij m
j j m
j
ij j
i
d
X
d
X
d
X
SIM
Choose k samples which are larger from N
similarities of SIM(X, di), (i=1, 2,…, N), and treat them as a KNN collection of X. Then, calculate the probability of X belong to each category respectively with the following formula.
)
,
(
.
)
,
(
)
,
(
i jd
i
j
SIM
X
d
y
d
C
C
X
P
Where y(di, Cj) is a category attribute function, which satisfied
y(d,, Cj) =
j i
j i
C
d
C
d
,
0
,
1
Judge sample X to be the category which has the
largest P(X, Cj).
3. Improved KNN Classification Based On
Genetic Algorithm
Genetic algorithm (GA) [15], [16] is a randomized search and optimization technique guided by the principles of evolution and natural genetics, having a large amount of implicit parallelism. GAs perform search in complex, large and multimodal landscapes, and provide near-optimal solutions for objective or fitness function of an optimization problem.
In GA, the parameters of the search space are encoded in the form of strings (called chromosomes). A collection of such strings is called a population. Initially, a random population is created, which represents different points in the search space. An objective and fitness function is associated with each string that represents the degree of goodness of the string. Based on the principle of survival of the fittest, a few of the strings are selected and each is assigned a number of copies that go into the mating pool. Biologically inspired operators like cross-over and mutation are applied on these strings to yield a new generation of strings. The process of selection, crossover and mutation continues for a fixed number of generations or till a termination condition is satisfied. An excellent survey of GA along with the programming structure used can be found in [16]. GA have applications in fields as diverse as VLSI design, image processing, neural networks, machine learning, job shop scheduling, etc.
String Representation - Here the chromosomes are encoded with real numbers; the number of genes in each chromosome represents the samples in the training set. Each gene will have 5 digits for vector index and k number of genes. For example, if k=5, a sample chromosome may look as follows:
00100 10010 00256 01875 00098
Here, the 00098 represents, the 98th instance and the second gene say that the 1875 instance in the training sample. Once the initial population is generated now we are ready to apply genetic operators. With these k neighbors, the distance between each sample in the testing set is calculated and the accuracy is stored as the fitness values of this chromosome.
Reproduction (selection) - The selection process selects chromosomes from the mating pool directed by the survival of the fittest concept of natural genetic systems. In the proportional selection strategy adopted in this article, a chromosome is assigned a number of copies, which is proportional to its fitness in the population, that go into the mating pool for further genetic operations. Roulette wheel selection is one common technique that implements the proportional selection strategy.
Crossover - Crossover is a probabilistic process that exchanges information between two parent chromosomes for generating two child chromosomes. In this paper, single point crossover with a fixed crossover probability of pc is used. For chromosomes of length l, a random integer, called the crossover point, is generated in the range [1, l-1]. The portions of the chromosomes lying to the right of the crossover point are exchanged to produce two offspring.
Mutation - Each chromosome undergoes mutation with a
fixed probability pm. For binary representation of
IJCSI International Journal of Computer Science Issues, Vol. 7, Issue 4, No 2, July 2010 20 www.IJCSI.org
flipping its value. Since we are considering real numbers in this paper, a random position is chosen in the chromosome and replace by a random number between 0-9.
After the genetic operators are applied, the local maximum fitness value is calculated and compared with global maximum. If the local maximum is greater than the global maximum then the global maximum is assigned with the local maximum, and the next iteration is continued with the new population. The cluster points will be repositioned corresponding to the chromosome having global maximum. Otherwise, the next iteration is continued with the same old population. This process is repeated for N number of iterations. From the following section, it is shown that our refinement algorithm improves the cluster quality. The algorithm is given as.
1. Choose k number of samples from the training set to generate initial population (p1).
2. Calculate the distance between training samples in
each chromosome and testing samples, as fitness value.
3. Choose the chromosome with highest fitness value
store it as global maximum (Gmax). a. For i = 1 to L do
i. Perform reproduction ii. Apply the crossover operator.
iii. Perform mutation and get the new
population. (p2)
iv. Calculate the local maximum
(Lmax).
v. If Gmax < Lmax then
a. Gmax = Lmax;
b. p1 = p2;
b. Repeat
4. Output – the chromosome which obtains Gmax has
the optimum K-neighbors and the corresponding labels are the classification results.
4. Experiments & Results
The performance of the reduct approaches discussed in this paper has been tested with 5 different medical datasets, downloaded from UCI machine learning data repository. Table 1 shows the details about the datasets and the reduced feature set used in this paper.
Table 1 Datasets Used for Reduct Dataset
Name
Total No. of Instances
Total No. of Features
No. of Features in the Reduced Set (BeeRSAR [12])
Dermatology 366 34 7
Cleveland
Heart 300 13
6
HIV 500 21 8
Lung Cancer 32 56 4
Wisconsin 699 09 4
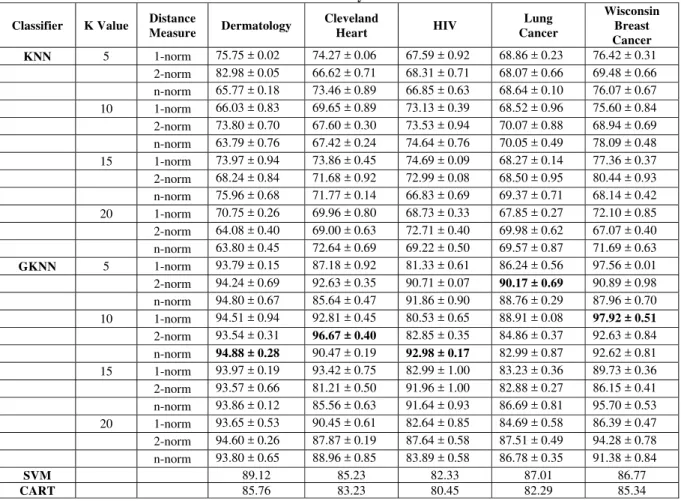
With the reduced feature set, the GKNN classifier is applied. Ten-fold cross validation method is performed for analyzing
the performance with various k values on three different distance measures (1-norm, 2-norm and n-norm). Table 2 depicts the performance accuracy of our proposed classifier compared with traditional KNN, CART and SVM classifiers [17]. From the results it is shown that our proposed method outperforms the others with greater accuracy.
5. Conclusion
The KNN classifier is one of the most popular neighborhood classifier in pattern recognition. However, it has limitations such as: great calculation complexity, fully dependent on training set, and no weight difference between each class. To combat this, a novel method to improve the classification performance of KNN using Genetic Algorithm (GA) is proposed in this paper. Initially the reduced feature set is constructed from the samples using Rough set based Bee Colony Optimization (BeeRSAR). Next, our proposed GKNN classifier is applied for classification. The basic idea here is that, instead of calculating the similarities between all the training and test samples and then choosing k-neighbors for classification, by using GA, only k-neighbors are chosen at each iteration,, the similarities are calculated, the test samples are classified with these neighbors and the accuracy is calculated. This process is repeated for L number of times to reach greater accuracy; hence the calculation complexity of KNN is reduced and there is no need to consider the weight of the samples. The performance of GKNN classifier is tested with five different medical data collected from UCI data repository, and compared with traditional KNN, CART and SVM. The experiments and results show that our proposed method not only reduces the complexity of the KNN, also it improves the classification accuracy.
References
[1] E. Fix, and J. Hodges, “Discriminatory analysis. Nonparametric discrimination: Consistency properties”.
Technical Report 4, USAF School of Aviation Medicine, Randolph Field, Texas, 1951.
[2] T.M. Cover, and P.E. Hart, “Nearest neighbor pattern classification”, IEEE Transactions on Information Theory, 13, pp. 21–27, 1967.
[3] R.O. Duda, and P.E. Hart, Pattern classification and scene analysis, New York: Wiley, 1973.
[4] W. Yu, and W. Zhengguo, “A fast kNN algorithm for text categorization”, Proceedings of the Sixth International Conference on Machine Learning and Cybernetics, Hong Kong, pp. 3436-3441, 2007.
[5] W. Yi, B. Shi, and W. Zhang’ou, “A Fast KNN Algorithm Applied to Web Text Categorization”, Journal of The China Society for Scientific and Technical Information, 26(1), pp. 60-64, 2007.
[6] K.G. Anil, “On optimum choice of k in nearest neighbor classification”, Computational Statistics and Data Analysis, 50, pp. 3113–3123, 2006.
[7] E. Kushilevitz, R. Ostrovsky, and Y. Rabani, “Efficient search for approximate nearest neighbor in high dimensional spaces”. SIAM Journal on Computing, 30, pp. 457–474, 2000.
[8] M. Lindenbaum, S. Markovitch, and D. Rusakov, “Selective sampling for nearest neighbor classifiers”,
IJCSI International Journal of Computer Science Issues, Vol. 7, Issue 4, No 2, July 2010 21 www.IJCSI.org
[9] C. Zhou, Y. Yan, and Q. Chen, “Improving nearest neighbor classification with cam weighted distance”.
Pattern Recognition, 39, pp. 635–645, 2006.
[10] D.P. Muni, and N.R.D. Pal, “Genetic programming for simultaneous feature selection and classifier design”,
IEEE Transactions on Systems Man and Cybernetics Part B – Cybernetics, 36, pp. 106–117, 2006.
[11] J. Neumann, C. Schnorr, and G. Steidl, “Combined SVM-based feature selection and classification”, Machine Learning, 61, pp. 129–150, 2005.
[12] N. Suguna, and K. Thanushkodi, “A Novel Rough Set Reduct Algorithm Based on Bee Colony Optimization”, International Journal of Granular Computing, Rough Sets and Intelligent Systems, (Communicated) 2010.
[13] Belur V. Dasarathy, “Nearest Neighbor (NN) Norms: NN Pattern Classification Techniques”, Mc Graw-Hill Computer Science Series, IEEE Computer Society Press, Las Alamitos, California, pp. 217-224, 1991.
[14] Y. Lihua, D. Qi, and G. Yanjun, “Study on KNN Text Categorization Algorithm”, Micro Computer Information, 21, pp. 269-271, 2006.
[15] D.E. Goldberg, Genetic Algorithms in Search, Optimization and Machine Learning, Addison-Wesley, New York, 1989.
[16] L. Davis (Ed.), Handbook of Genetic Algorithms, Van Nostrand Reinhold, New York, 1991.
[17] Q. Hu, D. Yu and Z. Xie, Neighborhood Classifiers, Expert Systems with Applications, 2007.
Author Biographies
N.Suguna received her B.E degree in Computer Science and Engineering from Madurai Kamaraj University in 1999 and M.E. degree in Computer Science and Engineering from Bangalore University in 2003. She has more than a decade of teaching experience in various Engineering colleges in Tamil Nadu and Karnataka. She is currently with Akshaya College of Engineering and Technology, Coimbatore, Tamilnadu, India. Her research interests include Data Mining, Soft Computing and Object Oriented Systems.
Dr.K.Thanushkodi has more than 35 years of teaching experience in various Government & Private Engineering Colleges. He has published 45 papers in International journals and conferences. He is currently guiding 15 research scholars in the area of Power System Engineering, Power Electronics and Computer Networks. He has been the Principal in-charge and Dean in Government College of Engineering Bargur. He has served as senate member in Periyar University, Salem. He has served as member of the research board, Anna University, Chennai. He Served as Member Academic Council, Anna University, Chennai. He is serving as Member, Board of Studies in Electrical Engineering, Anna University, Chennai. He is serving as Member, Board of Studies in Electrical and Electronics & Electronics and Communication Engineering, Amritha Viswa Vidya Peetham, Deemed University, Coimbatore. He is serving as Governing Council Member SACS MAVMM Engineering College, Madurai. He served as Professor and Head of E&I, EEE, CSE & IT Departments at Government College of Technology, Coimbatore. He is serving as Syndicate Member of Anna University, Coimbatore. Currently, he is the Director of Akshaya College of Engineering and Technology, Coimbatore.
Table 2. Performance Analysis of the Classifiers
Classifier K Value Distance
Measure Dermatology
Cleveland
Heart HIV
Lung Cancer
Wisconsin Breast Cancer KNN 5 1-norm 75.75 ± 0.02 74.27 ± 0.06 67.59 ± 0.92 68.86 ± 0.23 76.42 ± 0.31
2-norm 82.98 ± 0.05 66.62 ± 0.71 68.31 ± 0.71 68.07 ± 0.66 69.48 ± 0.66 n-norm 65.77 ± 0.18 73.46 ± 0.89 66.85 ± 0.63 68.64 ± 0.10 76.07 ± 0.67 10 1-norm 66.03 ± 0.83 69.65 ± 0.89 73.13 ± 0.39 68.52 ± 0.96 75.60 ± 0.84 2-norm 73.80 ± 0.70 67.60 ± 0.30 73.53 ± 0.94 70.07 ± 0.88 68.94 ± 0.69 n-norm 63.79 ± 0.76 67.42 ± 0.24 74.64 ± 0.76 70.05 ± 0.49 78.09 ± 0.48 15 1-norm 73.97 ± 0.94 73.86 ± 0.45 74.69 ± 0.09 68.27 ± 0.14 77.36 ± 0.37 2-norm 68.24 ± 0.84 71.68 ± 0.92 72.99 ± 0.08 68.50 ± 0.95 80.44 ± 0.93 n-norm 75.96 ± 0.68 71.77 ± 0.14 66.83 ± 0.69 69.37 ± 0.71 68.14 ± 0.42 20 1-norm 70.75 ± 0.26 69.96 ± 0.80 68.73 ± 0.33 67.85 ± 0.27 72.10 ± 0.85 2-norm 64.08 ± 0.40 69.00 ± 0.63 72.71 ± 0.40 69.98 ± 0.62 67.07 ± 0.40 n-norm 63.80 ± 0.45 72.64 ± 0.69 69.22 ± 0.50 69.57 ± 0.87 71.69 ± 0.63 GKNN 5 1-norm 93.79 ± 0.15 87.18 ± 0.92 81.33 ± 0.61 86.24 ± 0.56 97.56 ± 0.01 2-norm 94.24 ± 0.69 92.63 ± 0.35 90.71 ± 0.07 90.17 ± 0.69 90.89 ± 0.98 n-norm 94.80 ± 0.67 85.64 ± 0.47 91.86 ± 0.90 88.76 ± 0.29 87.96 ± 0.70 10 1-norm 94.51 ± 0.94 92.81 ± 0.45 80.53 ± 0.65 88.91 ± 0.08 97.92 ± 0.51 2-norm 93.54 ± 0.31 96.67 ± 0.40 82.85 ± 0.35 84.86 ± 0.37 92.63 ± 0.84 n-norm 94.88 ± 0.28 90.47 ± 0.19 92.98 ± 0.17 82.99 ± 0.87 92.62 ± 0.81 15 1-norm 93.97 ± 0.19 93.42 ± 0.75 82.99 ± 1.00 83.23 ± 0.36 89.73 ± 0.36 2-norm 93.57 ± 0.66 81.21 ± 0.50 91.96 ± 1.00 82.88 ± 0.27 86.15 ± 0.41 n-norm 93.86 ± 0.12 85.56 ± 0.63 91.64 ± 0.93 86.69 ± 0.81 95.70 ± 0.53 20 1-norm 93.65 ± 0.53 90.45 ± 0.61 82.64 ± 0.85 84.69 ± 0.58 86.39 ± 0.47 2-norm 94.60 ± 0.26 87.87 ± 0.19 87.64 ± 0.58 87.51 ± 0.49 94.28 ± 0.78 n-norm 93.80 ± 0.65 88.96 ± 0.85 83.89 ± 0.58 86.78 ± 0.35 91.38 ± 0.84
SVM 89.12 85.23 82.33 87.01 86.77