USING ASTER MULTISPECTRAL IMAGERY FOR MAPPING WOODY
INVASIVE SPECIES IN PICO DA VARA NATURAL RESERVE (AZORES
ISLANDS, PORTUGAL)
1Artur Gil², Qian Yu³, Mohamed Abadi4 e Helena Calado5
ABSTRACT – This paper aims to assess the effectiveness of ASTER imagery to support the mapping of Pittosporum undulatum, an invasive woody species, in Pico da Vara Natural Reserve (S. Miguel Island, Archipelago of the Azores, Portugal). This assessment was done by applying K-Nearest Neighbor (KNN), Support Vector Machine (SVM) and Maximum Likelihood (MLC) pixel-based supervised classifications to 4 different geographic and remote sensing datasets constituted by the Visible, Near-Infrared (VNIR) and Short Wave Infrared (SWIR) of the ASTER sensor and by digital cartography associated to orography (altitude and “distance to water streams”) of which the spatial distribution of Pittosporum undulatum directly depends. Overall, most performed classifications showed a strong agreement and high accuracy. At targeted species level, the two higher classification accuracies were obtained when applying MLC and KNN to the VNIR bands coupled with auxiliary geographic information use. Results improved significantly by including ecology and occurrence information of species (altitude and distance to water streams) in the classification scheme. These results show that the use of ASTER sensor VNIR spectral bands, when coupled to relevant ancillary GIS data, can constitute an effective and low cost approach for the evaluation and continuous assessment of Pittosporumundulatum woodland propagation and distribution within Protected Areas of the Azores Islands.
Keywords:Remote Sensing; Invasive species; Pittosporum undulatum.
USO DE IMAGENS MULTIESPECTRAIS ASTER PARA MAPEAR ESPÉCIES
INVASORAS LENHOSAS NA RESERVA NATURAL DE PICO DA VARA
(AÇORES, PORTUGAL)
RESUMO – Este artigo teve como objetivo a avaliação das imagens multiespectrais ASTER para o mapeamento de Pittosporum undulatum, uma espécie lenhosa invasora, na Reserva Natural do Pico da Vara (Ilha de S. Miguel, Arquipélago dos Açores, Portugal). A avaliação foi efetuada através da aplicação dos métodos de classificação supervisionada per-pixel "K vizinhos mais próximos" (KNN), "máquinas de vetores de suporte" (SVM) e "máxima verosimilhança" (MLC) a quatro diferentes conjuntos de dados geográficos e de sensoriamento remoto constituídos pelas bandas multiespectrais do visível e infravermelho próximo (VNIR) e infravermelho de onda curta (SWIR) do sensor ASTER e, ainda, por cartografia digital associada à orografia (altitude e distância a linhas de água), da qual depende diretamente a distribuição espacial do Pittosporum undulatum. Em nível global, a maioria das classificações obtidas apresentou forte concordância e alta precisão. Em nível da espécie invasora estudada, as duas classificações mais precisas foram obtidas através da aplicação de MLC e KNN às bandas VNIR associadas ao uso da informação geográfica auxiliar. Em termos gerais, a qualidade dos resultados apresentados sofreu incremento significativo sempre que foi introduzida no esquema de classificação essa informação determinante para a ecologia e ocorrência da espécie (altitude e distância
1 Recebido em 14.12.2012 aceito para publicação em 14.04.2014.
2 Azorean Biodiversity Group, Department of Biology, University of the Azores, Ponta Delgada, Portugal. E-mail: <arturgil@uac.pt>. 3 Department of Geosciences, University of Massachusetts, USA. E-mail: <qyu@geo.umass.edu>.
4 Véodis-3D, France. E-mail: <mohamed.abadi@veodis-3d.com>.
a linhas de água). Os resultados indicaram que o uso das bandas espectrais VNIR do sensor ASTER associadas à informação geográfica relevante para a distribuição espacial da espécie pode constituir uma solução de baixo custo e boa eficiência para a avaliação e monitoramento contínuos da distribuição e propagação de Pittosporum undulatum nas Áreas Protegidas dos Açores.
Palavras-chave: Sensoriamento remoto; Espécies invasoras; Pittosporum undulatum.
1. INTRODUCTION
Invasive Alien Species (IAS) is a large, if not the largest, threat to conservation. It is generally accepted that IAS management is a significant issue for Protected Areas management in such ecosystems (MEYERSON; REASER, 2003; REASER et al., 2007; GUTIERRES et al., 2011). Biological invasions are one of the most important problems faced by island ecosystems, due to the peculiarities of the native island fauna and flora (OLESEN et al., 2002). Invasive plants are considered as one of the major threats to biodiversity conservation in islands, including the Macaronesian Archipelagos where they invade many protected areas (SILVA et al., 2008; KUEFFER et al., 2010; CASTRO et al., 2010; CRUZ et al., 2011). The vascular plant flora in the island of S. Miguel (Archipelago of the Azores, Portugal) consists of approximately 1000 taxa and is largely dominated by non-indigenous taxa (66%). Recent invasion by several species (Pittosporum undulatum, Clethra arborea and Hedychium gardneranum) suggests that the remaining undisturbed native vegetation may be overrun by non-indigenous species (SILVA; SMITH, 2004, 2006). Pittosporum undulatum is an invader in tropical and subtropical mountain forests, in warm temperate regions of the Northern Hemisphere, in many islands, and in South Africa (GLEADOW; ASHTON, 1981; MANDERS; RICHARDSON, 1992). It has also invaded plant communities in its native country, Australia (ROSE, 1997; ROSE; FAIRWEATHER, 1997). Pittosporum undulatum is already the dominant woody species in the Azores. According to a recent evaluation of the Top 100 invasive species in Macaronesia, this species is also considered invasive in Madeira and the Canary islands, and ranked 8th in a total of 195 evaluated species (SILVA et al., 2008). Introduced in the Azores in the 19th century as a hedgerow species for the protection of orange tree plantations, Pittosporum undulatum
has spread during the last 100 years to a wide range of habitats throughout the Azores islands, disturbing plant communities at elevations of 100 to 600 m. It overgrows native vegetation, forming pure stands (SJOGREN, 1973). Pittosporum undulatum in S. Miguel
is limited by the most important climatic gradient on the island: the steep topography of the island originates a striking altitudinal gradient, where small increases in elevation are followed by important decreases in temperature and increases in precipitation and humidity (HORTAL et al., 2010). The existence of available habitats (areas cleared of native forest, abandoned land, bare soil and landslide areas) is one of the factors which may explain the success of Pittosporum undulatum
in the Azores (LOURENÇO et al., 2011). Therefore, distance to water streams, as a specific and relevant disturbance factor in the vegetation’s spatial distribution at Pico da Vara Natural Reserve (due mostly to hydrological regime and slope) (GIL, 2005) shall also be considered as a relevant landform factor for Pittosporum undulatum
occurrence in this Protected Area.
Invasive species’ mapping is critical to obtain current states of vegetation cover in order to initiate vegetation protection and restoration programs (HE et al., 2005). Once IAS have become established in a region, remote sensing, in comparison to field based techniques, allows an entire region to be simultaneously mapped. Image-derived locations of IAS provide a permanent record that can be input into spatial databases for control activities, and repeated acquisitions allow trends in IAS abundance and distribution patterns to be efficiently monitored over time. In contrast, in areas where an IAS does not yet occur, prevention is the most efficient way of dealing with problematic species (STRAND et al., 2007). In small islands with very sensitive ecosystems as the Azores Islands, an accurate land cover and vegetation mapping and registering of its evolution (change detection and assessment) is mandatory for a more reliable and effective land planning and management (GIL et al., 2012).
archives, and the opportunity for automated image processing. The supervised image classification process is generally guided by expert to give the desired land-cover/vegetation classes. First, training samples which are representative and typical for that information class are defined, and secondly all input pixels (or segments) are labeled according to their class (LENKA; MILAN, 2005; XIE et al., 2008; MELLO et al., 2012). In the k-nearest-neighbors (KNN) classifier, a test pattern is classified as belonging to the class that is most frequent among the k nearest training patterns. The parameter k is a positive integer (DUDA et al., 2000; BISHOP, 2007).
The support vector machine (SVM) has been used as a classifier of remotely sensed data. This approach seeks to find the optimal separating hyperplane between classes by focusing on the training cases that lie at the edge of class distributions, support vectors, with the other training cases effectively discarded. Thus, yielding high accuracy with small training sets may be expected, which could be a very advantageous feature given the costs of training data acquisition in remote sensing (BROWN et al., 2000; FOODY; MATHUR, 2004).
Maximum-Likelihood Classifier (MLC) is usually regarded as the classic and most widely used supervised classification for satellite images resting on the statistical distribution pattern (SOHN; REBELLO, 2002; XU et al., 2005). At a medium spatial and spectral resolution, Landsat TM and SPOT imagery have been successfully used to map target weed species that are spectrally or temporally unique (ANDERSON; EVERITT, 1993; THENKABAIL, 1999; PETERSON, 2003; STRAND et al., 2007; MITCHELL; GLENN, 2009).
ASTER imagery has been used to obtain detailed maps of land surface, reflectance and elevation in the study of habitat patterns. Nevertheless, some applications on invasive vegetation mapping have been developed, most of them with little success (TUTTLE et al., 2006; GILLESPIE et al., 2008; XIE et al., 2008; HUANG; ASNER, 2009; VIANA; ARANHA, 2010). Two attempts of vegetation mapping (including Pittosporum woodland patches) at Pico da Vara Natural Reserve were performed by Gil et al. (2011, 2013) using very high spatial resolution remote sensing data (IKONOS images). Despite the poor separability of some relevant vegetation classes, these studies concluded that this type of satellite imagery could constitute a cost-effective solution to study and assess vegetation dynamics within Protected Areas of the Azores Islands.
This paper aims to assess the effectiveness of ASTER imagery to support the mapping of Pittosporum
woodland in Pico da Vara Natural Reserve (S. Miguel Island, Archipelago of the Azores, Portugal). This assessment was done by applying K-Nearest Neighbor (KNN), Support Vector Machine (SVM) and Maximum Likelihood (MLC) pixel-based supervised classifications to 4 different datasets constituted by the 9 ASTER multispectral bands coupled to GIS terrain data strongly related to Pittosporum woodland ecological distribution.
2. MATERIAL AND METHODS
2.1 Study area
The Special Protected Area (SPA) Pico da Vara/ Ribeira do Guilherme is located in the largest island in the Azores Archipelago, São Miguel. The SPA currently covers an area of 6,067 hectares. SPA was classified in 1999 and comprises one of the last main areas of “Native Scrubland” in S. Miguel, whose core is located in the Natural Reserve of Pico da Vara (815 hectares) in the mountain complex of “Serra da Tronqueira” (Fig. 1).
2.2. Data
Four different datasets were used in our study:
1) An ASTER-1A standard geometrically corrected image with nine multispectral bands (Visible, Near Infrared and Shortwave Infrared) acquired on April 24th, 2002 with 10% Cloud Cover. The Advanced Spaceborne Thermal Emission and Reflection Radiometer (ASTER) is a sensor launched on NASA’s Earth Observing System, on board of the TERRA satellite, in December 1999. ASTER is characterized by a medium spatial resolution (15–90 m) with 14 spectral bands (visible to near-infrared bands have a spatial resolution of 15 m; 30 m for short wave infrared bands and 90 m for thermal infrared bands).
2) The Digital Terrain Model (DTM) of S. Miguel Island with an equidistance of 10m between contour isolines, produced in GIS format by the Military Geographic Institute of Portugal (IGEOE) at a 1/25000 scale, used for the orthorectification of the ASTER-1A image and as ancillary GIS data (reclassification to hypsometry map);
4) A main GIS dataset of 561 test-sites (polygons) representing 4 main cover classes covering the Pico da Vara Natural Reserve’s whole area. All those are the result of a simultaneous photo-interpretation and cross-validation between available orthophotomaps (2 mosaics, the older one from 1997, the more recent produced in 2005), the Regional Forest Inventory (DRRF, 2007) and the vegetation monitoring program survey SPEA/LIFE Priolo Project, continuously developed between 2004 and 2008 (TEODOSIO et al., 2009).
Four representative land cover and vegetation classes are identified in this dataset: (1) CC - Cryptomeria japonica (L. fil.) D. Don (“Japanese cedar”) man-planted production forest stands; (2) DD – Bare Soil and Landslide Areas; (3) LL – Native scrubland patches; (4) NN – Pittosporum Woodland (Pittosporum undulatum’s pure or largely dominated patches). “Native scrubland” (LL) in the study region corresponds to areas dominated by native shrubs and trees alternating with small patches of herbaceous vegetation, including natural meadows and bogs. However, despite the name of this class, both herbaceous and woody invasive species are also present, mixed with the native elements, sometimes dominating the vegetation cover. Thus,
despite its name, this formation is clearly not a pristine community, revealing the impact of anthropogenic disturbance (GIL et al., 2013).
2.3. Methods
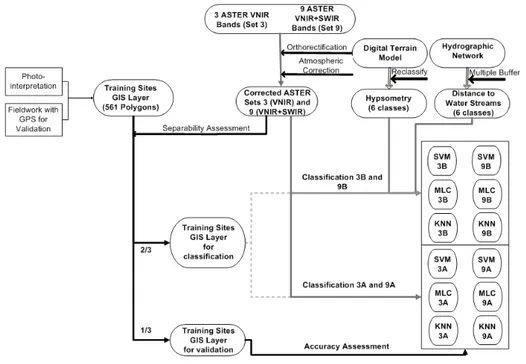
Our methodological proposal can be divided into 5 inter-dependent phases (Fig. 2). The first phase consisted of pre-processing ASTER-1A Visible, Near and Shortwave Infrared’s (VNIR-SWIR) spectral bands. In this phase, the orthorectification of the 9 ASTER-1A VNIR-SWIR spectral bands was performed using the Digital Terrain Model (DTM) of S. Miguel Island (HALE; ROCK, 2003), followed by the atmospheric correction of these same bands using the QUick Atmospheric Correction (QUAC) algorithm for VNIR-SWIR multispectral imagery (HADJIMITSIS et al., 2004; BERNSTEIN et al., 2005).
The second phase had, as main goal, the geoprocessing of GIS terrain data for classification-scheme integration (SENOO et al., 1990; MASELLI et al., 2000). First, the Digital Terrain Model (DTM) was reclassified into a 6 class’s hypsometry raster dataset according to “Sweet Pittosporum” spatial distribution range in Pico da Vara Nature Reserve Figure 1 – Location of Pico da Vara Natural Reserve (S. Miguel Island, Portugal).
(meters): 330-450; 450-600; 600-750; 750-900; 900-1050; 1050-1103. Second, a multiple buffer using the Hydrographic Network GIS layer was created (6 classes of distance from water stream margins, in meters): < 5; 5-25; 25-55; 55-105; 105-155; >155. This vector layer was converted into a raster dataset with a spatial resolution of 15 meters (same as ASTER VNIR spectral bands). Finally, the training datasets were randomly divided into two subsets, 2/3 for training, and 1/3 for test.
During the third phase, the separability between land-cover classes was assessed before classification, using both the 3 VNIR band and the 9 VNIR-SWIR band images. Transformed Divergence (TD) values were calculated with training data. As a general rule, if the TD value is greater than 1900, then classes have good separability; between 1700 and 1900, the classes are separable; below 1700, the separability is poor (LILLESAND; KIEFER, 2000).
The fourth phase consisted of performing three different pixel-based supervised classifications by applying KNN, SVM and MLC algorithms to each of our four datasets:
1) Dataset 3A: ASTER’s 3 VNIR ortho-rectified and atmospherically corrected bands (3 features in total);
2) Dataset 3B: ASTER’s 3 VNIR ortho-rectified and atmospherically corrected bands + Hypsometry raster layer + “Distance to water streams” raster layer (5 features in total);
3) Dataset 9A: ASTER’s 9 VNIR-SWIR ortho-rectified and atmospherically corrected bands (9 features in total);
4) Dataset 9B: ASTER’s 9 VNIR-SWIR ortho-rectified and atmospherically corrected bands + Hypsometry raster layer + “Distance to water streams” raster layer (11 features in total).
Finally, the fifth phase of our methodological approach consisted of assessing the accuracy of the 12 outputted classification maps by computing overall and “class by class” user accuracy, producer accuracy and overall Kappa coefficient, using the validation set, which was previously randomly extracted from the main GIS dataset (with 1/3 of its training sites) representing the 4 main cover classes covering the Pico da Vara Natural Reserve’s whole area (CONGALTON; GREEN, 1999; FOODY, 2002; PONZONI; REZENDE, 2002).
Figure 2 – Methodological flowchart.
3. RESULTS
Table 1 summarizes the results of the separability assessment.
Regarding the four land cover/vegetation categories described above (CC, DD, LL, NN), the separability was fairly good or very good in all pairwise combinations, except for the case of Cryptomeria japonica (CC) vs.
Pittosporum woodland (NN) when using just the 3 VNIR band dataset, with a Transformed Divergence value slightly lower than 1700 (TD = 1653). The lower separation between these two classes using just 3 VNIR bands can be explained by the fact that Pittosporum
woodland is usually dense, homogeneous (as
Cryptomeria japonica) and mostly composed of evergreen trees and large shrubs.
Three supervised classification techniques (SVM, MLC and KNN) were applied to the 3A, 3B, 9A and 9B’s ASTER datasets. In order to effectively assess
the accuracy of these 12 classifications maps, User Accuracy (0-1) and Producer Accuracy (0-1) were calculated for each map category. Overall KIA (Kappa Index of Agreement) and Overall Accuracy (0-1) were also calculated for each classifier applied to each dataset (Table 2).
Overall, almost all performed classifications showed a strong agreement and good accuracy (Overall KIA > 0.8) except for the 3A dataset’s MLC classification, which was slightly less accurate (Overall KIA = 0.78). The best overall classifications were obtained applying MLC (Overall KIA = 0.92) and KNN (Overall KIA = 0.91) to the 3B dataset (VNIR bands + 2 GIS raster layers); and by applying both classifiers KNN and SVM (Overall KIA = 0.90) to the 9B dataset (VNIR-SWIR bands + 2 GIS raster layers). SVM showed the same accuracy when applied to the 9A dataset (Overall KIA = 0.90). KNN was the most accurate classifier when applied to the 3A dataset, while SVM was the best
Table 2 – Accuracy assessment of performed classification.
Tabela 2 – Avaliação da precisão das classificações efetuadas.
Note: P - Producer accuracy (0-1); U - User accuracy (0-1); CC - Cryptomeria japonica; DD – Bare soil and Landslide areas; LL – Native scrubland patches; and NN – Pittosporum Woodland.
Nota: P: Precisão do produtor (0-1); U - Precisão do utilizador (0-1); CC - Cryptomeria japonica; DD – Áreas de solo nu ou sujeitas a movimentos de terra ; LL – Matos nativos; e NN – Bosque de Pittosporum undulatum.
Se t 3A 3B 9A 9B
MLC KNN SVM MLC KNN SVM MLC KNN SVM MLC KNN SVM
C C 0,72 0,72 0,65 0,95 0,93 0,65 0,81 0,84 0,87 0,90 0,94 0,87
(P|U) 0,47 0,86 0,85 0,87 0,90 0,86 0,82 0,82 0,84 0,88 0,92 0,85
DD 0,94 0,99 1,0 0,92 0,96 1,00 0,92 0,94 0,96 0,94 0,95 0,96
(P|U) 0,99 0,91 0,98 0,93 0,84 0,98 0,82 0,78 0,97 0,74 0,75 0,96
LL 0,99 0,96 0,99 0,96 0,95 0,99 0,90 0,92 0,98 0,88 0,92 0,98
(P|U) 0,96 0,99 0,98 0,96 0,97 0,98 0,97 0,98 0,97 0,98 0,98 0,97
NN 0,69 0,88 0,87 0,93 0,94 0,87 0,91 0,90 0,90 0,97 0,97 0,91
(P|U) 0,85 0,74 0,66 0,96 0,96 0,66 0,81 0,86 0,91 0,89 0,94 0,91
Overall 0,78 0,84 0,82 0,92 0,91 0,83 0,83 0,85 0,90 0,86 0,90 0,90
KIA
Overall 0,85 0,89 0,88 0,94 0,94 0,88 0,88 0,90 0,93 0,91 0,93 0,93
Accuracy
Table 1 – Separability assessment of VNIR and VNIR-SWIR sets.
Tabela 1 – Avaliação da separabilidade nos conjuntos de bandas VNIR e VNIR-SWIR.
Note: P - Producer accuracy (0-1); U - User accuracy (0-1); CC - Cryptomeria japonica; DD – Bare soil and Landslide areas; LL – Native scrubland patches; and NN – Pittosporum Woodland.
Nota: P - Precisão do produtor (0-1); U - Precisão do utilizador (0-1); CC - Cryptomeria japonica; DD – Áreas de solo nu ou sujeitas a movimentos de terra; LL – Matos nativos; e NN – Bosque de Pittosporum undulatum.
Based on 3 VNIR features Based on 9 VNIR-SWIR features
CC DD LL NN CC DD LL NN
C C - 2000 1995 1653 - 2000 1950 1767
DD 2000 - 1711 2000 2000 - 1729 2000
LL 1995 1711 - 1989 1950 1729 - 1936
-to classify both 9A and 9B datasets (this last one with the same results of KNN). MLC only performed better when classifying the 3B dataset. Although none of these classifiers can be unquestionably assumed as the best one, KNN (K=3) showed more constancy overall.
4. DISCUSSION
The integration of ancillary GIS terrain data (variables that are strongly related to the spatial distribution of
Pittosporum undulatum, including altitude and distance to water streams) as additional features has improved the accuracy of classifications. Both tests (using ASTER’s VNIR and VNIR-SWIR datasets) were successful, as shown especially by the important increase in accuracy from 3A to 3B (difference between 9A and 9B datasets is quite lower). Thus, the VNIR dataset (3 multispectral bands) benefitted more than the VNIR-SWIR dataset (9 multispectral bands) from the use of this technique, especially when using the MLC classifier. SVM seemed to be the only classifier that didn’t improve by adding those ancillary GIS layers into the classification scheme.
At the land cover/vegetation class level, mapping
Cryptomeria japonica forest stands (CC) was more accurate when applying KNN to datasets that include the ancillary GIS terrain data (3B’s user accuracy = 0.90 and 9B’s user accuracy = 0.92). Almost all CC’s user accuracy (UA) values were high (>0.80) except the one performed by applying MLC to the 3A dataset (UA=0.47). Due to logistical issues (accessibility for plantation, management, harvesting and transportation) and a suitability concern during plantation, the location of these forest stands was strongly dependent on topographical factors like altitude and distance to water streams.
Mapping Landslide and Bare Soil areas (DD) proved to be highly accurate by using each of the 4 datasets (0.96<UA<0.98). Therefore, the addition of GIS raster bands (datasets 3B and 9B) in the classification scheme didn’t have much room to improve the accuracy of mapping this land cover category and it rather degraded the accuracy by introducing, in the classification, information irrelevant to the distribution of DD. SVM classifier was particularly and constantly effective regarding this category, reaching UA’s higher than 0.96 in all cases. The use of the VNIR-SWIR’s ASTER datasets (9A and 9B) proved to be less effective to map DD than just using the VNIR’s ASTER datasets (3A and 3B). In the same circumstance as DD, mapping
native scrubland patches (LL) was highly accurate when applying each of the classifiers to each of the 4 datasets (0.96<UA<0.99). The integration of ancillary GIS data to the classification schema didn’t positively affect the accuracy.
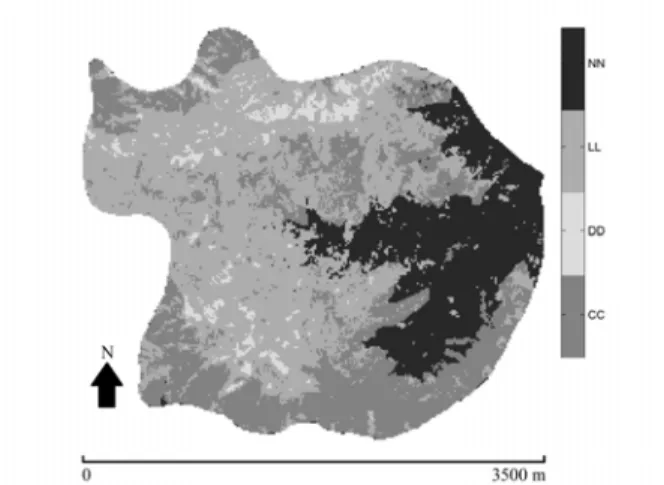
The main goal of this study, mapping the spatial distribution of Pittosporum woodland across Pico da Vara Natural Reserve, was achieved with satisfactory accuracy. Mapping Pittosporum woodland’s distribution was more accurate (Figure 3) when applying MLC to the 3B dataset (UA=0.96) and KNN to both datasets that include the ancillary GIS data (3B’s user accuracy = 0.96 and 9B’s user accuracy = 0.94). The application of SVM to the 9A dataset (UA=0.91) was very accurate as well. Applying SVM to both VNIR datasets (3A and 3B) produced the least accurate classifications (UA=0.66).
These results reinforced two facts about the classification accuracy of Pittosporum woodland: (1) it can be significantly improved by including, in the classification scheme, ancillary GIS data directly related to its ecology and spatial distribution (like altitude and distance to water streams, in this case-study); (2) the integration of GIS ancillary data was more effective than the use of additional SWIR multispectral bands.
Figure 3 – ASTER classification map obtained by applying MLC to dataset 3B (Caption: CC - Cryptomeria japonica; DD – Bare soil and landslide areas; LL – Native scrubland patches; and NN – Pittosporum Woodland).
Actually, the two highly accurate classifications (UA = 0.96) were obtained when using the 3B dataset (without SWIR multispectral bands). Therefore, a more accurate knowledge about Pittosporum undulatum location and extension in Pico da Vara Natural Reserve will allow policy-makers and site manager to perform a more adequate and realistic Pittosporum undulatum control and management in this Protected Area.
5. CONCLUSIONS
The results have shown that using ASTER multispectral imagery for Pittosporum woodland mapping in Pico da Vara Natural Reserve can constitute an effective and low-cost solution for continuous monitoring of the species’ spread in this protected area. The separability issue (TD slightly lower than 1700) between
Pittosporum undulatum patches(NN)and Cryptomeria japonica (CC) forest stands could be improved by increasing the quantity and quality of training sites for both categories, by using, as part of the training dataset, for instance the Regional Forest Inventory, which is focused on CC mapping and characterization. A high accuracy in supervised classification maps has been reached (especially when using MLC and KNN classifiers) by developing a classification scheme which includes the use of both VNIR and VNIR-SWIR ASTER datasets coupled to relevant ancillary GIS data (converted to raster bands) representing variables that are dictating and conditioning Pittosporum undulatum spatial distribution, like altitude and “distance to water streams”. ASTER VNIR bands at a spatial resolution of 15 meters (225 m² as minimal spatial unit), are appropriate for decision-support on IAS site-specific management, as the minimum unit defined for IAS management in Azorean Protected Areas is one hectare. Therefore, these results will support regional authorities to perform a more cost-effective Pittosporum woodland management in Pico da Vara Natural Reserve. As the ASTER SWIR detectors no longer function since April 2008, these results (as datasets 3A and 3B tested) also show that the use of currently available VNIR spectral bands, when coupled to relevant ancillary GIS data, can be sufficiently effective for the mapping purpose in the IAS regional monitoring and management programs (addressing protected areas, basins and lakes, coastal areas). Finally, this new and more detailed data on the spatial distribution of Pittosporum undulatum will allow more accurate ecological modeling studies of this IAS in the Azores.
6. AKNOWLEDGEMENTS
This research has been developed on the behalf of a Post-Doctoral Research Project (M3.1.7/F/005/ 2011) supported by the FRC - Regional Fund for Science (Azorean Regional Government). We would like to thank SPEA Azores staff for sharing their vegetation monitoring program survey data regarding Pico da Vara / Ribeira do Guilherme Special Protected Area. We would like also to thank Mr. António Moniz for his cartographic support (Figure 1). Finally, we are thankful to NASA/ USGS for providing us the ASTER data used in this research project.
7. REFERENCES
ANDERSON, G. L.; EVERITT, J. H. Using satellite data to map false broomweed (Ericameria
austrotexana) infestations on south Texas rangelands.
Weed Technology, v.7, p.865-871, 1993.
BERNSTEIN, L. S. et al. Validation of the QUick Atmospheric Correction (QUAC) algorithm for VNIR-SWIR multi- and hyperspectral imagery.
SPIE Proceeding Algorithms and Technologies for Multispectral, Hyperspectral and Ultraspectral Imagery XI, v. 5806, p. 668-678, 2005.
BISHOP, C. M. Pattern recognition and machine learning. New York: Springer, 2007.
BROWN, M. et al. Linear spectral mixture models and support vector machines for remote s e n s i n g . IEEE Transactions on
Geoscience and Remote Sensing, v. 3 8 ,
p.2346-2360, 2000.
CASTRO, S. A. et al. Floristic homogenization as a teleconnected trend in oceanic islands.
Diversity and Distributions, doi:10.1111/ j.1472-4642.2010.00695.x, 2010.
CONGALTON, R.; GREEN, K. Assessing the accuracy of remotely sensed data:
principles and practices. Boca Raton: CRC/Lewis Press, 1999.
CRUZ, A. et al. Socio-economic Benefits of Natura 2000 in Azores Islands – a case study approach on the ecosystem services provided by a Special Protected Area. Journal of Coastal
DRRF. Inventário Florestal da Região
Autónoma dos Açores (Azores Regional
Forest Inventory). Ponta Delgada: Direcção Regional dos Recursos Florestais /Secretaria Regional da Agricultura e Florestas da Região Autónoma dos Açores, 2007.
DUDA, R. et al. Pattern classification. 2.ed. New York: John Wiley & Sons, 2000.
FOODY, G. M.; MATHUR, A. A relative evaluation of multiclass image classification by support vector machines. IEEE Transactions on
Geoscience and Remote Sensing, v.42,
p.1336-1343, 2004.
FOODY, G. M. Status of land cover classification accuracy assessment. Remote Sensing of
Environment, v.80, p.185-201, 2002.
GIL, A. et al. Mapping invasive woody plants in Azores Protected Areas by using very high-resolution multispectral imagery. European Journal of Remote Sensing, v.46, p.289-304, 2013.
GIL, A. et al. Linking GMES Space Component to the development of land policies in Outermost Regions - the Azores (Portugal) case-study.
European Journal of Remote Sensing,
v.45, p.263-281, 2012.
GIL, A. et al. Assessing the effectiveness of high resolution satellite imagery for vegetation
mapping in small islands protected areas.
Journal of Coastal Research, v. SI 64,
p.1663-1667, 2011.
GIL, A. Pico da Vara/Ribeira do Guilherme Special Protected Area
Management Plan. Lisboa: SPEA, 2005.
GILLESPIE, T. W. et al. Measuring and modeling biodiversity from space. Progress in
Physical Geography, v.32, p.203-221, 2008.
GLEADOW, R. M.; ASHTON, D. H. Invasion by Pittosporum undulatum of the forests of Central Victoria. Australian Journal of Botany, v.29, p.705-720, 1981.
GUTIERRES, F. et al. Acacia saligna (Labill.) H. Wendl in the Sesimbra Council: Invaded habitats and potential distribution modelling. Journal of Coastal Research, v.SI 64, p.403-407, 2011.
HADJIMITSIS, D. G. et al. An assessment of the effectiveness of atmospheric correction algorithms through the remote sensing of some reservoirs.
International Journal of Remote Sensing, v.25, p.3651-3674, 2004.
HALE, S. R.; ROCK, B. N. Impacts of topographic normalization on land-cover classification
accuracy. Photogrammetric Engineering & Remote Sensing, v.69, p.785-792, 2003.
HE, C. et al. Zoning grassland protection area using remote sensing and cellular automata modeling - A case study in Xilingol steppe grassland in northern China. Journal of Arid
Environment, v.63, p.814-826, 2005.
HORTAL, J. et al. Assessing the areas under risk of invasion within islands through potential distribution modelling: the case of Pittosporum undulatum in São Miguel, Azores.
Journal for Nature Conservation,
v.18, p.247-257, 2010.
HUANG, C.; ASNER, G.P. Applications of remote sensing to alien invasive plant studies. Sensors, v.9, p.4869-4889, 2009.
KUEFFER, C. et al. Magnitude and form of invasive plant impacts on oceanic islands: a global comparison. Perspectives in Plant
Ecology, Evolution and Systematics,
v.12, p.145-161, 2010.
LENKA, C.; MILAN, C. Supervised classification of plant communities with artificial neural
networks. Journal of Vegetation Science, v.16, p.407-414, 2005.
LILLESAND, T. M.; KIEFER, R. W. Remote
sensing and image interpretation. New
York: John Wiley & Sons, 2000.
LOURENÇO, P. et al. Distribution habitat and biomass of Pittosporum undulatum, the most important woody plant invader in the Azores Archipelago. Forest Ecology and Management, v.262, p.178-187, 2011.
MASELLI, F. et al. Classification of mediterranean vegetation by TM and ancillary data for the evaluation of fire risk. International Journal
of Remote Sensing, v.21, p.3303-3313, 2000.
MELLO, A. Y. I. et al. Avaliação de técnicas de classificação digital de imagens landsat em diferentes padrões de cobertura da terra em Rondônia.
Revista Árvore, v.36, n.3, p.537-547, 2012.
MEYERSON, L. A.; REASER, J. K. The
ecological and socio-economic impacts of invasive alien species on island ecosystems: Results of an experts consultation. Washington DC: The Global Invasive Species Programme (GISP), 2003.
MITCHELL, J.; GLENN, N. F. Leafy spurge (Euphorbia esula L.) classification performance using hyperspectral and multispectral sensors.
Rangeland Ecology & Management,
v.62, p.16-27, 2009.
OLESEN, J. M. et al. Invasion of pollination networks on oceanic islands: Importance of invader complexes and endemic super generalists. Diversity and
Distributions, v.8, p.181-192, 2002.
PETERSON, E. B. Mapping percent-cover of
the invasive species bromus tectorum (Cheatgrass) over a Large Portion of
Nevada from Satellite Imagery. Nevada
Natural Heritage Program. Nevada: Department of Conservation and Natural Resources, 2003.
PONZONI, F. J.; REZENDE, A. C. P. Influência da resolução espacial de imagens orbitais na
identificação de elementos da paisagem em Altamira-PA. Revista Árvore, v.26, n.4, p.403-410, 2002.
REASER, J. K. et al. Ecological and
socioeconomic impacts of invasive alien species in island ecosystems. Environmental
Conservation, v.34, p.98-111, 2007.
ROSE, S. Integrating management of Pittosporum undulatum with other environmental weeds in Sidney’s urban bushland. Pacific
Conservation Biology, v.3, p.350-365, 1997.
ROSE, S.; FAIRWEATHER, P. G. Changes in floristic composition of urban bushland invaded by Pittosporum undulatum in Northern Sydney, Australia. Australian Journal of Botany, v.45, p.123-149, 1997.
SENOO, T. et al. Improvement of forest type classification by SPOT HRV with 20m mesh DTM.
International Journal of Remote Sensing, v.11, p.1011-1022, 1990.
SILVA, L. et al. Invasive terrestrial flora and fauna of Macaronesia - Top 100
in Azores, Madeira and Canaries. Ponta
Delgada: ARENA, 2008.
SILVA, L.; SMITH, C. W. A quantitative approach to the study of non-indigenous plants: an example from the Azores Archipelago. Biodiversity Conservation, v.15, p.1661-1679, 2006.
SILVA, L.; SMITH, C. A characterization of the non-indigenous flora of the Azores Archipelago.
Biological Invasions, v.6, p.193-204, 2004.
SJOGREN, E. Recent changes in the vascular flora and vegetation of the Azores Islands.
Memórias da Sociedade Broteriana,
v.22, p.1-113, 1973.
SOHN, Y.; REBELLO, N. S. Supervised and unsupervised spectral angle classifiers.
Photogrammetric Engineering & Remote Sensing, v.68, p.1271-1280, 2002.
STRAND, H. et al. Sourcebook on remote
sensing and biodiversity indicators.
Montreal: Secretariat of the Convention on Biological Diversity, 2007.
TEODOSIO, J. et al. Species action plan for the Azores Bulfinch Pyrrhula murina
in the European Union. Lisbon: SPEA,
2009.
THENKABAIL, S. P. Characterization of the alternative to slash-and-burn benchmark research area representing the Congolese rainforests of Africa using near-real-time SPOT HRV data.
International Journal of Remote Sensing, v.20, p.839-877, 1999.
TUTTLE, E. M. et al. Using remote sensing image texture to study habitat use patterns: a case study using the polymorphic white-throated sparrow (Zonotrichia albicollis).
Global Ecology and Biogeography,
VIANA, H.; ARANHA, J. Mapping invasive species (Acacia dealbata Link) using ASTER/ TERRA and LANDSAT 7 ETM+ imagery. In: IUFRO LANDSCAPE ECOLOGY WORKING GROUP INTERNATIONAL CONFERENCE, 2010, Bragança. Proceedings. IUFRO / Instituto Politécnico de Bragança, 2010. p.443-448.
XIE, Y. et al. Remote sensing imagery in vegetation mapping: a review. Journal of
Plant Ecology, v.1, p.9-23, 2008.