Article
J. Braz. Chem. Soc., Vol. 28, No. 4, 529-539, 2017. Printed in Brazil - ©2017 Sociedade Brasileira de Química 0103 - 5053 $6.00+0.00
*e-mail: [email protected]
A Sensitive Voltammetric Determination of Anti-Parkinson Drug Pramipexole Using
Titanium Dioxide Nanoparticles Modified Carbon Paste Electrode
Seyed Karim Hassaninejad-Darzi* and Farshad Shajie
Research Laboratory of Analytical & Organic Chemistry, Department of Chemistry, Faculty of Science, Babol University of Technology, P.O.Box 47148-71167 Babol, Iran
In this study, a facile sensor based on TiO2 nanoparticles modified carbon paste electrode
was developed for voltammetric determination of pramipexole in pharmaceutical formulations and biological samples. Surface of the fabricated electrode have been characterized using field emission scanning electron microscopy. Under the optimized experimental conditions, the modified electrode was exhibited excellent electrocatalytic activities and a sensitive oxidation peak at 0.9 V in the phosphate solution of pH 5.0 for electrooxidation of pramipexole. The plot of pH vs. Ep
generated a slope of 62.5 mV per pH in the pH range of 3.0-13.0 indicating the contribution of an equal number of electrons and protons in the electrode process. A differential pulse voltammetry method was developed in the concentration range of 0.46-100 µmol L−1 with a limit of detection
of 0.14 µmol L−1. The proposed method is simple, rapid, and inexpensive and also showed good
selectivity and sensitivity toward pramipexole.
Keywords: pramipexole, TiO2 nanoparticles, modified CPE, differential pulse voltammetry,
electroanalysis
Introduction
Parkinson’s disease is a common neurodegenerative disorder disease; it affects few parts of the brain which controls vital muscle movement. Pramipexole dihydrochloride monohydrate (PRX) is a widely preferred drug for the treatment of Parkinson’s disease, since it has a direct activity on the central nervous system.1 PRX,
chemically known as (6S )-N6-propyl-4,5,6,7-tetrahydro-1,3-benzothiazole-2,6-diamine, is a dopaminergic agonist drug and the chemical structure is shown in Scheme 1. It has the capability to excite dopamine receptors in the striatum and is used for the treatment of depressive syndromes.2,3
Since 1997, the US government has approved the PRX
drug to treat Parkinson’s disease; the healing importance of PRX has made researchers to develop sensitive, selective, reliable and rapid analytical methods.
There are many methods currently available for the determination of PRX such as UV-Vis spectrophotometry,4
high-performance liquid chromatography (HPLC) with ultraviolet and electrochemical detection,5
high-performance liquid chromatography-mass spectrometry (HPLC-MS),6 HPLC with Monte Carlo
simulations,7 spectrophotometry method based on the
diazotization of primary amine group of pramipexole,8 gas
chromatography mass spectrometry (GC-MS),9 thin layer
chromatography10 and capilary electrophoresis with laser
induced fluorescence detection.11 Furthermore, the above
mentioned methods such as chromatographic methods require expensive instruments, organic solvents, reagents for the extraction and often time-consuming and hence, sensitive, reliable, and simple analytical methods were required to determine PRX.12
In the field of analytical chemistry, electrochemical methods have been widely attracted due to higher reliability, simplicity, rapid detection, high sensitivity and possibility of miniaturization.13 Metal nanoparticles are
bulk metal electrodes.14 The unique chemical and physical
properties of nanoparticles make them extremely suitable for designing and improving sensing devices, especially electrochemical and biosensors. Different kinds of nanomaterials, such as metals, metal oxides, carbon based materials and semiconductor nanoparticles, have been used for constructing electrochemical sensors and biosensors.15
TiO2 nanoparticles have excellent chemical and physical
properties; they have been used in the sensor preparation, coating, solar cell, and photocatalyst applications.16,17
These nanoparticles have been incorporated with other compounds, such as graphite and carbon nanotubes, to make modified electrodes in the electrochemical analysis of some biological compounds,18-22 because they provide
more active sites at the surface of the electrode. TiO2
nanoparticles can be used in wide potential windows and improve the stability of the electrode, therefore, increase the repeatability of the electrode response. The carbon paste electrodes (CPEs) are very popular due to their wide anodic potential range, low residual current, ease of fabrication, easy renewal and low cost.23
Up-to-date, no voltammetric procedure was described using a carbon paste electrode modified with TiO2
nanoparticles for the quantification of PRX drug in the pharmaceutical or biological samples. In the present study, we fabricated a new sensor based on TiO2 nanoparticles
modified carbon paste electrode (TiO2NPs/CPE) for the
electrochemical determination of PRX.
Experimental
Reagents and materials
All utilized materials were of analytical reagent grade and used as purchased, without further purification and all solutions were prepared freshly with deionized water. Pramipexole dihydrochloride monohydrate (> 95% purity) and TiO2 nanoparticle (nanoparticles ca. 21 nm, > 99.5%)
were purchased from Sigma-Aldrich (St. Louis, MO, USA). Two series of pramipexole tablet containing different doses (0.35 and/or 0.7 mg) were obtained from Dr. Abidi pharmaceutical company (Tehran, Iran). Graphite powder and paraffin oil (d = 0.88 g cm−3) as the binding agent (both
from Daejung company, Shiheung, Korea) were used for preparing the paste. The biological samples used in this work were obtained from Blood Transfusion Organization (Babol, Iran). Potassium chloride from Fluka (Buchs, Switzerland) was used as the supporting electrolyte. Potassium ferricyanide (K4Fe(CN)6) was purchased from
Merck company (Merck, Darmstadt, Germany) and used as the standard redox system.
Apparatus
The morphology of the modified electrode (TiO2NPs/CPE)
was obtained using field emission scanning electron microscopy (FESEM) on a MIRA 3 XM TESCAN instrument with the operation of 5.0 kV. A digital pH meter (Hana, USA) was used to read the pH of the solutions. The electrochemical experiments were performed at room temperature using potentiostat/galvanostat electrochemical analyzer (SAMA500, Iran) with a voltammetry cell in a three electrodes configuration. The platinum wire and Ag|AgCl|KCl (3 mol L−1) were used as auxiliary and
reference electrodes, respectively. The bare CPE and TiO2
nanoparticles modified CPE (TiO2NPs/CPE) were used as
the working electrodes.
Preparation of the working electrode
In a typical electrode preparation, diethyl ether was added to a mixture of 0.03 g TiO2NPs and 0.17 g of graphite
powder. After hand mixing with a mortar and pestle, the solvent was evaporated with stirring. Then, paraffin oil (35 wt.%) was blended with the mixture in a mortar by hand mixing for 30 min until a uniformly wetted paste was obtained. This paste was packed into the end of a glass tube (ca. 0.35 cm i.d. and 10 cm long) and the copper wire was utilized for electrical contact. A new surface was achieved by pushing an excess of the paste out of the tube and polishing with a weighing paper. For comparison, bare CPE was also prepared in the same way in the absence of TiO2NPs.
Analytical procedure
A series of phosphate solutions (0.1 mol L−1) in the pH
range of 3.0-13.0 were prepared by mixing stock solutions of 0.1 mol L−1 H
3PO4, KH2PO4, K2HPO4 and K3PO4,
and used as supporting electrolytes. A stock solution of 1.0 × 10⁻² mol L−1 pramipexole was prepared daily by
dissolving 0.1056 g pramipexole in 50 mL water and then stored at 4 °C. Standard solutions were prepared using this stock solution by accurate dilution with water in the proposed concentration range (0.46-100 µmol L−1). The
working solutions were prepared by mixing appropriate volume of stock solution, phosphate solutions and 1 M KCl as supporting electrolyte. The differential pulse voltammograms (DPVs) were recorded by applying positive potential scan from 0.0-1.5 V vs. Ag|AgCl|KCl (3 mol L−1),
and pulse amplitude and scan increment of 50 and 25 mV s−1, respectively. All voltammetric measurements
Assay of the PRX in tablets
The contents of ten tablets were finely crushed with mortar and pestle to form a fine homogenous powder. Subsequently, a quantity equivalent to one tablet was collected and dissolved in a 100 mL volumetric flask with deionized water and sonicated for 15 min. The samples from the clear liquor were withdrawn and quantitatively diluted with the selected supporting electrolyte (0.1 mol L−1 phosphate solution, pH = 5.0).
The content of the drug in the tablet was determined by referring to the calibration graph or regression equation and recovery percentages were calculated to examine the accuracy of the proposed method.
Determination of PRX in human plasma samples
Serum samples obtained from healthy individuals (after having obtained their written consent) were stored frozen until use. For the assay of PRX in plasma, 500 µL PRX solution (10 µmol L−1) was added to 500 µL of untreated
plasma and the mixture was vortexed for 30 s. In order to precipitate the plasma proteins, the plasma samples were treated with 250 µL perchloric acid (15%) and then, the mixture was centrifuged at 6000 rpm for 10 min. An appropriate volume of the supernatant liquor was transferred into the voltammetric cell containing phosphate solution of pH 5.0 and DPVs were recorded. The content of the PRX in the plasma was measured referring to the calibration graph or regression equation.
Results and Discussion
Physical characterization of the modified electrode
The SEM image provides useful approach to the determination of size, morphology and surface of the modified electrode. Figures 1a and 1b show the scanning electron micrographs of CPE and TiO2NPs/CPE,
respectively. As can be seen on the surface of CPE, the layer of irregular flakes of graphite powder was present and isolated from each other. After addition of TiO2NPs
to the carbon paste, it can be seen that the spherical form of TiO2NPs with ca. 20-30 nm diameter was completely
distributed on the surface of the modified electrode, indicating that the TiO2NPs was successfully incorporated
into the CPE (see Figure 1b).
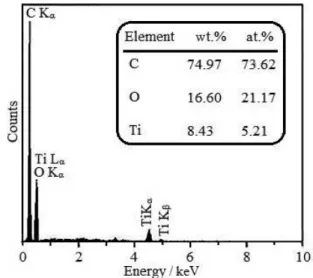
Figure 2 shows the energy dispersive X-ray spectroscopy (EDS) and elemental analysis of TiO2NPs/CPE electrode
surface. Observation of intensive peaks related to the electron transmissions of titanium, oxygen and carbon
demonstrates the presence of TiO2NPs on the surface and
between layers of graphite.
Electrochemistry of fabricated electrodes
Potassium ferricyanide (K4Fe(CN)6) was selected
as a probe to evaluate the performance of the fabricated bare CPE and TiO2NPs/CPE electrodes using cyclic
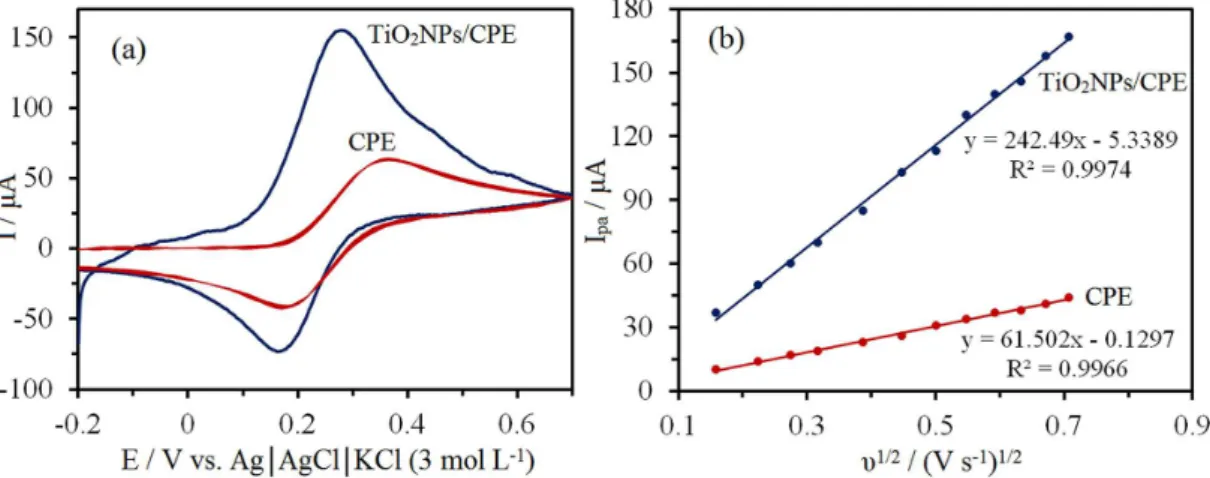
voltammetry (CV) technique. Figure 3a illustrates the typical CVs of the electrochemical oxidation of K4Fe(CN)6
at the surface of the bare CPE and TiO2NPs/CPE electrodes
in the 10 mmol L−1 of K
4Fe(CN)6 and 0.1 mol L−1 of KCl
solution. It is obvious that the electron transfer rate was sluggish, with a peak-to-peak separation (∆Ep) of 190 mV
at the CPE.
On the contrary, the TiO2NPs/CPE displayed a
well-shaped cyclic response for the Fe(CN)63/Fe(CN)64−
redox couple with a ∆Ep of 110 mV, indicating a
dramatic increase in the electron transfer rate due to the high conductivity of TiO2 nanoparticles. This is a
quasi-reversible system because ∆Ep is greater than 59 mV
that is expected for a reversible system. Therefore, the TiO2 nanoparticles in CPE could facilitate the electron
transfer rate between the electron surface and electroactive Figure 1. Representation of field emission scanning electron micrographs of (a) CPE and (b) TiO2NPs/CPE.
species. It is proposed that TiO2 nanoparticles present in
the carbon paste electrode not only acted as a binder to fill in the blanks of the carbon paste, but also formed a layer of titanium dioxide nanoparticles on the electrode surface. This effect was previously reported for determination of carbamazepine in the pharmaceutical samples onto Ag/TiO2 nanocomposite modified carbon paste electrode.24
The obtained result from CV of TiO2NPs/CPE in various
buffered solutions with different pH values does not show any shift in the anodic peak potentials for oxidation of K4Fe(CN)6 (data not shown). It can be concluded that the
electrochemical behavior of the Fe(CN)63−/Fe(CN)64− redox
couple in the TiO2NPs/CPE electrode is not dependent on
the pH of solution.
The active surface areas of the fabricated electrodes were calculated by the CV method at various scan rates using K4Fe(CN)6 as a probe. For this approach, the
Randles-Sevcik formula can be used:
(1)
where Ipa (A) refers to the anodic peak current, A (cm2)
is the active surface area of the electrode, C0 (mol cm−3)
is the concentration of K4Fe(CN)6, F is the Faraday’s
constant (96485 C mol−1), R is the universal gas constant
(8.314 J mol−1 K−1), T is the absolute temperature
(298 K), n is the electron transfer number, D (cm2 s−1)
is the diffusion coefficient and υ (V s-1) is the scan rate.
For 1.0 mmol L-1 K
4Fe(CN)6 in 0.1 mol L−1 KCl as
supporting electrolyte, the amount of n and D is 1 and 7.6 × 10⁻⁶ cm2 s−1, respectively.25,26 Figure 3b illustrates
the plot of Ipaversusυ1/2 for the oxidation of K4Fe(CN)6 on
the surface of bare CPE and TiO2NPs/CPE at various scan
rates. Linear relationship between the anodic or cathodic
peak currents and υ1/2 indicates a diffusion control process
at the surfaces of both electrodes. In this experiment, the slopes Ipaversusυ1/2 were 61.50 and 242.49 µA (V−1 s−1)1/2
for bare CPE and TiO2NPs/CPE, respectively. Therefore,
the active microscopic surface areas were found to be 0.084 and 0.390 cm2 for the bare CPE and TiO
2NPs/CPE,
respectively. These results indicated that modification of CPE with the TiO2 nanoparticles causes an increase in the
active surface area of the modified electrode.
Electrochemical behavior of PRX at TiO2NPs/CPE and
bare CPE
Inset in Figure 4 shows cyclic voltammograms of bare CPE and TiO2NPs/CPE in the absence of PRX in the
phosphate solution of pH 5.0 at the potential range from 0.0 to 1.4 V vs. Ag|AgCl|KCl (3 mol L−1) and potential
sweep rate of 25 mV s−1. As can be seen, no current can
be obtained with these electrodes. Figure 4 displays the cyclic voltammograms of 0.3 mmol L−1 PRX at bare CPE
and TiO2NPs/CPE in the phosphate solution of pH 5.0 at
the potential range from 0.0 to 1.4 V vs. Ag|AgCl|KCl (3 mol L−1) and potential sweep rate of 25 mV s−1. The PRX
exhibited a well-defined irreversible anodic peak at both TiO2NPs/CPE and bare CPE. The anodic voltammetric
signals can be ascribed to the oxidation of −NH group.27
The electroanalytical performance of TiO2NPs/CPE
was advantageous over that observed at the bare CPE. The cyclic voltammograms of PRX showed about 2.5 times enhancement in the oxidation peak current at TiO2NPs/CPE (165 µA) as compared to a bare CPE
(65 µA). The higher electrocatalytic behavior of the modified electrode corresponds to the presence of a larger number of electrochemical active sites and decrease in the charge transfer resistance in the TiO2NPs/CPE rather
Figure 3. (a) The CVs of bare CPE and TiO2NPs/CPE in the presence of 10 mmol L-1 K4Fe(CN)6 solution at a scan rate of 20 mV s-1 and pH of 7.0 in
0.1 mol L-1 KCl as supporting electrolyte; (b) plot of I
paversusυ1/2 at the surface of bare CPE and TiO2NPs/CPE at various scan rates of 10, 25, 50, 75,
100, 150, 200, 250, 300, 350, 400, 450 and 500 mV s-1 for the oxidation of 1 mmol L-1 K
than in the bare CPE. These results indicated that the electrochemical oxidation of PRX has higher electron transfer kinetics in the surface of modified electrode, therefore, somewhat improving the sensitivity for voltammetric measurement.
Effect of pH
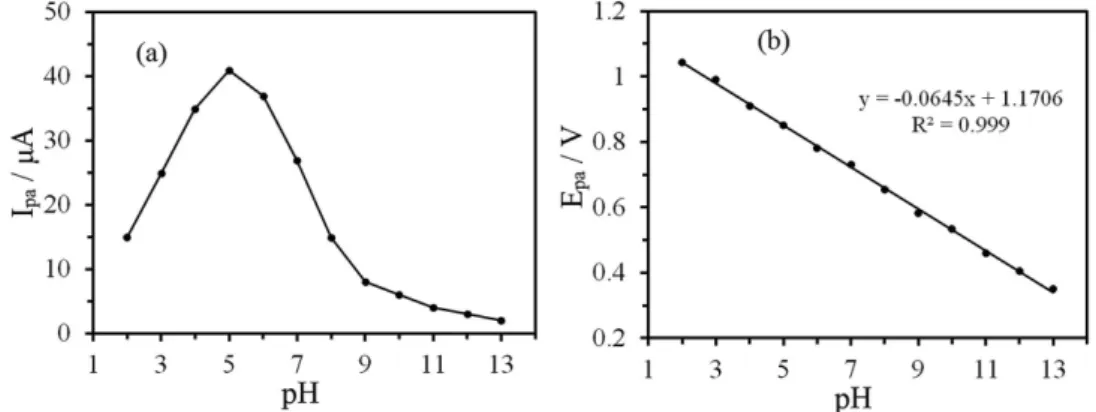
The influence of pH on the electrooxidation of 0.3 mmol L−1 PRX at TiO
2NPs/CPE was investigated in
the pH range of 2.0-13.0 (see Figure 5a). Optimum peak current was achieved at pH 5, therefore, a phosphate solution of pH 5.0 was used for subsequent work. It is seen that increasing the pH, the peak current decreases due to pH dependence of half wave potential, which indicates the involvement of protons in the electrode process and finally dislocated in alkaline pH due to a lower number of available protons.27 It can be seen from Figure 5b that with increase
in pH of the solution, the oxidation current was observed to be shifted towards lower potentials.
The linear dependence of peak potential on the pH in the range of 2.0-13.0 can be expressed by the following
equation: Ep(V) = −0.0645pH + 1.1706. A slope value of
0.0645V / pH is close to the expected slope of 0.059V / pH, which indicates that the number of electrons and protons participating in the oxidation of PRX is the same.28
Effect of potential sweep rate
Useful information with regard to electrochemical mechanisms can be obtained from the relationship between the peak current and the sweep rate. Therefore, the cyclic voltammetric investigations of PRX (0.3 mmol L−1) were
performed on the surface of TiO2NPs/CPE at different
sweep rates in the phosphate solution of pH 5.0. The PRX at the surface of TiO2NPs/CPE exhibits a single
well defined oxidation peak at 0.9 V vs. Ag|AgCl|KCl (3 mol L−1). Since no anodic peak was observed in
the reverse scan, therefore, the nature of the electrode process is irreversible. Figure 6a illustrates the influence of the sweep rate on the oxidation current of PRX in the range of 20-450 mV s−1. From Figure 6b, it can be
seen that there is no linear relationship between peak current and scan rate; meanwhile, a linear relationship
Figure 4. The cyclic voltammograms of 0.3 mmol L-1 PRX at the surface of (a) bare CPE and (b) TiO
2NPs/CPE in the phosphate solution of pH 5.0 and
scan rate of 25 mV s−1. Inset shows CVs of modified electrodes in the phosphate solution of pH 5.0.
Figure 5. The effect of pH on the (a) peak current and (b) peak potential of 0.3 mol L-1 PRX at TiO
between anodic peak current (Ipa) vs. square root of
scan rate (υ1/2) was obtained (see Figure 6c), suggesting
the diffusion of PRX at the surface of TiO2NPs/CPE,
which can be expressed by the following expression:29,30
Ipa(µA) = 12.492υ1/2(mV s−1) + 91.051, R2 = 0.998.
From theoretical point, a slope of 0.5 or 1.0 is expected for the plot of log Ipavs. log υ under diffusion or adsorption
control, respectively.31 A linear dependence is observed
between logIpa and log υ at the surface of TiO2NPs/CPE
in the PRX oxidation (see Figure 6d). From linear section, the slope of 0.2922 is found that is near to the theoretically predicted value of 0.5 for a purely diffusion-controlled current. However, the contribution of a kinetic limitation to the overall process causes a small alteration in the theoretical value.31,32
The electrochemical kinetic parameters, the number of electrons transferred (n), electron transfer coefficient (α)
and the rate of the reaction, were evaluated by subjecting the scan rate results to the Laviron equation:33
(2)
where E0 is the formal potential, n is the number of electrons
transferred, α is the electron transfer coefficient and ks is
the standard rate constant of the electrode reaction. For the irreversible oxidation reaction, the values of ks and αn
were deduced from the intercept and the slope of the linear plot of Epavs. log υ, when the value of E0 was known.34 The
value of E0 for PRX at the surface of TiO
2NPs/CPE was
obtained from the intercept of the plot of Epavs. υ, as shown
in Figure 6e (E0 = 1.1714 V). Knowing the values of E0, the
slope and the intercept of the plot of Epavs. logυ (Figure 6f),
the values of αn and ks were calculated to be 0.943 and
Figure 6. (a) The CVs of 5 mmol L-1 PRX at the TiO
2NPs/CPE in the phosphate solution (pH 5.0) at various scan rates from inner to outer: 20, 40, 75,
150, 250, 300, 350 and 450 mV s−1; (b) plot of I
pa and υ; (c) plot of Ipa and υ1/2; (d) plot of logIpavs. log υ; (e) plot of Epavs. υ and (f) plot of Epavs. logυ
2.025 s−1, respectively. Since, for a totally irreversible
electron transfer reaction, α was assumed to be 0.5, the
value of n was calculated to be 1.886. This indicated that two electrons have taken part in the irreversible oxidation step.35 Also, the large value of electron transfer rate constant
indicates the strong ability of the TiO2NPs/CPE to promote
electron transfer between PRX and the electrode surface.
Electrooxidation mechanism of PRX
Based on information obtained from cyclic voltammetry, the effect of pH and scan rate and also other studies made previously on voltammetric determination of PRX and electrochemical oxidation of amines,36-39 the
electrooxidation process of PRX at the modified electrode surface is proposed as the reaction shown in Scheme 2.
Chronoamperometric studies
Chronoamperometric measurements of PRX at the surface of TiO2NPs/CPE were carried out by setting the
working electrode potential at 0.9 V vs. Ag|AgCl|KCl (3 mol L−1) for various concentrations of PRX in the
phosphate solution (pH 5.0), as presented in Figure 7A. For an electroactive material (i.e., PRX in this case) with a diffusion coefficient, D, the current observed for the electrochemical reaction under mass transport-limited conditions can be described by the Cottrell equation:40,41
(3)
where nis the number of electron (i.e., 2), F is the Faraday number (96485 C mol−1), A is the area of the electrode
(0.0962 cm2), C is the known concentration of PRX and
D is the diffusion coefficient. Experimental plots of I vs. t–1/2
were drawn and the best fits for different concentrations
of PRX were determined (Figure 7B). The slopes of the resulting straight lines were then plotted vs. PRX concentration (Figure 7C). From the resulting slope and Cottrell equation, the mean value of D was found to be 3.92 × 10⁻⁷ cm2 s−1.
Chronoamperometry can also be used to evaluate the catalytic rate constant, kcat, for the reaction between PRX
and TiO2NPs/CPE according to the method of Galus:42
IC / IL = γ1/2[π1/2erf(γ1/2) + exp(–γ)/γ1/2] (4)
where IC is the catalytic current of PRX at TiO2NPs/CPE,
IL is the limited current in the absence of PRX, and γ= kcatCbtis the argument of the error function (Cb is the
bulk concentration of PRX). When γexceeds 2, the error
function is almost equal to 1, so equation 4 can be reduced to:
IC / IL = π1/2γ1/2 = π1/2(kcatCbt)1/2 (5)
where t is the elapsed time. Equation 5 can be used to estimate kcat for the catalytic process from the slope of
IC / ILvs. t1/2 at a given PRX concentration (Figure 7D). The
average value of kcat was calculated to be 12.64 cm3 mol−1 s−1.
Analytical applications
Calibration curve
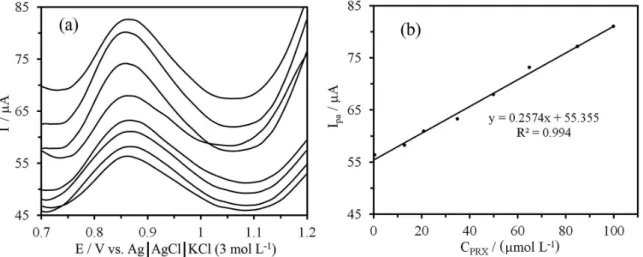
In order to develop an electroanalytical method for the PRX determination, we have selected the DPV method. The phosphate solution of pH 5.0 was selected as the supporting electrolyte for the quantification of PRX as it gave maximum peak current. The DPV measurement conditions were optimized by monitoring the variation in peak current with pulse amplitude, pulse width and sweep rate. The quantitative determination of PRX was based on the dependence of oxidation peak current on the PRX
concentration. The differential pulse voltammograms of PRX at different concentrations is shown in Figure 8a. Under the optimized conditions (sweep rate: 25 mV s−1,
pulse amplitude: 50 mV, pulse width: 50 ms), a linear relation between the peak current and PRX concentration was observed in the range of 0.46-100 µM. Deviation from the linearity was observed above this concentration level perhaps due to the adsorption of oxidation product of
PRX on the surface of TiO2NPs/CPE. The dependence of
oxidation peak current vs. the concentration of PRX at the surface of TiO2NPs/CPE is shown in Figure 8b. The value
of F for regression obtained was 989.2. The F value is used to test the null hypothesis that the total variance in y (i.e., oxidation peak current) is equal to the variance due to error. A value of F greater than the value from the tables at the chosen confidence level indicates that the null hypothesis Figure 7. (A) Chronoamperograms obtained at TiO2NPs/CPE in the phosphate solution (pH 5.0) for PRX concentrations of (a) 0.0; (b) 0.3; (c) 0.4;
(d) 0.5 and (e) 0.6 mmol L-1; (B) plots of I vs. t-1/2 obtained from chronoamperograms (a)-(e) in (A); (C) plot of the slope of the straight lines against PRX
concentration; (D) dependence of Icat / Il on t1/2 derived from the data in chronoamperogram (a)-(e) in (A).
Figure 8. (a) DPVs of PRX at TiO2NPs/CPE in the phosphate solution of pH 5.0 at different concentrations from inner to outer: 0.6, 13, 21, 35, 50, 65,
should be rejected and that the regression is significant. This result is in agreement with the obtained R2 of regression
model (i.e., R2 = 0.994).
The limit of detection (LOD) and limit of quantification (LOQ) were estimated by the following equations:27
LOD = 3S.D. / m (6)
LOQ = 10S.D. / m (7)
where S.D. is the standard deviation of the intercept and m is the slope of the calibration curve. The LOD and LOQ were calculated to be 0.14 and 0.46 µmol L−1, respectively.
The calibration curve was linear in the concentration lower than 100 µmol L−1. Then, linear dynamic range (LDR)
obtained was 0.46-100 µmol L−1.
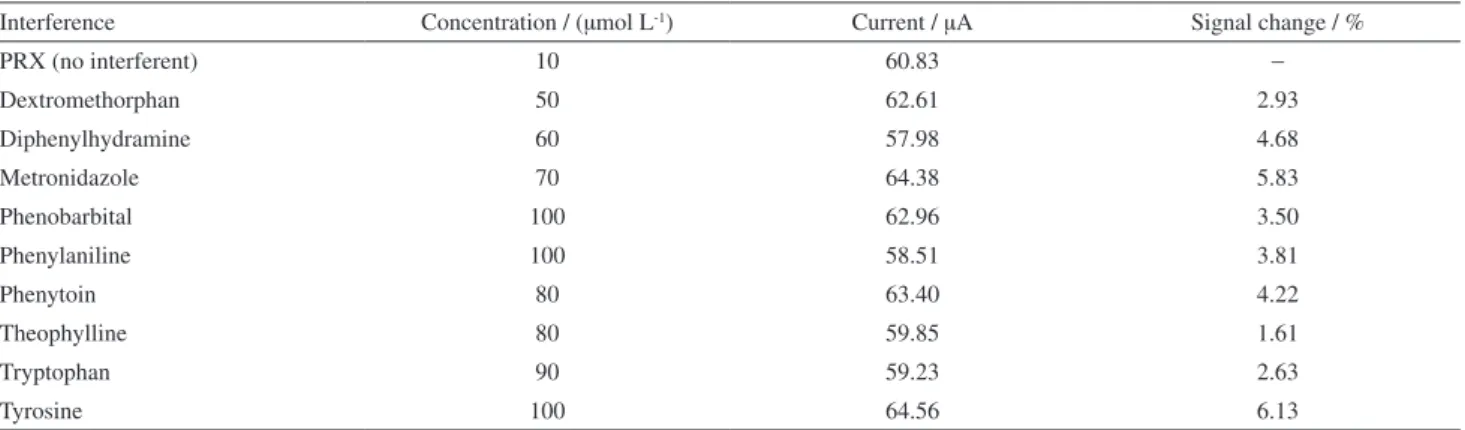
Effect of interferences
The effects of some biological interferences have been investigated on the electrochemical oxidation of PRX. This was performed by recording the DPVs of 10 µM PRX at TiO2NPs/CPE for 5 times with varying amounts of each
of the interfering substance (5-100 µmol L−1). For each
voltammetric measurement (in the absence and presence of interferences), freshly modified electrode was used to obtain the reproducible results. The corresponding results are given in Table 1. The experimental results show that modified electrode yield a small change response for the interfering agents. It confirms that TiO2NPs/CPE can be considered
as a good electrochemical sensor for recognition of PRX.
Determination of PRX in the pharmaceutical tablets and spiked plasma samples
The TiO2NPs/CPE was directly used to determine the
content of PRX in 0.35 and 0.7 mg tablets. Ten tablets were weighed and grounded to an homogeneous fine powder in a mortar. The powder was then transferred in 100 mL distilled water by ultrasonication. Then, different adequate amount of prepared solutions was diluted to 10 mL with the phosphate solution (pH 5.0) and transferred to the voltammetric cell for the voltammetric determinations. The results listed in Table 2 agreed satisfactorily with the labeled content of PRX. Low values of the relative standard deviation (RSD, 2.24%) indicated good reproducibility of the results.
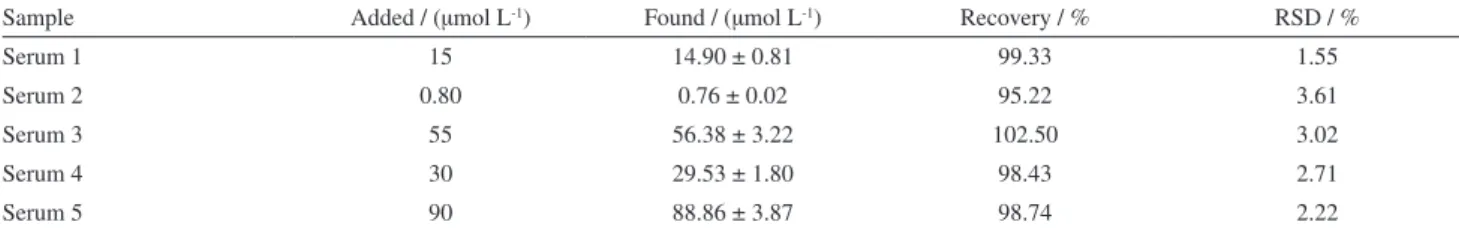
The applicability of the proposed method was examined by analyzing PRX in plasma samples employing the TiO2NPs/CPE. Serum samples were spiked with known
amounts of PRX and analyzed by recording DPVs. The amount of PRX in human serum samples was determined by referring to the calibration pot. The obtained results in Table 3 indicated good recovery of PRX.
Repeatability, stability and reproducibility of the modified electrode
The repeatability of the TiO2NPs/CPE was investigated
by repetitive recording at a fixed PRX concentration of 0.3 mM. The RSD for the peak currents in CVs based on five replicates was 2.7%, indicating excellent repeatability of the modified electrode response. Also,
Table 1. The effects of interferences on the DPV response of 10 µM PRX at TiO2NPs/CPE
Interference Concentration / (µmol L-1) Current / µA Signal change / %
PRX (no interferent) 10 60.83 −
Dextromethorphan 50 62.61 2.93
Diphenylhydramine 60 57.98 4.68
Metronidazole 70 64.38 5.83
Phenobarbital 100 62.96 3.50
Phenylaniline 100 58.51 3.81
Phenytoin 80 63.40 4.22
Theophylline 80 59.85 1.61
Tryptophan 90 59.23 2.63
Tyrosine 100 64.56 6.13
Table 2. Determination results of PRX in the commercial tablets (n = 5); ttab (95%) = 2.78
Tablet Sample Labeled
claim / mg
Mean amount found / mg
Added / (µmol L-1)
Found /
(µmol L-1) Recovery / % RSD / %
PRX 1 0.35 0.34 ± 0.01 3.01 2.94 ± 0.19 97.67 3.86
PRX 2 0.7 0.72 ± 0.02 6.02 6.16 ± 0.31 102.32 3.23
Table 3. Results for determination of PRX in spiked human serum samples (n = 5) by proposed sensor; ttab (95%) = 2.78
Sample Added / (µmol L-1) Found / (µmol L-1) Recovery / % RSD / %
Serum 1 15 14.90 ± 0.81 99.33 1.55
Serum 2 0.80 0.76 ± 0.02 95.22 3.61
Serum 3 55 56.38 ± 3.22 102.50 3.02
Serum 4 30 29.53 ± 1.80 98.43 2.71
Serum 5 90 88.86 ± 3.87 98.74 2.22
RSD: Relative standard deviation.
Table 4. Comparison of the analytical performance of TiO2NPs modified carbon paste electrode (present work) with previously reported electrochemical
methods
Method Electrode pH LOD / (µmol L-1) LDR / (µmol L-1) Reference
SWV PANI-Bi2O3/GCEa 4.5 0.0052 0.0118-0.0946 27
SWV GRP/GCEb − 6.05 × 10⁻⁵ 1.9 × 10⁻⁴-1.4 × 10⁻³ 28
DPV ERGO/GCEc 6 0.0028 0.01-15 34
CV and amperometry MWCNT/GCEd 7 0.22 (by CV)
0.20 (by amperometry)
12.5-313 (by CV) 5-340 (by amperometry)
36
CE − − 4.7 × 10⁻⁵ 1.18 × 10⁻⁴-0.0047 43
HPLC − − − 4.73 × 10⁻⁵-4.73 × 10⁻² 44
Spectrophotometry − − 0.0021 0.024-0.71 45
DPV TiO2NPs/CPE 5 0.14 0.46-100 this work
aPolyaniline-bismuth oxide nanocomposite modified glassy carbon electrode; bgraphene modified glassy carbon electrode; cglassy carbon electrode modified
with electrochemically reduced graphene oxide; dmulti-walled carbon nanotubes-modified glassy carbon electrode. SWV: squarewave voltammetry;
DPV: differential pulse voltammetry; CE: capillary electrophoresis; HPLC: high-performance liquid chromatography; LOD: limit of detection; LDR: linear dynamic range.
using the TiO2NPs/CPE daily and storing under ambient
conditions over a period of 40 days, the electrode retained 97.3% of its initial peak current response for a PRX concentration of 0.3 mmol L−1, which shows long-term
stability of the modified electrode. Also, the fabrication reproducibility was evaluated by preparing five modified electrodes independently. The RSD for peak current determinations with five prepared electrodes on 0.3 mmol L−1 PRX was calculated to be 3.4%. The repeatability and
stability of TiO2NPs/CPE were also examined by DPV
measurements of 20.0 µmol L−1 PRX. The RSD for five
successive assays was 1.8%. When using five different TiO2NPs/CPE, the RSD% for five measurements (for
each one) was 2.8%. When the electrode was stored in the laboratory, the modified electrode retains 97.5% of its initial response after a week and 95% after 30 days. The results indicate that the modified electrode has a good repeatability and reproducibility in both preparation procedure and voltammetric determinations with good long-term stability. So far, few studies have been reported for electrochemical determination of PRX. The results of this work were compared with other previous work27,28,34,36
and are shown in Table 4.
Conclusions
In the present study, electrochemical determination of pramipexole was studied using modified carbon paste electrode with TiO2 nanoparticles (TiO2NPs/CPE) via CV,
DPV and chronoamperometry techniques. The developed methodology of this study was simple, fast, sensitive and cheap, especially in comparison with sophisticated techniques such as chromatography. The fabricated sensor identified PRX in the linear range of 0.46-100 µmol L−1
by DPV technique. The proposed electrochemical sensor was well selective for PRX in the presence of common interferences. Furthermore, it shows good reproducibility and repeatability. Besides, the modified electrode has been applied successfully for the determination of PRX in the pharmaceutical tablets and spiked plasma samples.
Acknowledgments
References
1. Leentjens, A. F. G.; Drugs 2011, 71, 273.
2. Lavudu. P.; Rani, A. P.; Sekaran, C. B.; Kumar, K. S.; Ramesh, A.; Chem. Sci. J. 2012, 3, 1.
3. Leentjens, F. G.; Koester, J.; Fruh, B.; Toby, D.; Shephard, S.; Barone, P.; Houben, J. G.; Clin. Ther. 2009, 31, 89.
4. Srinu, B. G.; Raju, C.; Asian J. Chem. 2007, 19, 816. 5. Lau, Y. Y.; Hanson, G. D.; Ichhpurani, N.; J. Chromatogr. B
1996, 683, 217.
6. Lau, Y. Y.; Selenka, J. M.; Hanson, G. D.; Talat, R.; Ichhpurani, N.; J. Chromatogr. B 1996, 683, 209.
7. Pathare, D. B.; Jadhav, A. S.; Shingare, M. S.; J. Pharm. Biomed. Anal. 2006, 41, 1152.
8. Gurupadayya, B. M.; Vishwajith, V.; Srujana, N.; World J. Chem. 2009, 4, 157.
9. Jayesh, G. P.; Ravindra, V. P.; Shobhana, K. M.; Biomed. Chromatogr.2011, 25, 524.
10. Shubhangi, M. P.; Sunil, R. D.; J. Liq. Chromatogr. Relat. Technol. 2011, 34, 1664.
11. Alessandro, M.; Ernst, K.; Emanuele, M.; Anal. Chim. Acta 2008, 626, 89.
12. Aref, M. A.; Raoof, J. B.; Ojani, R.; Colloids Surf. B 2013, 109, 287.
13. Raoof, J. B.; Ojani, R.; Baghayeri, M.; Aref, M. A.; Anal. Methods 2012, 4, 157.
14. Lin, X.; Li, Y.; Biosens. Bioelectron. 2006, 22, 253.
15. Ghavami, R.; Salimi, A.; Navaee, A.; Biosens. Bioelectron. 2011, 26, 3864.
16. O’Regan, B.; Gratzel, M.; Nature 1991, 353, 737.
17. Macak, J. M.; Barczuk, P. J.; Tsuchiya, H.; Nowakowska, G. A.; Chojak, M.; Bauer, S.; Virtanen, S.; Kulesza P. J.; Schmuki, P.; Electrochem. Commun. 2005, 7, 1417.
18. Qingwen, L.; Yiming, W.; Guoan, L.; Mater. Sci. Eng. C 2000, 11, 71.
19. Li, G.; Qu, J.; Zhang, X.; Ge, J.; Water Res. 2006, 40, 213. 20. Lo, P. H.; Kumar, S. A.; Chen, S. M.; Colloids Surf. B 2008,
66, 266.
21. Raoof, J. B.; Ojani, R.; Baghayeri, M.; Chin. J. Catal. 2011, 32, 1685.
22. Lunsford, S. K.; Choi, H.; Stinson, J.; Yeary, A.; Dionysiou, D. D.; Talanta 2007, 73, 172.
23. Mashhadizadeh, M. H.; Afshar, E.; Electrochim. Acta 2013, 87, 816.
24. Mashhadizadeh, M. H.; Refahati, R.; Amereh, E.; Anal. Bioanal. Electrochem. 2013, 5, 270.
25. Gharibi, H.; Kakaei, K.; Zhiani, M.; J. Phys. Chem. C 2010, 114, 5233.
26. Hassaninejad–Darzi, S. K.; Rahimnejad, M.; J. Iran. Chem. Soc. 2014, 11, 1047.
27. Jain, R.; Tiwarib, D. C.; Shrivastava, S.; Mater. Sci. Eng. B 2014, 185, 53.
28. Jain, R.; Sharma, R.; Yadav, R. K.; Shrivastava, R.; J. Electrochem. Soc. 2013, 160, 179.
29. Engin, C.; Yilmaz, S.; Saglikoglu, G.; Yagmur, S.; Sadikoglu, M.; Int. J. Electrochem. Sci. 2015, 10, 1916.
30. Madrakian, T.; Haghshenas, E.; Afkhami, A.; Sens. Actuators, B 2014, 193, 451.
31. Azizi, S. N.; Ghasemi, S.; Chiani, E.; Electrochim. Acta 2013, 88, 463.
32. Fleischmann, M.; Korinek, K.; Pletcher, D.; J. Electroanal. Chem. Interfacial Electrochem. 1971, 31, 39.
33. Laviron, E.; J. Electroanal. Chem. 1979, 101, 19.
34. Narayana, P. S.; Teradal, N. L.; Seetharamappa, J.; Satpati, A. K.; Anal. Methods 2015, 7, 3912.
35. Teixeira, J. G.; Veiga, A.; Carvalho, A. J. P.; Teixeira, D. M.; Electrochim. Acta 2013, 108, 51.
36. Cheemalapati, S.; Karuppiah, C.; Chen, S. M.; Ionics 2014, 20, 1599.
37. Thirumoorthi, A.; Elango, K. P.; J. Chem. Sci. 2007, 119, 289. 38. Adams, R. N.; Electrochemistry at Solid Electrodes. Monographs
in Electroanalytical Chemistry and Electrochemistry; Marcel Dekker: New York, 1969.
39. Haouas, K. B.; Tapsoba, I.; Benkhoud, M. L.; Boujlel, K.; J. Electroanal. Chem. 2004, 571, 241.
40. Taraszewska, J.; Rosłonek, G.; J. Electroanal. Chem. 1994, 364, 209.
41. Greef, R.; Peat, R.; Peter, L. M.; Pletcher, D.; Robinson, J.; Instrumental Methods in Electrochemistry; Ellis Horwood:
Chichester, 1990.
42. Luo, H.; Shi, Z.; Li, N.; Gu, Z.; Zhuang, Q.; Anal. Chem. 2001, 73, 915.
43. Alessandro, M.; Ernst, K.; Emanuele M.; Anal. Chim. Acta 2008, 626, 89.
44. Lau, Y. Y.; Hanson, G. D.; Ichhpurani, N.; J. Chromatogr. B 1996, 683, 217.
45. Lavudu, P.; Rani, A. P.; Sekaran, C. B.; Kumar, K. S.; Ramesh, A.; Chem. Sci. J. 2012, 2012, CSJ49.
Submitted: February 11, 2016