Ar
ti
cl
e
0103 - 5053 $6.00+0.00
*e-mail: [email protected]
Electrochemical Behavior of Metribuzin on a Glassy Carbon Electrode in an
Aqueous Medium including Quantitative Studies by Anodic Stripping Voltammetry
Augusto César de Andrade Lima, Emanuella Gomes da Silva, Marília Oliveira Fonseca Goulart, Josealdo Tonholo, Tiago Terto da Silva andFabiane Caxico de Abreu*
Instituto de Química e Biotecnologia, Universidade Federal de Alagoas, Campus A. C. Simões, Tabuleiro do Martins, 57072-970 Maceió-AL, Brazil
O comportamento eletroquímico do herbicida metribuzin foi estudado em solução aquosa com eletrodos de carbono vítreo, em pasta de carvão/nujol, carvão/óleo de mamona e pela utilização de voltametria cíclica, voltametria de onda quadrada, voltametria de pulso diferencial, coulometria e eletrólises em potencial controlado, para ins de quantiicação e estudos de degradação. Os produtos majoritários obtidos a partir da eletrólise redutiva de metribuzin, após o consumo de 8,26 mol elétron mol-1, foram o desaminometribuzin e o dicetometribuzin. A onda anódica observada após
a eletrorredução está relacionada à oxidação do tiolato de metila, gerado no processo eletrolítico. Essa onda foi utilizada para a determinação quantitativa de metribuzin em amostra comercial, por meio de voltametria de redissolução anódica. De maneira a promover descontaminação, por eliminação do herbicida, o processo eletro-Fenton foi utilizado e levou a 80% de mineralização de metribuzin.
The electrochemical behavior of the herbicide metribuzin was studied in an aqueous solution on glassy carbon, carbon paste/Nujol oil and carbon paste/castor oil using cyclic voltammetry, square-wave voltammetry, differential pulse voltammetry, controlled-potential coulometry and electrolysis, for quantiication and decontamination purposes. The main electrolytic products obtained from the reduction of metribuzin, after consumption of 8.26 mol electron mol-1, were
deaminometribuzin and diketometribuzin. The anodic wave observed after electroreduction is associated with the oxidation of the methylthiolate generated in the electrolytic process. This wave was used to quantitatively determine metribuzin in a commercial sample by anodic stripping voltammetry. The electro-Fenton method was employed to promote decontamination by eliminating the herbicide, resulting in 80% of mineralization of the metribuzin.
Keywords: metribuzin, herbicide, anodic stripping voltammetry, electro-Fenton
Introduction
Pesticides have been used extensively as a strategy to improve agricultural productivity, but their use poses environmental and toxicological risks and groundwater contamination by herbicides has been a major concern in recent years.1,2 Metribuzin (4-amino-6-tert
-butyl-3-methylthio-1,2,4-triazin-6(4H)-one (MTZ) belongs to the class of triazines that are widely used for weed control.3
It is a selective triazinone that inhibits photosynthesis and is used for the pre- and post-emergence control of many grasses and broad-leaved weeds in soybeans, potatoes, tomatoes, sugarcane, alfalfa, asparagus, maize
and cereals at 0.07-1.05 kg active ingredient (a.i.)/ha.4
MTZ is available in the form of liquid suspensions, water dispersible granules, and dry lowable formulations. Due to its physicochemical characteristics, MTZ is a strong aquatic contaminant. It is highly soluble, with a steam pressure of 1.3 mPa, a 30-day shelf life and a Koc sorption coeficient of 41.5-7
MTZ is commonly determined by different chromatographic methods, such as reverse-phase thin-layer chromatography, high-performance liquid chromatography and capillary electrophoresis,8 and the process of reduction
and electroanalytical determination of MTZ has been studied by polarographic techniques.9,10 However, the
and its determination in aqueous medium, using glassy carbon (GC) or carbon paste (CP) electrodes.
Castor oil is a vegetable oil obtained from Ricinus communis L (known as mamona in Brazil) and, like other vegetable oils, it is a triglyceride of various fatty acids containing about 10% of glycerin. The fatty acids consist of 80-90% ricinoleic acid, 3-6% linoleic acid, 2-4% oleic acid and 1-5% saturated fatty acids17,18 which can enhance
the accumulation of several lipophilic compounds. The
tert-butyl group in MTZ renders it lipophilic. Carbon paste electrodes modiied with castor oil have been used by Radi for the sensitive and selective determination of anti-inlammatory and diuretic drugs.19
Among the new oxidation methods or advanced oxidation processes (AOPs), electrochemical technologies are environmentally friendly and effective methods for the direct production of hydroxyl radicals (•OH) via anodic
oxidation or indirect generation via the electro-Fenton process. In anodic oxidation, adsorbed •OH (•OH
ads) is
generated from water oxidation [reaction (1)] on high O2-overvoltage anodes.11 In the electro-Fenton method, •OH is produced in the reaction solution from Fenton’s
reaction (2) between hydrogen peroxide (H2O2) generated from two-electron reduction of oxygen [reaction (3)] at the cathode and Fe2+ present in the medium. H
2O2 and Fe 2+ can
be generated electrochemically in situ, either separately or concurrently.12
H2O →•OH ads + H
+ + e− (1)
H2O2 + Fe2+ → Fe3+ + •OH + OH− (2)
O2 + 2H+ + 2e− → H
2O2 (3)
MTZ commonly decomposes in the environment through microbiological and chemical processes.4 In
recent years, electro-Fenton methods have been studied extensively to decompose various organic compounds, as is the case of MTZ, which has been subjected to anodic Fenton treatment.13 The present work also demonstrates
the possibility of an eficient electro-Fenton reaction using a catalytic quantity of ferrous ions in the initial solution, which generates hydrogen peroxide in the cathodic
compartment, thus causing MTZ mineralization in an acid medium.
Experimental
Chemicals
All the chemicals used here were of analytical grade. MTZ was purchased from Sigma-Aldrich and was used without further puriication. The castor oil (from Ricinus communis L.) was supplied by Acros Organics (CAS 8001-79-4). Sencor 480 and graphite powder were purchased from Bayer and VWR Scientific/Treck Photographic Inc., respectively. Mohr’s salt, (NH4)Fe(SO4)2•6H
2O,
was purchased from Sigma-Aldrich (St. Louis) and was used to obtain ferrous ion through the electro-Fenton process. Buffer solutions (pH 1-12) were prepared with an ionic strength of 0.2 mol L-1 for all the experiments,
using analytical grade reagents and water puriied in a Millipore Milli-Q system (conductivity < 0.1 µS cm-1).
All the experiments were carried out at room temperature (24 ± 2 oC) and, to eliminate oxygen, N
2 was bubbled
into the solution for 10 min. The stock solution of MTZ (c = 1.0 or 10 mmol L-1) was prepared by dissolving the
compound in ethanol.
Apparatus
pH measurements were taken with a MARCONI MAPA200 series 0113992 pH-meter with a combined glass electrode. The total organic carbon (TOC) of treated solutions was analyzed using a Shimadzu TOC-V CPH system. The products of electrolysis were examined with a Shimadzu GCMS-QP5050A mass spectrometer. The electrochemical experiments [square-wave (SWV) and cyclic voltammetry (CV), differential pulse voltammetry (DPV), controlled potential coulometry and controlled potential electrolysis] were recorded using an Autolab PGSTAT-30 potentiostat from Echo Chemie (Utrecht, the Netherlands) coupled to a PC microcomputer operating with GPES 4.9 software. The working electrode was a glassy carbon (GC) electrode (BAS), with a diameter of 3.00 mm, or carbon paste/Nujol (CP/Nujol) or carbon paste/castor oil (CP/castor oil), while the counter electrode was a Pt coil and the reference electrode was an Ag|AgCl, Cl- (0.1 mol L-1),
acetate buffer solution. The optimized parameters of the square-wave voltammetry (SWV) and differential pulse voltammetry (DPV) were set up using a step potential (∆Es) of 0.002 V, pulse amplitude (∆Esw) of 0.025 V, frequency (f) of 50 Hz, step potential (∆Es) of 0.002 V and modulation amplitude (∆E
dpv) of 0.05 V, respectively.
Electrolysis of MTZ, in an undivided Pyrex cell (100 mL), was performed using carbon felt (2.0 × 2.0 × 0.5 cm) as a working electrode, a sintered glass-separated platinum coil as auxiliary and Ag|AgCl, Cl– (0.1 mol L-1) as the reference
electrode. 40 mL of a 20% v/v ethanol/ phosphate buffered solution, pHap 5.8, after deoxygenation with N2 (10 min), were pre-electrolyzed using Eapp.−0.85 V. MTZ (20 mg, 2.33 mmol L-1) were then added to the solution and subjected
to electrolysis at Eapp.−0.85 V. Electrolysis was interrupted when the current dropped to about 10% of its initial value. The initial current cell value could not be reached due to the proximity to the supporting electrolyte discharge. The reaction was monitored by cyclic voltammetry, using a GC electrode. The post-electrolysis solution was extracted with ether (5 mL) three times. The products resulting from the coulometry (organic phase) were identiied using a Shimadzu GC QP5050A gas chromatograph equipped with an electron impact MS detector (Kyoto, Japan). The operating conditions of the chromatograph were: capillary column (30 m × 0.25 m × 0.25 µm), initial temperature 160º for 1 min, heating rate 10ºC min-1 to 250 ºC (5 min), with helium
used as carrier gas (70 kPa).
Preparation of carbon paste electrodes
The carbon paste was prepared by thoroughly hand-mixing measured quantities of graphite powder and Nujol or castor oil. The optimal quantity was obtained by mixing the components in a 70/30 ratio (m/m). The electrode body was built from a polyethylene supporting tube and the electric contact was a plug connected to a copper wire using carbon paste. The carbon paste was packed into the coil of the electrode body, which was then sandpapered to a glossy appearance. After each measurement, the electrode surface was replaced using the same above described procedure.
Electro-Fenton experiments
Electrolysis was carried out in a three-electrode electrochemical cell controlled by a potentiostat-galvanostat. The working electrode was a 4 cm2 piece
of carbon felt, while the counter electrode was a 1 cm2
platinum sheet and the reference electrode was Ag|AgCl, Cl– (0.1 mol L-1). An aqueous solution of MTZ was prepared
at a 4.66 mmol L-1 concentration. Prior to the electrolysis,
oxygen was bubbled into the aqueous solution for 5 min to saturate it, while continuously stirring with a magnetic stirrer. A catalytic quantity of Mohr’s salt, (0.5 mmol L-1),12
was mixed into the solutions before beginning the electrolysis. The initial pH was set at 2.8 by the addition of aqueous HCl. The current-controlled electrolyses were carried out in an undivided cell to which a current of 50 mA was applied (current density 12.5 mA cm-2).
Analytical curves
After optimizing the experimental parameters for the experiments with GC, CP/Nujol and CP/castor oil electrodes, the analytical curves were built by adding aliquots of MTZ stock solution into the measuring cell containing a 0.2 mol L-1 acetate buffer solution at pH 4.0.
The solution was magnetically stirred for 2 min and, after resting for 5 s, an anodic sweep was carried out using square-wave voltammetry (SWV). SWV parameters were set up using (ta) of 30 s at −1.4 V, a step potential, (∆Es) of 0.002 V, pulse amplitude (∆Esw) of 0.025 V and a frequency (f) of 50 Hz. For real sample experiments, an aliquot of 2.5 µL of Sencor 480 (commercial herbicide) was added to the cell containing 10 mL of the supporting electrolyte (0.2 mol L-1 acetate buffer, pH 4), followed by
electrochemical measurements.
Results and Discussion
Cyclic voltammetry
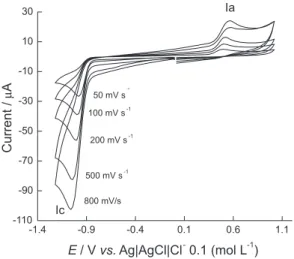
The electrochemical behavior of MTZ was studied in 0.2 mol L-1 acetate buffer medium at pH 4.0 with a
static GC electrode. The cyclic voltammogram displayed a single irreversible cathodic wave at Epc = −1.0 V at 0.100 V s-1 (Figure 1), which shifted to more negative
potentials upon increasing the scan rate (υ). The peak potential (Ep) and the peak current (Ip) varied linearly with log υ and υ1/2, respectively, indicating the irreversible
and diffusion-controlled nature of the electrode process. The cathodic peak was attributed to the reduction of the azomethine bond in position 1-6.9 Also, because
α-carbonyl-azomethine is isoelectronic with the α,β -unsaturated carbonyl group, and its reactivity is very similar, it follows the same electrochemical process in aqueous conditions, i.e., reduction of the double bond, once electrohydrodimerization is precluded by the presence of the tert-butyl bulky group.20
An anodic wave at Epa + 0.500 V was observed at 0.100 V s-1, which was assigned to the oxidation of the
on the scan rate and signiicantly increased by adsorptive stripping voltammetry, after an accumulation time of 30 s (Figure 2). The same electrochemical behavior was observed using CP/Nujol and CP/castor oil (data not shown).
Effect of pH
The effect of pH on the peak current (Ip) and peak potential (Ep) is shown in Figure 3. Initially, the Ip
increased with increasing pH, reaching a maximum at pH 2.0, and thereafter decreasing with further increases in pH. Therefore, pH 4.0 was chosen for the analysis. The peak potential (Ep) shifted linearly toward more negative potentials with increasing pH, with a slope of 66 mV/pH unit (Figure 3). The pKa value obtained from the peak potential versus pH plot was approximately 1.0, similar to the one obtained by the spectrophotometric method.14
Preparative electrolysis
The controlled-potential electrolysis of MTZ (0.050 g, 2.33 mmol) was conducted under an applied potential of
−0.85 V in 20% v/v ethanol/ phosphate buffer, pH 5.8. Figure 4 shows the CV before and after electrolysis. The decrease in current in the reduction peak indicated the progress of the electrolysis. The electrolyzed solution showed no voltammetric reduction peaks after the consumption of 8.26 mol electron mol-1, at which point the
reduction wave of MTZ disappeared completely. A new and well-deined oxidation peak appeared at +0.600 V.
The products of the reduction mixture were analyzed by GC-MS, with mass spectra showing peaks indicative of MTZ itself (molecular ion [M + H]+ 215 uma) and two
other products, deaminometribuzin (DA) (molecular ion [M + H]+ 200 uma), and diketometribuzin (DK) (molecular
ion [M + H]+= 185 uma). The anodic wave observed after Figure 1. CV of 1 mmol L-1 MTZ in acetate buffer pH 4.0 on the GC
electrode. Effect of the scan rate.
Figure 2. Adsorptive stripping voltammetry of 1 mmol L-1 MTZ on GC
electrode in acetate buffer, pH 4.0. Anodic curve: Eappl.= −1.00 V; td = 30 s. Scan rate 0.100 V s-1.
Figure 3. Variation of peak potential and peak current of a 1.0 mmol L-1
MTZ solution with pH, using DPV. Step potential (∆Es) of 0.002 V, modulation amplitude (∆Edpv) of 0.05 V.
Figure 4. CV of the electrolysis of 2.33 mmol L-1 MTZ in 20% v/v
electrolysis was probably associated with the oxidation of the methylthiolate group released from DA, similarly to the the electrochemical reduction mechanism of MTZ and prometryne obtained on mercury electrode.10,15
Degradation of MTZ in electro-Fenton processes
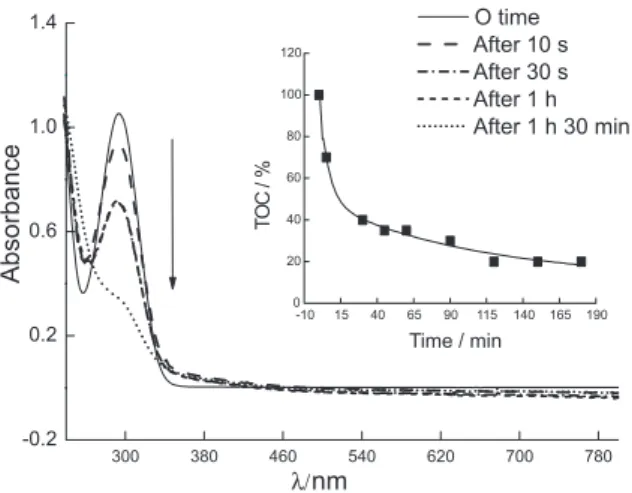
Electro-Fenton experiments were conducted in an attempt to eliminate the herbicide by degradation. Because the electro-Fenton process involves a preliminary reduction of oxygen, it is important to analyze possible interferences on TOC resulting from the eventual reduction of MTZ. For this reason, reductive electrolysis of MTZ was also carried out. The products of reaction of both procedures were examined by TOC and spectrophotometric analyses. The results of electrolysis were shown above and led to different products, with a slight lowering of mass content. TOC did not change signiicantly during electrolysis. Different results were obtained by the electro-Fenton method, as shown in Figure 5. This method successfully removed TOC from the MTZ solution. In this process, TOC was removed rapidly during the irst 30 min. The TOC removal eficiency achieved by the electro-Fenton process was nearly 60% in the irst hour. After 2 h, TOC reached 20%, indicating that 80% of mineralization occurred and that the electro-Fenton method can be used successfully for MTZ degradation (Figure 5, inset).
The MTZ absorption spectrum was characterized by a band whose maximum was located at 292 nm (Figure 5). During electrochemical oxidation, the MTZ chromophore is destroyed, which is relected, to a certain extent, by the TOC removal eficiency (Figure 5, inset).
Anodic stripping voltammetry
Figure 6 shows the square-wave voltammograms, in the range of 0 to +1.0 V, of a 1.0 × 10⁻⁴ mol L-1 MTZ solution
in acetate buffer, pH 4.0, without (a) and with previous accumulation (b) on the GC electrode after applying a potential of −1.0 V for different periods of time. After the accumulation process, a well-deined anodic wave was visible at +0.500 V, suggesting the feasibility of proposing a novel method to determine MTZ by anodic stripping voltammetry. The effect of accumulation time (ta) on the peak current was examined at ta from 5 to 80 s. As a result, higher sensitivity was achieved by extending the accumulation time to about 40 s. After this period of time, the curve leveled off, indicating saturation on the electrode surface. An accumulation time of 30 s was used as a compromise between sensitivity and analysis speed, and was employed to obtain the calibration curve.
To optimize the square-wave response of MTZ, the instrumental parameters affecting this electrochemical technique were studied. A square-wave frequency (f) of 50 Hz, a scan increment of 2 mV, and square-wave amplitude of 50 mV were used as the initial conditions. The
f was then scanned from 10 to 100 Hz, at scanning rates of 20 to 200 mV s−1, and the square-wave voltammograms
were recorded. Based on the results of these experiments and in order to obtain the best sensitivity without a high increment of peak width, an f value of 50 Hz (which corresponds to 100 mV s−1) was chosen for further
experiments.
Figure 5. UV-Vis spectra of MTZ during the electro-Fenton process. [MTZ] = 4.66 mmol L-1; [Mohr’s salt] = 0.5 mmol L-1; pH
i 3.0; current
intensity of 50 mA. Inset shows the TOC removal eficiency of MTZ, c 4.66 mmol L-1; [Mohr’s salt] = 0.5 mmol L-1 pH
i 3.0; feed time = 0 to
180 min.
Figure 6. SWV of a 1.0 mmol L-1 MTZ solution in 0.2 mol L-1 acetate
Analytical calibration curve and limits of detection and quantiication
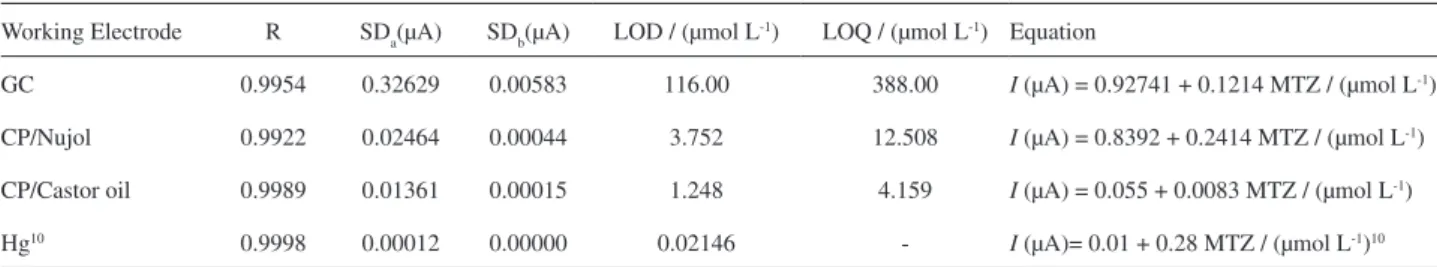
The analytical performance of the stripping method developed for MTZ determination was evaluated with three different working electrodes: GC, CP/Nujol, CP/Castor oil. Based on the stripping voltammograms recorded with increasing amounts of MTZ using the above described optimized parameters, it was found that the peak current increased with the analyte concentration in a range of 1.0 ×10⁻⁶ to 4.0 × 10⁻⁴ mol L-1, with all the electrodes
displaying good linearity. The sensitivity of the method was demonstrated by the LOD and LOQ values listed in Table 1. The limit of detection was determined using a 3SD/slope ratio and the limit of quantiication using a 10 SD/slope, where SD is the standard deviation of the mean value for 10 sweeps of the blank.16 The CP/castor oil
electrode produced the best results, showing lower limits of detection and higher sensitivity than the CP/ Nujol and GC electrodes. In the presence of castor oil, the wave related to the reduction of MTZ increased signiicantly, indicating the pre-concentration of MTZ on the electrode surface. That is the reason for the results obtained (Figure not shown).
Conclusions
The electrochemical behavior of MTZ on a GC electrode showed an irreversible reduction wave and an associated oxidation wave. Extensive electrolysis, after the consumption of 8.26 mol electrons mol-1, led to the
formation of deaminometribuzin (DA) and diketometribuzin (DK) as the major compoundsThe electro-Fenton process employed here resulted in the 80% mineralization of MTZ, which was conirmed by the decrease in the amount of organic carbon in the solution.
A sensitive square-wave anodic stripping voltammetry method to analyze MTZ was developed. The proposed method can be applied for the determination of herbicide and has been demonstrated as an alternative to electroanalytical methods that use mercury electrodes or to other well-established methods based on chromatographic techniques,21
with the inherent advantages of electrochemical techniques,
i.e., low cost and simple instrumentation with high accuracy and reproducibility.
The square-wave stripping voltammetry method described above was applied for the direct determination of MTZ in commercial samples (Sencor 480), whose values obtained from calibration curves and by additional methods did not differ signiicantly from the value found for the sample analyzed here (48%). The mean recovery rate was 95.02%.
Compared to these results, the use of the Hg electrode10
offers noticeably higher sensitivity (Table 1) than the CP/Castor oil electrode. However, Hg is toxic and the use of Hg electrodes has been banned in several situations due to environmental concerns and safety regulations; hence, the use of alternative electrodes is welcome.
Acknowledgments
The authors acknowledge the financial support of CNPq, CAPES, CTPETRO, CTHIDRO, PROCAD/ NF, Banco do Nordeste do Brasil (BNB) and Compesa (Companhia Pernambucana de Saneamento) (Brazil).
Table 1. Comparative studies in the quantiication of MTZ, using GC, CP/Nujol, CP/Castor oil and Hg10 electrodes
Working Electrode R SDa(µA) SDb(µA) LOD / (µmol L-1) LOQ / (µmol L-1) Equation
GC 0.9954 0.32629 0.00583 116.00 388.00 I (µA) = 0.92741 + 0.1214 MTZ / (µmol L-1)
CP/Nujol 0.9922 0.02464 0.00044 3.752 12.508 I (µA) = 0.8392 + 0.2414 MTZ / (µmol L-1)
CP/Castor oil 0.9989 0.01361 0.00015 1.248 4.159 I (µA) = 0.055 + 0.0083 MTZ / (µmol L-1)
Hg10 0.9998 0.00012 0.00000 0.02146 - I (µA)= 0.01 + 0.28 MTZ / (µmol L-1)10
Figure 7. Square-wave voltammogram of a 1.0 mmol L-1 MTZ solution
in 0.2 mol L-1 acetate buffer, pH 4.0 on the CP/Castor oil electrode. t a at
References
1. Melo, A. M.; Valentim, I. B.; Goulart, M. O. F.; Abreu, F. C.; J. Braz. Chem. Soc. 2008, 19, 704.
2. Arranz, A.; Villaba, M. F.; Betono, S. F.; Moreda, J. M.; Arranz, J. F.; Fresenius J. Chem. 1997, 357, 768.
3. Cabral, M. F.; Souza, D.; Alves, C. R.; Machado, S. A. S.; Eclet. Quim. 2003, 28, 2.
4. Pérez, J. F. H.; Iruela, M. O.; Campaña, A. M. G.; Casado, A. G.; Navarro, A. S.; J. Chromatog. A. 2006, 1102, 280. 5. Velisek, J.; Savodolva Z.; Piackova, V.; Novotny, L.; Blahova,
J.; Sudova, E.; Maly, V.; Veterinari Medicina 2008, 6, 324. 6. Armas, E. D.; Monteiro, R. T. R.; Amâncio, A.V.; Correa, R.
M. L.; Guercio, M. A.; Quim Nova 2005, 28, 975.
7. Fairrchild, J. F.; Sappington, L. C.; Arch. Environ. Contam. Toxicol. 2002, 43, 198.
8. Molina, C. Q.; Campaña, A. M. G.; Iruela, L. O.; Olmo, M.; J. Chromatog. A. 2007, 1164, 320.
9. Ludvik J.; Rield F.; Zuman P.; Electroanalysis 1998, 13, 869. 10. Skopalová, J.; Lemr, K.; Kotoucek M.; Cáp, L.; Fresenius
J. Chem. 2001, 370, 963
11. Flox, C.; Ammar, S.; Arias, C.; Brillas, E.; Zavala, A. V. V.; Abdelhedi, R.; Applied Catalysis B: Environmental 2006, 67, 93.
12. Oturan, M. A.; Oturan, N.; Lahitte, C.; Trevin, S.; J. Electroanal. Chem. 2001, 507, 96.
13. Scherer, E. M.; Wang, Q. Q.; Hay, A. G.; Lemley, A. T.; Arch. Environ. Contam. Toxicol. 2004, 47,154.
14. Albro, P. W.; Parker, C. E.; Abusteit, E. O.; Mester, T. C.; Hass, J. R.; Sheldon, Y. S.; Corbin, F. T.; J. Agric. Food Chem. 1984, 32, 212.
15. Skopalová, J.; Lemr K.; Kotoucek M.; Cáp L.; Ondra, P.; Electroanalysis 1998,5, 331.
16. Costa, C. O.; Souza, A. A.; Luz, R. C. S.; Lemos, T. L. G.; Pessoa, O. D. L.; Kubota, L. T.; Goulart, M. O. F.; J. Braz. Chem. Soc. 2008, 19, 697.
17. Radi, A.; J. Pharm. Biomed. Analysis 2001, 4, 413.
18. Melo, W. C.; dos Santos, A. S.; Santa Anna, L. M. M.; Pereira Jr., N; J. Braz. Chem. Soc. 2008, 19, 418.
19. Scholz, V.; Silva, J. N.; Biomass and Bioenergy 2008,32, 95. 20. Fussing, I.; Hammerich, O.; Hussain, A.; Nielsen, M. F.; Utley,
J. H. P. Acta Chem. Scandinavica 1998, 52, 328.
21. Sabin, G. P.; Prestes, O. D.; Adaime, M. B.; Zanella, R.; J. Braz. Chem. Soc. 2009, 20, 918.
Received: December 16, 2008