Article
J. Braz. Chem. Soc., Vol. 26, No. 3, 451-457, 2015. Printed in Brazil - ©2015 Sociedade Brasileira de Química 0103 - 5053 $6.00+0.00
A
*e-mail: [email protected], [email protected]
Selective Determination of Unsymmetrical Dimethylhydrazine on a Prussian Blue
Modified Carbon Paste Electrode
Bagher Sobhanmanesh and Mostafa Najafi*
Faculty of Science, Department of Chemistry, Imam Hossein University, Tehran, Iran
The electrocatalytic oxidation of unsymmetrical dimethylhydrazine (UDMH) has been studied on a Prussian Blue modified carbon paste electrode (PBMCPE) by cyclic voltammetry technique. The results show that Prussian Blue acts as a suitable modifier for electron transfer in the oxidation of UDMH. A linear range of 3 × 10⁻⁵ to 1.15 × 10⁻³ mol L-1, with a limit of detection (3σ) of
1.6 × 10⁻⁵ mol L-1 was obtained using the amperometric method. The proposed sensor exhibited
several advantages, including, namely, no interference from hydrazine, simple preparation, good stability and repeatability. Finally, the PBMCPE was successfully applied for determination of UDMH in water samples.
Keywords: amperometric detection, Prussian Blue, unsymmetrical dimethylhydrazine, carbon
paste electrode
Introduction
Unsymmetrical dimethylhydrazine (UDMH) is known as a relatively inexpensive fuel and, together with hydrazine, is a widely used rocket fuel.1 UDMH
is also used in the synthesis of polymers, pesticides, pharmaceuticals, and chemotherapeutic agents.2 UDMH
is a highly toxic volatile liquid and can be absorbed by oral, dermal, or inhalation routes of exposure, and is classified by the International Agency for Research on Cancer (IARC) as 2B carcinogens (possibly carcinogenic to humans).3 Different analytical methods
have been reported for the determination of hydrazine and UDMH, such as acid-base and redox titration,4 optical,5
chemiluminescence,6 fluorimetry,7 gas chromatography,8
spectrophotometry flow injection,9 gas
chromatography-mass spectrometry (GC-MS),1,4 and spectrophotometry.10
However, these methods suffer from various drawbacks, such as complexity, insufficient sensitivity or lack of portability of the instrumentation. Electroanalytical techniques seem to provide direct and efficient methods for the determination of hydrazine and UDMH, because of the opportunity for portable, cheap and rapid methodologies. Various electrochemical sensors have been applied to the determination of hydrazine and its derivatives.11-15 However, to the best of our knowledge,
only one work reported on the electrochemical detection of UDMH.16 UDMH, as hydrazine, shows a large
overpotential associated with the electrooxidation at conventional electrodes. It is a major challenge, which calls for the development of a high-performance catalyst for facilitating the oxidation process.
Ferric hexacyanoferrate, or Prussian Blue (PB), is one of the polynuclear transition-metal hexacyanometalates having an open, zeolite-like structure with well-known electrochromic,17 photo-physical,18 magnetic properties,19
and potential electroanalytical applications owing to their good catalytic properties.20-22 Recently, PB modified
electrodes have been used for the determination of various analytes, including glucose,23-25 hydrogen peroxide,26-28
hydrazine and its derivatives29-31 and other compounds.32,33
In this work, an electrochemical sensor of Prussian Blue modified carbon paste electrode (PBMCPE) was developed for UDMH determination in the presence of hydrazine.
Experimental
Chemicals and reagents
Unsymmetrical dimethylhydrazine (H2NN(CH3)2)
solution (99% purity) and hydrazine hydrate solution (H2NNH2.6H2O, 50 wt.%) were purchased from
potassium chloride (KCl), sodium hydroxide (NaOH), hydrochloric acid (HCl), dipotassium hydrogen phosphate (K2HPO4), potassium dihydrogen phosphate (KH2PO4),
and potassium hexacyanoferrate (K3Fe(CN)6) were
obtained from Fluka or Merck and used as received. The supporting electrolyte was 0.1 mol L-1 phosphate
buffer solution (PBS) at pH 7 prepared with KH2PO4 and
K2HPO4. Deionized water was used to prepare all aqueous
electrolyte solutions.
Apparatus
The electrochemical measurements were carried out with a µAutolab (III) computer-controlled potentiostat and run with the General Purpose Electrochemical System (GPES) software. The electrochemical cell was assembled with a conventional three-electrode system consisting of Ag/AgCl/3 mol L-1 KCl (Metrohm, model 6.0733.100) as
a reference electrode, a platinum wire (1 mm diameter) as a counter electrode and carbon paste electrode (2 mm diameter) as a working electrode. The pH was measured using a Metrohm 781 pH/mV meter. Scanning electron microscopy (SEM) images were obtained by using a scanning electron microscope (Philips, model XL30).
Synthesis of PB
The PB particles were synthesized according to the literature34 with some modifications. A 50 mL aqueous
solution of K3Fe(CN)6 (20 mmol L
-1) was added to
a 25 mL aqueous solution of KCl (0.1 mol L-1) and
mixed with stirring. Then, 50 mL aqueous solution of FeCl3 (20 mmol L-1) was added. During 3 days, the blue
precipitate of insoluble PB pigments was formed. The solution was centrifuged, washed with water three times and once with methanol and then dried at 80 °C.
Preparation of chemically modified carbon paste electrode (CPE)
The prepared PB (0.01 g) was mixed for 35 min with graphite powder (0.45 g) and paraffin oil (0.3 mL) to produce a homogenous carbon paste. To fabricate PBMCPE, the homogeneous paste was packed into a Teflon tube with a hole (3 mm diameter and 2 mm depth). The electrical contact was made by a copper wire connected to the paste in the inner hole of the tube. A fresh electrode surface was obtained by squeezing out a small portion of paste and polishing it with weighing paper. The modified carbon paste was kept at room temperature in a desiccator until used.
Results and Discussion
Characterization of PB particles
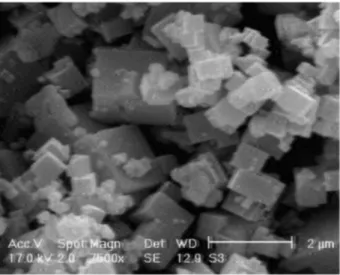
Figure 1 shows a SEM micrograph of the prepared PB particles. According to this Figure, Prussian Blue particles are cubic and have monodispersed sizes from less than 1 to 1.8 µm. It is assumed that sharp edges because of the cubic nature of the particle provide better catalytic characteristics compared with spherical morphology.
Electrochemical behavior of modified electrode
The electrochemical behavior of the PBMCPE was first investigated. Figure 2a shows cyclic voltammograms of the PBMCPE at different scan rates (10 to 500 mV s-1)
in 0.1 mol L-1 phosphate buffer solution at pH 7. In the
potential range of −0.3 to 0.55 V, a pair of reversible peaks is observed on the voltammograms. Peak separation (∆E
p = Epa – Epc) was at least 20 mV for the potential scan
rate of 20 mV s-1vs. Ag/AgCl. Also, the plots of anodic
and cathodic peak currents against the sweep rates for both anodic and cathodic peaks are linear for sweep rates of 10-50 mV s-1 (Figure 2b). These results emphasize that
the reduction of PB is an adsorption-controlled process. At sweep rates higher than 50 mV s-1, the plot of i
pvs.v 1/2
(not shown) was linear, indicating a diffusion-controlled process, which might be related to the slow diffusion of potassium ions into the PB lattice. Similar results have been reported in the literature.26,35-39
Electrochemical behavior of UDMH at a CPE and PBMCPE
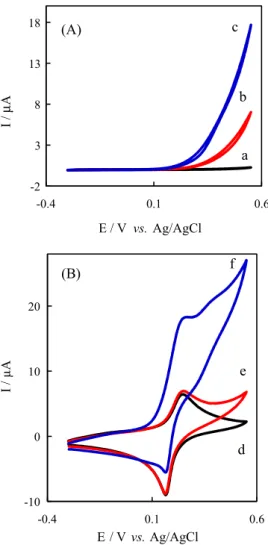
the presence and absence of hydrazine and UDMH are shown in Figure 3. As it is seen from Figure 3A, scan c, at the bare carbon paste electrode, the oxidation of UDMH requires high positive potentials, leading to a poorly defined anodic wave involving very slow electrode kinetics. In contrast, oxidation of UDMH at the PBMCPE (Figure 3B, scan f) in 0.1 mol L-1 PBS (pH 7) occurred at
much less positive potentials, associated with increasing anodic peak current while diminished in the cathodic peak current. The results indicated that the PB can act as a suitable modifier for electron transfer in the oxidation of UDMH at the carbon paste electrode. On the other hand, as can be seen in Figure 3B, scan e, the presence of hydrazine has no interference in the oxidation of UDMH. Therefore, an electrochemical technique can be developed for determination of UDMH in the presence of hydrazine.
Scan rate effect study
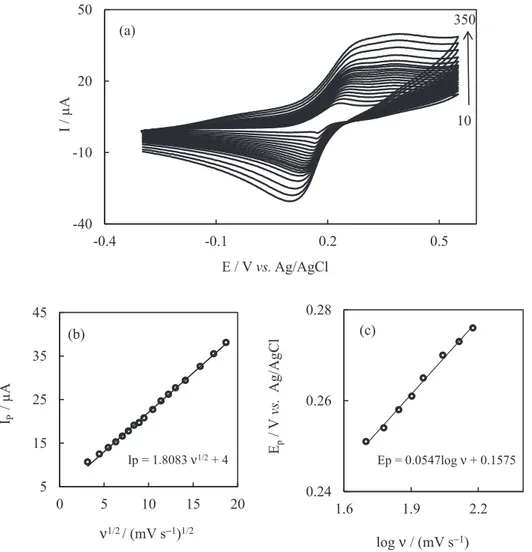
Figure 4a shows the cyclic voltammograms of a PBMCPE at various scan rates obtained in 0.1 mol L-1 PBS
(pH 7) containing 0.1 mmol L-1 UDMH. The nature of the
oxidation process was found to be diffusion-controlled as evidenced from the linear plot of the peak current (Ip) vs. square root of the scan rate (v1/2) for UDMH
(Figure 4b). As Andrieux and Saveant40 described, the
transfer coefficient (α) for an overall irreversible electron transfer can be calculated from Figure 4c, according to the following equation:
Ep = b / 2 log (ν) + k (1)
where b is the Tafel slope and the intercept of the plot of Ep vs. log(ν) is constant. The slope of the linear regression is equal to b / 2 = 0.059 / αn. Thus, b is 2(0.059 / αn). The Tafel slope (b) was 109.4 mV decade-1 (Figure 4c)
and by considering that α equals 0.54, the results indeed suggest one-electron (nα ca. 1) transfer process in the
rate-determining step for the electrocatalytic oxidation -60 -40 -20 0 20 40
-0 4. 0 0 4. 0 8.
I /
µ
A
E / Vvs.Ag/AgCl
10 500 (a) -70 -30 10 50
0 200 400
I /
µ
A
(b)
υ / (mV s-1)
Figure 2. (a) Cyclic voltammogram response of a PBMCPE in 0.1 mol L-1 PBS (pH 7) at different scan rates: 10, 20, 30, 40, 50, 60, 70, 80, 90, 100, 110, 120, 130, 140, 150, 160, 170, 180, 190, 200, 225, 250, 300, 350, 400, 450 and 500 mV s-1. (b) Plot of cathodic and anodic peak currents vs. scan rate.
-2 3 8 13 18
-0.4 0.1 0.6
I /
A
µ
E / V vs.Ag/AgCl
b c a (A) -10 0 10 20
-0.4 0.1 0.6
I / µA
E / Vvs.Ag/AgCl
e f (B)
d
Figure 3. Cyclic voltammograms for CPE (A) and Prussian Blue modified carbon past electrode (B). Scans (a) and (d) in 0.1 mol L-1 PBS (pH 7); scans (b) and (e) in 0.1 mol L-1 PBS (pH 7) containing 1 mmol L-1 hydrazine; scans (c) and (f) in 0.1 mol L-1 PBS (pH 7) containing 1 mmol L-1 hydrazine plus 0.2 mmol L-1 UDMH. Scan rates were 50 mV s-1.
-60 -40 -20 0 20 40
-0 4. 0 0 4. 0 8.
I /
µ
A
E / Vvs.Ag/AgCl
10 500 (a) -70 -30 10 50
0 200 400
I /
µ
A
(b)
υ / (mV s-1)
-2 3 8 13 18
-0.4 0.1 0.6
I /
A
µ
E / V vs.Ag/AgCl b c a (A) -10 0 10 20
-0.4 0.1 0.6
I / µA
E / Vvs.Ag/AgCl e f (B)
of UDMH. The transfer coefficient could be calculated by another method, i.e., it can be determined from the following equation at a scan rate of 200 mV s-1:41
/2
1.857 47.7
P P
RT
E E m
F
υ
α α
− = = (2)
On the basis of equation 2, the transfer coefficient (α)
was obtained as 0.52 which is in agreement with that obtained from equation 1.
Study of pH-dependence
In general, pH is one of the variables, which commonly and strongly influences the current, and shape of voltammograms. In order to choose the best pH solution for UDMH detection, the effect of pH was investigated on the response of PBMCPE in a large range of pH from 2.5 to 10 using PBS. The pH was adjusted by adding small amounts
of hydrochloric acid or potassium hydroxide, maintaining the volume of the electrolyte approximately constant. Figure 5 shows the relationship between peak current and pH value for the PBMCPE in the presence and absence of UDMH. As can be observed, the Ip of PBMCPE decreases
in alkaline solution, while the response increases with the pH up to a maximum of 7. This behavior could be explained as follows: UDMH has basic nature and is unstable in acidic environment. On the other hand, in alkaline solution (pH > 8) PB is decomposed by hydroxide ions.37 Thus, the
utility of this modified electrode is eventually limited to neutral solutions.
Analytical performance characteristics
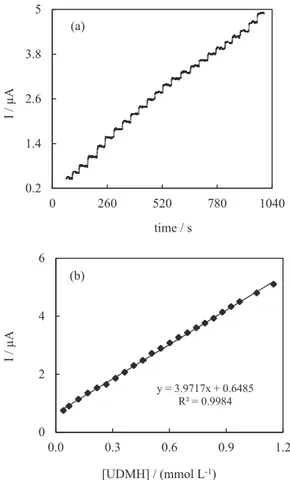
Amperometric measurements were carried out at 250 mV by injection of UDMH solution (20 mmol L-1) to
a continuously stirred (800 rpm) phosphate buffer solution (pH 7). Figure 6a shows a typical current-time response
-40 -10 20 50
-0.4 -0.1 0.2 0.5
I / µA
E / Vvs.Ag/AgCl
10 350 (a)
Ip = 1.8083ν1/2+ 4
5 15 25 35 45
0 5 10 15 20
IP
/ µA
ν1/2/ (mV s−1)1/2
(b)
Ep = 0.0547logν+ 0.1575
0.24 0.26 0.28
1.6 1.9 2.2
Ep
/
V
vs.
Ag/AgCl
logν/ (mV s−1)
(c)
of the PBMCPE on successive step changes of UDMH concentration. It can be seen that the amperometric signal is stable after the injection of UDMH and the electrode response time is very short (less than 3 s). Figure 6b displays the corresponding calibration curve for UDMH. Under the present condition, the steady-state current has a
linear relationship with the concentration of UDMH in the range from 3 × 10⁻⁵ to 1.2 × 10⁻³ mol L-1 with a detection
limit of 1.6 × 10⁻⁵ mmol L-1 (S/N = 3), sensitivity of
3.97 µA L mmol-1 and correlation coefficient (R2) = 0.9984.
The day-to-day stability of the PBMCPE was evaluated by measuring the anodic peak current response at a fixed 5.0 × 10⁻⁴ mol L-1 concentration over a period of five
months. At the end of five months the response current decreased by a factor less than 5% and relative standard deviation (RSD) of 4% for 15 measurements. This shows good stability and reproducibility of the PBMCPE and can be used in routine analysis.
Interference study
To apply this method to determine UDMH in environmental water samples, the influence of common substances as potential interference compounds (0.05 mol L-1) on the determination of UDMH was
studied under the optimum conditions with UDMH concentration of 0.05 mmol L-1. The tolerance limit was
defined as the maximum concentration of the potential interfering substance causing an error less than 3% for the determination of 0.05 mmol L-1 of UDMH. Various
interferent-to-analyte ratios (tolerance limit molar ratio) causing less than ±3% relative error for a UDMH concentration of 0.05 mmol L-1 is listed in Table 1, which
indicates that most cations and anions do not interfere with this amperometric method for UDMH determination.
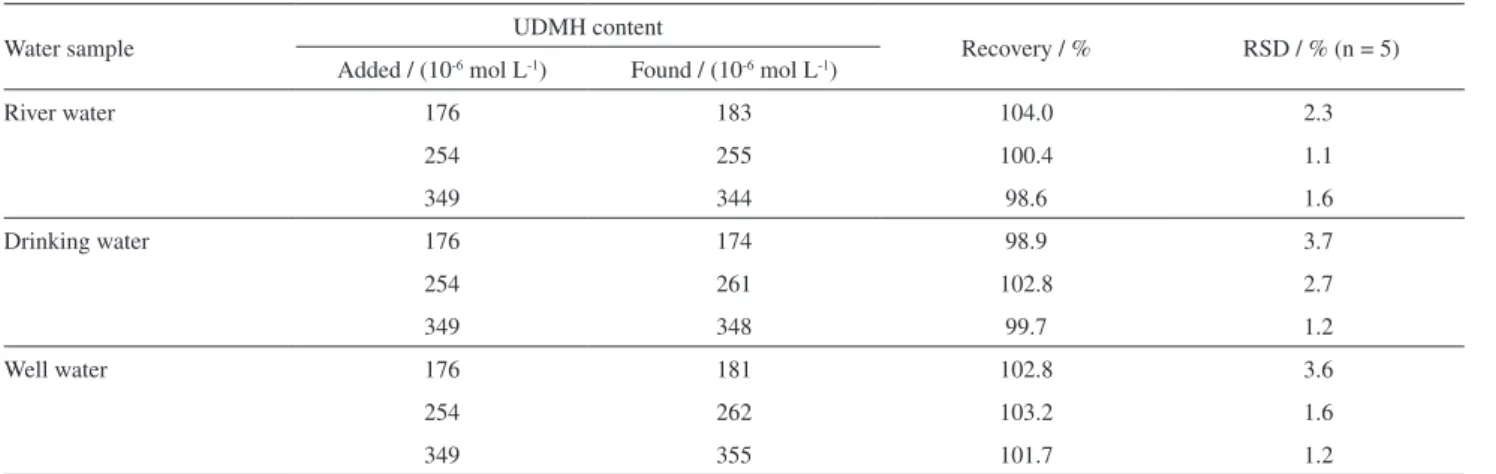
Determination of UDMH in water samples
To demonstrate the applicability of the proposed method for the analysis of a real sample, three water samples from different sources consisting of drinking water, river water and well water were spiked with UDMH and were analyzed under optimized conditions using the above technique. UDMH content of all samples was determined by PBMCPE using standard addition method. The obtained results are summarized in Table 2. As it is obvious, the recovery of UDMH was found to be between 98.6 and 104.0% and RSD
4 7 10 13 16
0 5 10
Ip
/ µA
pH
a b
Figure 5. Response of the Prussian Blue modified carbon past electrode in the absence (scan a) and presence of 0.1 mmol L-1 UDMH (scan b) in the pH range of 2.5-10.
0.2 1.4 2.6 3.8 5
0 260 520 780 1040
I
/
µA
time / s (a)
y = 3.9717x + 0.6485 R² = 0.9984
0 2 4 6
0.0 0.3 0.6 0.9 1.2
I / µA
[UDMH] / (mmol L-1)
(b)
Figure 6. Amperometric response of Prussian Blue modified carbon past electrode to successive injectiona of UDMH (a); calibration curve of UDMH concentration at the modified electrode (b). Other conditions: 0.1 mol L-1 PBS (pH 7) at 250 mV.
Table 1. Effectof some foreign ions on the determination of 0.05 mmol L-1 UDMH under optimized conditions
Foreign species (0.05 mol L-1) Maximum tolerable concentration ratio
Na+, K+, NH
4+, Ca2+, Mg2+, Ba2+, Co2+, Mn2+, Zn2+, Ni2+, Cu2+, Cr3+
1000
F−, Cl−, Br−, NO
3−, CH3COO−, H2PO4−, HPO42−, SO42−, CO32−, PO43−
1000
Table 2. Results of determination of UDMH in water samples
Water sample UDMH content Recovery / % RSD / % (n = 5)
Added / (10-6 mol L-1) Found / (10-6 mol L-1)
River water 176 183 104.0 2.3
254 255 100.4 1.1
349 344 98.6 1.6
Drinking water 176 174 98.9 3.7
254 261 102.8 2.7
349 348 99.7 1.2
Well water 176 181 102.8 3.6
254 262 103.2 1.6
349 355 101.7 1.2
was between 1.1 and 3.7% using the amperometric method. This means that the proposed procedure should be applicable to the analysis of real samples with different matrices.
Conclusions
A carbon paste electrode modified with PB has been fabricated and used for determination of UDMH in the presence of hydrazine. The results demonstrated that the electrooxidation of UDMH at the surface of PBMCPE occurs at a potential of about 220 mV and less positive than bare carbon paste electrode. The modified electrode is simple, sensitive, rapid, and economical for the determination of UDMH. The voltammetric result indicates that the PBMCPE prepared with the present method shows a stable electrochemical behavior. The oxidation process was pH-dependent and a higher catalytic current was observed about pH 7. The eletctrocatalytic response shows a linear relationship on the concentration of UDMH in the range of 30 to 1150 µmol L-1, with a limit of detection
of about 16 µmol L-1. Finally, this method was used for
the determination of UDMH in water samples using the standard addition method. The PB modified CPE with its low cost and ease of preparation seems to be of great utility for further sensor development.
References
1. Kenessov, B. N.; Koziel, J. A.; Grotenhuis, T.; Carlsen, L.; Anal. Chim. Acta 2010, 674, 32.
2. Lopyrev, V. A.; Dolgushin, G. V.; Voronkov, M. G.; Russ. J. Appl. Chem. 1998, 71, 1295.
3. Diekmann, J.; Biefel, C.; Rustemeier, K.; J. Chromatogr. Sci. 2002, 40, 509.
4. Malone, H. E.; The Determination of Hydrazino-Hydrazine Groups, 1st ed.; Pergamon Press Ltd.: Oxford, 1970.
5. Mo, J. W.; Ogorevc, B.; Zhang, X. J.; Pihlar, B.; Electroanalysis 2000, 12, 48.
6. Lv, J.; Huang, Y.; Zhang, Z.; Anal. Lett. 2001, 34, 1323. 7. Safavi, A.; Karimi, M. A.; Talanta 2002, 58, 785.
8. Mori, M.; Tanaka, K.; Xu, Q.; Ikedo, M.; Taoda, H.; Hu, W.; J. Chromatogr. A 2004, 1039, 135.
9. Ensafi, A. A.; Naderi, B.; Microchem. J. 1997, 56, 269. 10. Afkhami, A.; Zarei, A. R.; Talanta 2004, 62, 559.
11. Zare, H. R.; Shishehbore, M. R.; Nematollahi, D.; Tehrani, M. S.; Sens. Actuators, B 2010, 151, 153.
12. Yang, H.; Lu, B.; Guo, L.; Qi, B.; J. Electroanal. Chem. 2011, 650, 171.
13. Abbaspour, A.; Khajehzadeh, A.; Ghaffarinejad, A.; J. Electroanal. Chem. 2009, 631, 52.
14. Afzali, D.; Karimi-Maleh, H.; Khalilzadeh, M. A.; Environ. Chem. Lett. 2011, 9, 375.
15. Rastakhiz, N.; Kariminik, A.; Soltani-Nejad, V.; Roodsaz, S.; Int. J. Electrochem. Sci. 2010, 5, 1203.
16. Stetter, J. R.; Tellefsen, K. A.; Talanta 1979, 29, 799. 17. Itaya, K.; Uchida, I.; Neff, V. D.; Acc. Chem. Res. 1986, 19,
162.
18. Kaneko, M.; Hara, S.; Yamada, A.; J. Electroanal. Chem. 1985, 194, 165.
19. Mingotaud, C.; Lafuente, C.; Amiell, J.; Delhaes, P.; Langmuir 1999, 15, 289.
20. Karyakin, A. A.; Electroanalysis 2001, 13, 813.
21. Ricci, F.; Palleschi, G.; Biosens. Bioelectron. 2005, 21, 389.
22. Bai, J.; Qi, B.; Ndamanisha, J. C.; Guo, L.-P.; Microporous Mesoporous Mater. 2009, 119, 193.
23. Zhao, W.; Xu, J. J.; Shi, C. G.; Chen, H. Y.; Langmuir 2005, 21, 9630.
24. Salazar, P.; Martin, M.; Roche, R.; O’Neill, R. D.; Gonzalez-Mora, J. L.; Electrochim. Acta 2010, 55, 6476.
26. Zhang, L.; Song, Z.; Zhang, Q.; Jia, X.; Zhang, H.; Xin, S.; Electroanalysis 2009, 21, 1835.
27. Li, Z.; Chen, J.; Li, W.; Chen, K.; Nie, L.; Yao, S.; J. Electroanal. Chem. 2007, 603, 59.
28. Adhoum, N.; Monser, L.; Sens. Actuators, B 2008, 133, 588. 29. Adekunle, A. S.; Ozoemena, K. I.; Electroanalysis 2010, 22,
2519.
30. Wang, C.; Zhang, L.; Guo, Z.; Xu, J.; Wang, H.; Shi, H.; Zhai, K.; Zhuo, X.; Electroanalysis 2010, 22, 1867.
31. Scharf, U.; Grabner, E. W.; Electrochim. Acta 1996, 41, 233. 32. Senthil Kumar, S. M.; Chandrasekara Pillai, K.; Electrochim.
Acta 2009, 54, 7374.
33. Xing, S.; Xu, H.; Shi, G.; Chen, J.; Zeng, L.; Jin, L.; Electroanalysis 2009, 21, 1678.
34. Boyer, A.; Kalcher, K.; Pietsch, R.; Electroanalysis 1990, 2, 155.
35. Abbaspour, A.; Kamyabi, M. A.; J. Electroanal. Chem. 2005, 584, 117.
36. Pournaghi-Azar, M. H.; Dastangoo, H.; J. Electroanal. Chem. 2004, 573, 355.
37. Wang, J.; Lu, Z.; Electroanalysis 1989, 1, 517.
38. Michlmayr, M.; Sawyer, D. T.; J. Electroanal. Chem. 1969, 23, 375.
39. Eisner, U.; Zommer, N.; J. Electroanal. Chem. 1971, 30, 433. 40. Andrieux, C. P.; Saveant, J. M.; J. Electroanal. Chem. 1978,
93, 163.
41. Bard, A. J.; Faulkner, L.; Electrochemical Methods Fundamentals and Application, vol. 1, 2nd ed.; John Wiley & Sons: New York,
2001.
Submitted: October 13, 2014