VARIABILITY OF EXTREME CLIMATE INDICES AT RIO CLARO, SÃO PAULO, BRAZIL
CARLOS ANTONIO COSTA DOS SANTOS
1, PRAKKI SATYAMURTY
2, OSEAS MACHADO GOMES
1,
LUCIA ELIANE MARIA GULARTE DA SILVA
31
UNIVERSIDADE FEDERAL DE CAMPINA GRANDE, UNIDADE ACADÊMICA DE CIÊNCIAS
ATMOSFÉRICAS (UFCG/UACA), CAMPINA GRANDE, PB, BRAZIL
2
UNIVERSIDADE DO ESTADO DO AMAZONA (CESTU), MANAUS, AM, BRAZIL
3
INSTITUTO NACIONAL DE METEOROLOGIA (INMET), BRASÍLIA, DF, BRAZIL
[email protected], [email protected], [email protected], [email protected]
Received July 2011 - Accepted march 2012
ABSTRACT
Linear trends in climate extreme indices derived from precipitation and temperature data at the Rio Claro station, São Paulo-Brazil, are examined for the 40-year period 1966-2005 and the dataset is available at the Instituto de Pesquisas Meteorológicas (IPMET) of the State University of São Paulo (UNESP). The precipitation based climate indices did not show statistically signiicant trends. When
correlated with the SST related indices in the Paciic and Atlantic Oceans, the analysis shows some weak but positive inluence of El Niño and the TNAI (Tropical North Atlantic Index) over the rainfall
behavior of the Rio Claro region. Overall, the temperatures are rising in the last 40 years with an indication of increasing the diurnal temperature range, especially in the recent past due to an increase in the maximum temperature.
Keywords: Climate change, extreme climate indices, sugarcane, El Niño
RESUMO: VARIABILIDADE DOS ÍNDICES DE EXTREMOS CLIMÁTICOS EM RIO CLARO, SÃO PAULO, BRASIL
Foram examinadas tendências lineares nos índices de extremos climáticos derivados de dados de precipitação e temperatura para a estação meteorológica de Rio Claro, São Paulo – Brasil, para o período de 1966 – 2005, correspondente a 40 anos e os dados estão disponíveis no Instituto de Pesquisas Meteorológicas (IPMET) da Universidade do Estado de São Paulo (UNESP). Os índices
climáticos baseados na precipitação não mostraram tendências com signiicância estatística. Quando correlacionados com os índices relacionados à TSM dos Oceanos Pacíico e Atlântico, as análises mostram inluência fraca, mas positiva do El Niño e TNAI (Tropical North Atlantic Index) sobre
o comportamento das chuvas sobre a região de Rio Claro. De forma geral, as temperaturas estão aumentando nos últimos 40 anos com um sinal de aumento na amplitude térmica diária, especialmente nos últimos anos devido ao aumento das temperaturas máximas.
Palavras-chave: Mudanças climáticas, índices de extremos climáticos, cana-de-açúcar, El Niño.
1. INTRODUCTION
The topic of climate change is occupying the minds of many scientists in the world due to the unfortunate prospect of an irreversible change from the contemporary climate to a climate to which the human beings are not accustomed to. A mere possibility, however feeble it may be, of an unwanted increase in global mean temperature due to the changes in the composition of the atmosphere and vegetative cover is frightening. In the
last 20 years there have been many observational and modeling studies on the topic of climate change (IPCC, 2007). All these studies point to an increasing trend in temperature (ex. Karl et al., 1993). Investigations of climate change in Brazil were concentrated in the Amazon region (ex. Nobre et al., 1991, Marengo, 2004) and such studies for other regions of Brazil are also important.
shape of their statistical distribution (Toreti and Desiato, 2008) and knowledge of climate extremes is important for everyday life and plays a critical role in the management of situations of emergency. The study of climate change using climate extremes can be tackled using a set of suitable indices which completely describe the extremes of climatic variables.
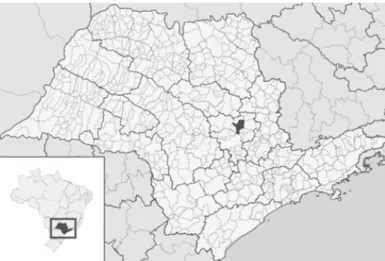
To fully establish climate changes at a place, observed atmospheric data for periods of the order of 100 years are necessary (IPCC, 2007). Not many stations have long period data, especially in Brazil. By scrutiny of the meteorological data sets in the state of São Paulo, available at the Instituto de Pesquisas Meteorológicas (IPMET) of the State University of São Paulo (UNESP), we found that the city of Rio Claro (160 km northwest of São Paulo) has temperature and rainfall data since 1966. The data sets are continuous without gaps. These sets
of data are analyzed to ind if there are any perceptible changes
in the last 40 years. Rio Claro is situated in the middle of a vast agriculturally highly productive area of the size of Portugal in Brazil. It is rich with sugarcane crops and orange groves. One of the fears is that changes in the climate may cause migration of the agricultural activity to other parts of Brazil or the continent (Assad et al., 2004).
The key objectives of this work are to detect the trends of extreme precipitation in Rio Claro, São Paulo from 1966 to 2005 using a selection of eight extreme indices, to detect the trends of the annual and seasonal (dry and wet) maximum and minimum temperature and Diurnal Temperature Range (DTR) for Rio Claro applying the Mann–Kendall test, and to obtain the correlations between the precipitation indices and the Sea
Surface Temperature (SST) anomalies of Equatorial Paciic (Niños 1+2, 3, 3.4 and 4 regions), Tropical North Atlantic
Index (TNAI) and Tropical South Atlantic Index (TSAI) to a
better understanding of the inluence of the SST in the climate
of the study area.
2. METHODOLOGY
Monthly maximum and minimum surface air temperatures and daily precipitation data were taken from the meteorological station located at Rio Claro, São Paulo/Brazil, for the period of 1966 to 2005. The station location is shown in Figure 1. The datasets underwent a rigid quality control, because indices of extremes are sensitive to changes in station, exposure, equipment, and observer practices (Haylock et al., 2006). Data
Quality Control (QC) is a prerequisite for determining climatic
indices. The quality control followed the following steps: 1) Replace all missing values (currently coded as -99.9) to NA (not available), and 2) Replace all unreasonable values into NA. Such values include daily precipitation amounts less than zero or very high values of precipitation (daily value higher than 500 mm) and very low values of minimum and high values of maximum temperature (less than 0ºC or higher than 45ºC, respectively).
After of the QC application was excluded less than 10% of the
precipitation and temperature data.
In this study the RClimdex software (Zhang and Yang, 2004) is used to obtain the climatic extremes indices, associated with precipitation data, following methodologies of Zhang et al. (2005) and Haylock et al. (2006). This software can be downloaded from the ETCCDI website (http://cccma.seos. uvic.ca/ETCCDI/). RClimdex provides eight indices based on precipitation data (Table 1) that better explain the climate of a
given location. Exact deinitions of all the indices are available
from the ETCCDI website.
The rainy season in Rio Claro is the four-month period Dec-Jan-Feb-Mar and the dry season is May-Jun-Jul-Aug. Trends of the precipitation indices were calculated for the period 1966 – 2005. Linear trend analyses were performed for all rainfall indices used in the study. The slopes of the linear trends
are calculated by least squares itting. Since a normal frequency
∑
∑
+ = − = − = n k j k j n k x x S 1 1 1 ) sgn( (1) 18 ) 5 2 )( 1 ( ) 5 2 )( 1 ( )var(
=1+ − − + − = m i i i
i e e
e n n n S (2) ) var( 1 S S Zc − = 0 = c Z ) var( 1 S S Zc = +
(3)
distribution may not necessarily it very well to indices data, a
non-parametric Mann-Kendall test (Sneyers, 1990) is used to
identify whether or not trends are signiicant. The method is
simple and robust, and it also has the advantage of being able to deal with missing values.
The null hypothesis (H0) states that the deseasonalized data (x1, x2,…, xn) is a sample of n independent and identically distributed random variables. The null hypothesis that standard normal variable (Zc)is not statistically signiicant or has no
signiicant trend is accepted if −Z1−p/2 ≤ Zc≤ Z1−p/2, where Z1−p/2
is the standard normal deviate and p is the signiicance level
for the test. Or, Zcis statistically signiicant if Zc < −Z1−p/2 or if
Zc > Z1−p/2 (Xu et al., 2005; Bae et al., 2008; Im et al., 2010).
Kendall’s statistic (S)is computed as follows:
The variance of S is given by
where, xj, xkare sequential data values; n is the length of the dataset; m is the number of tied groups; and eiis the size of the
ith tied group. Zcis obtained as follows: (S>0)
(S=0) (S<0)
Positive values of Zcindicate increasing trends while negative Zc shows decreasing trends. When testing either
increasing or decreasing monotonic trends at a signiicance
level p, the null hypothesis was rejected for absolute value of
Zcgreater than Z1-p/2 (Partal and Kahya, 2006). In this study,
signiicance level p of 0.05 is applied.
Linear trends analyses were performed for the mean annual and seasonal (dry and wet) values of maximum and minimum temperature calculated for the period 1966 – 2005. The slopes of the linear trends are calculated by least squares
itting.
The correlations between the precipitation indices and the Sea Surface Temperature (SST) anomalies of Equatorial
Paciic (Niños 1+2, 3, 3.4 and 4 regions), Tropical North Atlantic
Index (TNAI) and Tropical South Atlantic Index (TSAI) are
obtained through the use of Pearson Correlation Coeficient
method. 3. RESULTS
The statistical trends of precipitation indices used in this study are shown in Table 2. No trend in the Table shows
statistical signiicance at 5% level. However, the results show
increasing trends in the precipitation events: maximum amount of 1 and 5 days precipitations, numbers of heavy and very heavy precipitation (> 20mm and > 50 mm, respectively) days, and
annual total precipitation. This inding is in agreement with
Dufek and Ambrizzi (2008). The highest trends are observed in the R50mm (Figure 2a) and Rx5day (Figure 2b) indices with trends of 1.223 days year-1 and 1.049 mm year-1 (Table
2), respectively. The indices deinitions are shown in Table 1.
These results show that the number of days with precipitation in excess of 50 mm is increasing at a rate of approximately 12 days per 10 years and that the amount of precipitation in 5 consecutive days is increasing at a rate of approximately 10 mm
Indices Name Definition Units
Rx1day Max 1-day precipitation amount Monthly maximum 1-day precipitation mm
Rx5day Max 5-day precipitation amount Monthly maximum consecutive 5-day
precipitation
mm
R10mm Number of heavy precipitation days Annual count of days when
PRCP>=10mm
Days
R20mm Number of very heavy precipitation
days
Annual count of days when PRCP>=20mm
Days
R50mm Number of days with precipitation
above 50mm
Annual count of days when PRCP>=50mm
Days
CDD Consecutive dry days Maximum number of consecutive days
with RR<1mm
Days
CWD Consecutive wet days Maximum number of consecutive days
with RR>=1mm
Days
PRCPTOT Annual total wet-day precipitation Annual total PRCP in wet days
(RR>=1mm)
mm
per 10 years. Consecutive dry and wet days (CDD and CWD,
respectively) show no trend or very slight decreasing trends. Overall the results indicate an increasing of the precipitation at Rio Claro; however, these results do not have statistical
signiicance as discussed previously.
Table 3 presents the correlations between SST anomalies of Equatorial Pacific and Tropical Atlantic Oceans and
precipitation indices. It can be seen that only the Nino 1+2 and Nino 3 SSTs inluence positively the heavy precipitation events
(R10mm, R20mm and R50mm) and the total precipitation
(PRCPTOT) at Rio Claro, as well as, they inluence negatively
the consecutive dry days (CDD), all these correlations have
shown statistical signiicance at 5% level. These are important
results for the forecasters of the heavy precipitation events of the region around Rio Claro.
Annual and seasonal (dry and wet) maximum and minimum temperature trends at Rio Claro, São Paulo are shown in Table 4. Unlike the precipitation based indices,
many temperature based indices present signiicant trends. The annual maximum temperature presents signiicant increase (at 5% level) as shown in Figure 3 of 0.119 °C in 40 years. The annual minimum temperature also presents a small increase
but with no statistical signiicance. Surprisingly, after 2000 the
maximum air temperature increased and minimum temperature decreased, thus the diurnal temperature range (DTR) showed a considerable increase of 0.103°C (Figure 3). As this trend is
very recent it is dificult to attribute concrete reasons for this
behavior. Studies have shown that temperature extremes are changing in South America (Vincent et al., 2005; Marengo and Camargo, 2007) with no consistent pattern except for a
signiicant nighttime warming.
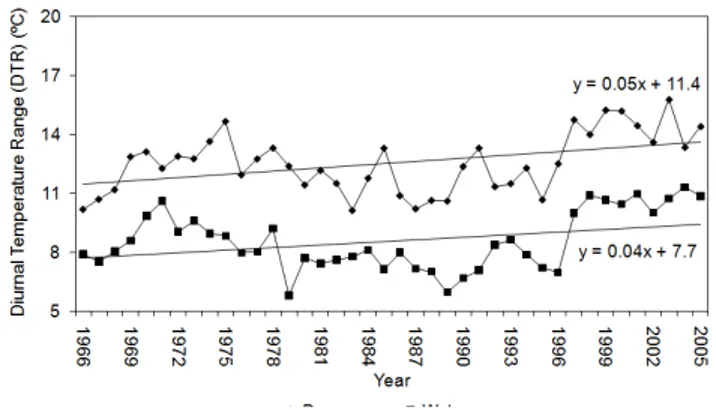
The seasonal maximum and minimum temperature are shown in Figure 4 and their trends are given in Table 4. The main difference between the dry and wet seasons lies in the minimum temperature, the wet season minimum temperature being warmer than the dry season minimum by about 10°C. This happens because of two reasons: wet season at Rio Claro coincides with summer and cloudy nights, in general, present warmer minimum temperatures. The trends are all positive and higher in the dry season than in the wet season. The maximum temperature trends are higher than the minimum temperature trends and as a consequence the diurnal temperature range Figure 2 - Time series of precipitation indices (Rx5day and R50mm)
between 1966 and 2006 at Rio Claro, São Paulo. Dashed line is linear trend line.
Indices Trend p-value
Rx1day 0.116 0.907
Rx5day 1.049 0.294
R10mm 0.164 0.870
R20mm 0.198 0.843
R50mm 1.223 0.220
CDD -0.023 0.981
CWD -0.225 0.822
PRCPTOT 0.408 0.683
Table 2 - Statistical trends of precipitation indices used in this study.
INDICES CDD CWD R10mm R20mm R50mm Rx1day Rx5day PRCPTOT Niño 1+2 -0.354* 0.089 0.417* 0.376* 0.261* 0.251 -0.016 0.403*
Niño 3 -0.362* 0.066 0.285* 0.241 0.261* 0.143 0.014 0.286*
Niño 3.4 -0.295* 0.071 0.133 0.086 0.212 0.070 0.023 0.158
Niño 4 -0.213 0.063 -0.019 -0.034 0.199 0.026 0.074 0.056
TNAI -0.256 0.209 -0.083 0.073 0.188 0.051 0.266* 0.050
TSAI 0.096 0.070 -0.151 -0.110 0.005 -0.057 0.082 -0.069
Table 3 - Correlations between SST anomalies of Equatorial Paciic and Tropical Atlantic Oceans and precipitation indices.
(DTR) shows a signiicant positive trend, especially in the
dry season (Figure 5). These results indicate that, overall the temperatures are rising in the last 40 years with an indication of increasing DTR, especially in the recent past.
4. CONCLUSIONS AND DISCUSSION
The Rio Claro station near São Paulo has a well consisted and uninterrupted series of daily temperature and precipitation observations since 1966. One important aspect is that the station location has not changed during the period of study. Therefore the series is judged to be suitable for examining the climate behavior of the region the station represents.
The precipitation based climate indices did not show
statistically signiicant trends (Table 2). However, the 5-day
accumulated rainfall (Rx5day) and the number of very heavy rainy days (R50mm) present weak positive trends, in agreement with the contemporary idea that severe weather events are
becoming more frequent. When correlated with the SST related indices in the Paciic and Atlantic Oceans, positive, though weak, correlations are obtained between Nino 1+2 and
Nino 3 SST anomalies and the heavy and very heavy rainfall event precipitations (Table 3). This is an interesting result for the forecasters of the region. The Northeast and the Southern Regions of Brazil are known to have strong affects of the El Nino phenomenon, Northeast having negative and South Brazil
having positive inluences. The meteorologists have few clues about the inluence of ENSO phenomenon over the transition
region situated in between the two regions. The results shown here may provide some useful information. The Tropical
North Atlantic Index (TNAI) also shows a positive inluence on the number wet days (CWD) and the 5-day accumulated rainfall (Rx5day) at Rio Claro. Niño 3.4, Niño 4 and TNAI
SST anomalies have a negative effect on the consecutive dry
Figure 3 - Time series of annual temperature (maximum, minimum and DTR) at Rio Claro, São Paulo. Dashed lines are linear trend lines.
Figure 4 - Time series of seasonal (dry and wet) maximum and minimum temperature at Rio Claro, São Paulo.
Linear trend Annual (1966 – 2006)
T max 0.119*
T min 0.016
DTR 0.103*
Seasonal (1966 – 2006)
T max (Dry) 0.069*
T min (Dry) 0.014
T max (Wet) 0.093*
T min (Wet) 0.049*
DTR (Dry) 0.055*
DTR (Wet) 0.043*
Table 4 - Linear trends of the annual and seasonal (dry and wet) maximum and minimum temperature and Diurnal Temperature Range (DTR) at Rio Claro, São Paulo.
* Statistical signiicant at 5% level.
Figure 5 - Time series of Diurnal Temperature Range (DTR) during the dry and wet seasons at Rio Claro, São Paulo.
days (CDD). Thus, the analysis shows some weak but positive
inluence of El Nino and the TNAI over the rainfall behavior
of the Rio Claro region.
Many climate indices based on the temperature
observations show signiicant positive trends during the last
in Argentina, studies by Rusticucci and Barrucand (2004) and Rusticucci and Renom (2008) showed that the daily maximum
and minimum temperature had a signiicant positive trend at
many stations. The results presented here are yet one more confirmation of the global warming pattern. If the trend continues the evapotranspiration over the croplands around Rio Claro region increases and more water is necessary for maintaining the productivity. The slight positive trend in the precipitation compensates the evaporative losses.
5. ACKNOWLEDGEMENTS
We are grateful to the Instituto de Pesquisas
Meteorológicas (IPMET) of the Universidade Estadual de São Paulo (UNESP), Baurú, SP, for the datasets.
6. REFERENCES
ASSAD E. D., PINTO H. S., JUNIOR J. Z., ÁVILA A. M. H. Climatic changes impact in agroclimatic zonning of coffee in Brazil. Pesquisa Agropecuária Brasileira, v. 39, p. 1057-1064, 2004.
BAE, D. H., JUNG I. W., CHANG, H. Long-term trend of
precipitation and runoff in Korean river basins. Hydrological processes, v.21, p. 2644–2656, 2008.
BERLATO, M. A., BIDEGAIN, M., CORONEL, G., GARCIA, V. J., GRIMM, A. M., KAROLY, D., MARENGO, J. A., MARINO, M. B., MONCUNILL, D. F., NECHET,
D., QUINTANA, J., REBELLO, E., RUSTICUCCI, M.,
SANTOS, J. L., TREBEJO, I., VINCENT, L. A. Trends in total and extreme South American rainfall 1960-2000 and links with sea surface temperature. Journal of Climate, v. 19, p. 1490-1512, 2006.
BROWN, S. J., CEASAR, J., FERRO, C. A. T. Global
changes in extreme daily temperature since 1950. Journal of Geophysical Research, v. 113, 2008. DOI: 10.1029/2006JD008091.
DUFEK, A. S., AMBRIZZI, T. Precipitation variability in São Paulo State, Brazil. Theoretical and Applied Climatology, v. 93, p. 167-178, 2008.
IM, E. S., JUNG, I. W., BAE, D. H. The temporal and spatial
structures of recent and future trends in extreme indices over Korea from a regional climate projection. International Journal of Climatology, 2010. DOI: 10.1002/joc.2063. IPCC, Intergovernmental Panel on Climate Change. Climate
change 2007: The physical science basis, summary for policy makers. IPCC, Geneva, Switzerland, 2007.
KARL, T. R., JONES, P. D., KNIGHT, R. W., KUKLA,
G., PLUMMER, N., GALLO, V. R., LINDSEAY, J.,
CHARLSON, R. J., PETERSON, T. C. A new perspective on recent global warming: Asymmetric trends in maximum and minimum temperature. Bulletim of American Meteorological Society, v. 74, p. 1007-1023, 1993. MARENGO, J. A., CAMARGO, C. C. Surface air temperature
trends in Southern Brazil for 1960–2002. International Journal of Climatology, v. 28, p. 893–904, 2008.
MARENGO, J. A. Interdecadal variability and trends of rainfall across the Amazon Basin. Theoretical and Applied Climatology, v. 78, p. 79-96, 2004.
NOBRE, C. A., SELLERS, P. J., SHUKLA, J. Amazonian deforestation and regional climate change. Journal of Climate, v. 4, p. 957-988, 1991.
PARTAL, T., KAHYA, E. Trend analysis in Turkish precipitation data. Hydrological Processes, v.20, p. 2011–2026, 2006. RUSTICUCCI, M., BARRUCAND, M. Observed trends and
changes in temperature extremes over Argentina. Journal of Climate,v. 17, p. 4099–4107, 2004.
RUSTICUCCI, M., RENOM, M. Variability and trends in indices of quality-controlled daily temperature extremes in Uruguay. International Journal of Climatology, v. 28, p. 1083–1095, 2008.
SNEYERS, R. On the Statistical Analysis of Series of Observations. Technical Note No. 143, WMO No. 415
World Meteorological Organization: Geneva. 1990.
TORETI, A., DESIATO, F. Changes in temperature extremes over Italy in the last 44 years. International Journal of Climatology, v. 28, p. 733-745, 2008.
VINCENT, L. A., PETERSON, T. C., BARROS, V. R., MARINO, M. B., RUSTICUCCI, M., CARRASCO, G., RAMIREZ, E., ALVES, L. M., AMBRIZZI, T., BERLATO, M. A., GRIMM, A. M., MARENGO, J. A., MOLION, L., MONCUNILL, D. F., REBELLO, E., ANUNCIAÇÃO,
Y. M. T., QUINTANA, J., SANTOS, J. L., BAEZ, J.,
CORONEL, G., GARCIA, J., TREBEJO, I., BIDEGAIN, M., HAYLOCK, M. R., KAROLY, D. Observed trends in indices of daily temperature extremes in South America 1960–2000. Journal of Climate, 18, p. 5011–5023, 2005. XU, Z. X., TAKEUCHI, K., ISHIDAIRA, H., LI, J. Y.
Long-term trend analysis for precipitation in Asian Paciic
FRIEND river basins. Hydrological Processes, v. 19, 3517–3532, 2005.
ZHANG, X., HEGERL, G., ZWIERS, F. W., KENYON,
J. Avoiding inhomogeneity in percentile-based indices of temperature extremes. Journal of Climate, v. 18, p. 1641–1651, 2005.