Trends in Extreme Climate Indices for Pará State, Brazil
Carlos Antonio Costa dos Santos, Verônica Gabriella de Oliveira
Unidade Acadêmica de Ciências Atmosféricas, Universidade Federal de Campina Grande,
Campina Grande, PB, Brazil.
Received in May 8, 2015 – Accepted in May 30, 2016
Abstract
The present study aimed to analyze trends in air temperature and rainfall for 13 locations in the state of Pará using nonparametric tests. Daily data of maximum and minimum air temperatures and precipitation covering the period 1970-2006, collected by the Instituto Nacional de Meteorologia (INMET) have been used. From the results obtained it was observed that the number of warm days and nights per year has increased, thereby providing a significant reduction in the number of cool days and nights in the state. Due to the high space-time variability of precipitation, few localities showed statistically significant trends for indices of extremes dependent on this variable. The days and nights in Belém have been hotter in the last two decades. Therefore, these results are important for future planning of public health and energy for the state of Para, which must adapt to future warming scenarios sectors.
Keywords:RClimdex, Mann-Kendall, climatology.
Tendência de Índices de Extremos Climáticos para o Estado do Pará, Brasil
Resumo
O presente estudo teve como objetivo analisar as tendências da temperatura do ar e precipitação em 13 localidades do estado do Pará, para isso foram utilizados dados diários das temperaturas máxima e mínima do ar e precipitação compreendendo o período de 1970 a 2006, coletados pelo Instituto Nacional de Meteorologia (INMET) e testes estatísticos não paramétricos. Através dos resultados obtidos foram observados que, o número de dias e noites quentes por ano tem aumentado, proporcionando assim uma redução significativa dos dias e noites frias sobre o estado. Devido à alta variabilidade espaço-temporal da precipitação, poucas localidades apresentaram tendências estatisticamente signifi-cativas para os índices de extremos dependentes dessa variável. Os dias e as noites na cidade de Belém têm sido mais quentes nas últimas duas décadas. Logo, esses resultados encontrados são importantes para o planejamento futuro dos gestores públicos nos setores de saúde pública e energético para o estado do Pará, os quais deverão se adequar aos cenários futuros de aquecimento.
Palavras-chavesRClimdex, Mann-Kendall, climatologia.
1. Introduction
The society, economy and environment are impacted by the extreme weather or climate events. Thus, an initial step for studies involving the climate change impact is the analysis of extreme indices (Sharma and Babel, 2014). Many studies, such as Aguilaret al.(2005), Vincentet al.
(2005), Alexanderet al.(2006), Haylocket al.(2006),
Ma-rengoet al. (2009), Marengoet al. (2010) have revealed
that significant changes in some climate variables have taken place in the South America over the last century. However, it is necessary to have a better understanding about the behavior of some climate variables in local scale.
Aguilaret al.(2005) analyzing climate change
indi-ces of daily precipitation and temperature, over the 1961-2003 period in Central America and northern South Amer-ica, observed that these indices reveal a general warming trend in the region. They found that extreme warm maxi-mum and minimaxi-mum temperatures have increased while extremely cold temperature events have decreased. Addi-tionally, the precipitation indices analyzed indicate no sig-nificant increases in the total amount, but rainfall events are intensifying and the contribution of wet and very wet days are enlarging. An examination of the trends over 1960-2000 in the indices of daily temperature extremes in South
Revista Brasileira de Meteorologia,v. 32, n. 1, 13-24, 2017 rbmet.org.br DOI: http://dx.doi.org/10.1590/0102-778632120150053
Article
America has been shown by Vincentet al.(2005). Their
re-sults indicate no consistent changes in the indices based on daily maximum temperature while significant trends were found in the indices based on daily minimum temperature. Moreover, it was observed significant increasing trends in the percentage of warm nights and decreasing trends in the percentage of cold nights at many stations and, the authors explained that this warming is mostly due to more warm nights and fewer cold nights during the summer and fall.
Marengoet al.(2009) used the PRECIS regional
cli-mate modeling system to study the distribution of extremes of temperature and precipitation in South America in the re-cent past (1961-1990) and in a future (2071-2100). It was found that in all the future climate scenarios considered all parts of the region would experience significant and often different changes in rainfall and temperature extremes, as well as, in the future, the occurrence of warm nights will be more frequent in the entire tropical South America while the occurrence of cold night events is likely to decrease. Similarly, significant changes in rainfall extremes and dry spells have been projected, including increasing intensity of extreme precipitation events over western Amazonia which is in agreement with the projected increasing trends in total rainfall in this region.
Moraeset al.(2005) evidenced that studies on the
cli-matology of precipitation in the State of Pará (eastern Amazonia) are essential for the planning of agricultural ac-tivities. Furthermore, as described above, studies on the cli-matology of temperature are also important for this region, especially for the State of Pará which has its agriculture stands out for crop production of rice, beans, maize and cas-sava that are mainly controlled by the amount and distribu-tion of precipitadistribu-tion and temperature. Coxet al.(2004) and
Liet al.(2006) show that some global circulation models
suggest that Amazon may be vulnerable to extreme drought in response to movement of dislocations caused by global warming, which can cause loss of tropical forests, with po-tential acceleration of global warming. It is known that the hydrological cycle of the Amazon region is of great impor-tance (Marengoet al., 2008) because the region plays an
important role in the functioning of regional and global cli-mate. Its changes can affect the atmospheric moisture trans-port from the Amazon region to adjacent regions (Marengo
et al., 2008).
The Expert Team on Climate Change Detection, Monitoring and Indices (ETCCDMI), sponsored by WMO (World Meteorological Organization) Commission for Cli-matology (CCI) and the Climate Variability and Predict-ability Project (CLIVAR) has developed a set of indices that represents a common guideline for regional analysis of climate. The indices describe particular characteristics of extremes, including frequency, amplitude and persistence. The core set includes 27 extremes indices for temperature and precipitation (Klein Tanket al., 2009).
This research aims to analyze the temporal trends and spatial distribution of precipitation and temperature ex-treme climate indices for the State of Pará. The study area in the eastern part of the Amazon is the most vulnerable to changes in climate, and certainly the impact of these changes in hydrology and biodiversity in the region may be larger than those expected in South and Southeast of Brazil. Additionally, there is no study by using this methodology to obtain the spatial-temporal behavior of the extreme climate indices for the study area by using observed daily precipita-tion and temperature dataset.
2. Material e Methods
2.1. Study area and data
The study area is the State of Pará which is located on the eastern edge of the northern region of Brazil (Fig. 1). Table 1 presents the geographic coordinates of the weather stations used in this study. The Pará State has an area of 1.247.954,666 km2, representing 14.7% of the entire
na-tional territory and according to the 2010 census, its popu-lation is approximately 7.581.051 inhabitants (IBGE, 2013). Guyana, Suriname, French Guiana and the state of Amapa are to the north of Para State, Atlantic Ocean to the east, Maranhão to the southeast, Tocantins to the south-west, Roraima to the northwest and the capital of the state being Belem. Amazon river passes through the state of Pará from west to east and discharges into the Atlantic Ocean.
The dataset of daily air temperature and precipitation for the period 1970 to 2006 from 13 weather stations pro-vided by the National Institute of Meteorology (INMET) has been used.
To simplify the terms of the indices of climate ex-treme events, proposed by Expert Team on Climate Change Detection, Monitoring and Indices (ETCCDMI) of the World Meteorological Organization (WMO) applied to lo-cal studies, it was decided to lo-calculate them through RClimdex which is a software developed by Xuebin Zhang and Feng Yang from the Canadian Meteorological Service (Zhang and Yang, 2004). It was used to obtain the climate extreme indices following the method of Zhang et al.
(2005a,b) and Haylocket al.(2006).
and seasonal trends were obtained by the Least Squares Method.
Signs of trends in climate extreme indices and their statistical significance were analyzed using the nonpara-metric Mann-Kendall (Mann, 1945; Kendall, 1975), the statisticSof Mann-Kendall test can be calculated according to Eq. (1):
S sign xj xk j k n k n = -= + =
-å
å
( )1 1 1
(1)
The signal can be calculated according to the Eqs. (2), (3) and (4):
sign x( j -xk)=1if xj -xk >0 (2) sign x( j -xk)=0if xj -xk =0 (3)
sign x( j -xk)= -1if xj -xk <0 (4)
The statisticS is close to the normal asn increases.
The mean and variance are defined in Eqs. (5) and (6).
E S( )=0 (5)
Var S n n n i t i ii i
m
( )= ( -1 2)( +5)-
å
= ( )( -1 2)( +5)18
1 (6)
The statistical testZ(t) is used to calculate the trend of
a time series and can be obtained according to the Eq. (7).
Z t
S
Var S S
S S
Var S S
( ) ( ), , ( ), = -> > + < ì í ï ï ï î ï ï 1 0 0 0 1 0 if if if ï (7)
The null hypothesis of no trend,H0is rejected
when-everZ(t) >Za/2 whereais the significance level andZa/2
is the normal variable reduced of the standard normal distri-bution function, for values (Z(t) > 0) increasing trends and
for values of (Z(t) < 0) decreasing trends (Santos and
Portella, 2008). For values of p£0.05 statistically signifi-cant trend at 5% significance level and p£0.01 statistically significant trend at 1% significance level.
3. Results and Discussion
3.1. Temperature indices
From Table 3 it can be seen that the number of warm nights (TR) increased in twelve locations and reduced in only one (São Félix do Xingu). Of the twelve locations that showed increasing trends in the number of warm nights in
Trends in Extreme Climate Indices for Pará State, Brazil 15
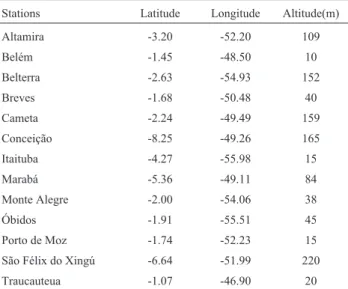
Figura 1- a) Location of the study area on the map of Brazil and b) spatial distribution of weather stations in the state of Pará.
Tabela 1- Geographical coordinates of 13 locations in the state of Pará.
Stations Latitude Longitude Altitude(m)
Altamira -3.20 -52.20 109
Belém -1.45 -48.50 10
Belterra -2.63 -54.93 152
Breves -1.68 -50.48 40
Cameta -2.24 -49.49 159
Conceição -8.25 -49.26 165
Itaituba -4.27 -55.98 15
Marabá -5.36 -49.11 84
Monte Alegre -2.00 -54.06 38
Óbidos -1.91 -55.51 45
Porto de Moz -1.74 -52.23 15 São Félix do Xingú -6.64 -51.99 220
the year with temperatures above 20 °C, nine have statisti-cal significance at 5% level. The maximum monthly
amount of daily maximum temperature (TXx) showed nine locations with increasing trends, but only two are
statisti-Tabela 2- Definition of climatic extreme indices depending on temperature and precipitation used in this study.
Indices Name Definition Units
SU Summer Days Annual count when TX(daily maximum) > 25 °C Days ID Iced Days Annual count when TX(daily maximum) < 0 °C Days TR Tropical Nights Annual count when TN(daily minimum) > 20 °C Days FD Frost Days Annual count when TN(daily minimum) < 0 °C Days GSL Growing Season Length Annual (1stJan to 31stDec) count between first span of at least 6 days with
mean temperature > 5 °C and first span after July 1 of 6 days with mean temperature < 5 °C
Days
TXx Max Tmax Monthly maximum value of daily maximum temperature °C TNx Max Tmin Monthly maximum value of daily minimum temperature °C TXn Min Tmax Monthly minimum value of daily maximum temperature °C TNn Min Tmin Monthly minimum value of daily minimum temperature °C WSDI Warm Spell Duration Indicator Annual count of days with at least 6 consecutive days when TX > 90th
percentile
Days
CSDI Cold Spell Duration Indicator Annual count of days with at least 6 consecutive days when TN < 10th percentile
Days
DTR Diurnal Temperature Range Monthly mean difference between TX and TN °C Rx1day Max 1-day precipitation amount Monthly maximum 1-day precipitation mm Rx5day Max 5-day precipitation amount Monthly maximum consecutive 5-day precipitation mm SDII Simple daily intensity index Annual mean precipitation when PRCP³1.0 mm mm R10mm Number of heavy precipitation days Annual count of days when PRCP³10 mm Days R20mm Number of heavy precipitation days Annual count of days when PRCP³20 mm Days R50mm Number of heavy precipitation days Annual count of days when PRCP³50 mm Days CDD Consecutive dry days Maximum number of consecutive days with RR < 1 mm Days CWD Consecutive wet days Maximum number of consecutive days with RR³1 mm Days
R95p Very wet days Annual total PRCP when RR > 95p mm
R99p Extremely wet days Annual total PRCP when RR > 99p mm PRCPTOT Annual total wet-day precipitation Annual total PRCP in wet days (RR³1 mm) mm
Tabela 3- Trends in climatic extreme indices of temperature for 13 locations in the state of Pará, for the period 1970-2006.
Stations SU (day) TR (day) TXx (°C) TXn (°C) TNx (°C) TNn (°C) DTR (°C)
Altamira -0.03 0.20 0.09 0.03 0.06 -0.01 0.05
Belém 0.00 0.69 0.00 0.05 0.02 0.10 -0.02
Belterra 0.16 4.02 0.00 0.06 0.01 0.12 -0.03
Breves -0.01 4.02 0.01 0.02 0.04 0.13 -0.10
Cametá -0.01 0.01 0.03 0.04 0.02 0.04 -0.01
Conceição do Araguaia 0.08 5.54 0.05 -0.02 0.06 0.23 -0.08
Itaituba 0.24 1.70 -0.03 0.03 0.01 0.23 -0.04
Marabá 0.07 4.98 0.08 0.02 0.05 0.14 -0.02
Monte Alegre -0.01 3.41 -0.12 0.01 0.04 0.35 -0.10
Óbidos -0.10 8.34 -0.20 -0.03 -0.02 0.30 -0.18
Porto de Moz 0.01 2.60 -0.02 0.04 0.04 0.12 -0.06
São Félix do Xingú 0.13 -7.68 0.01 0.06 -0.11 0.12 0.07
Trends in Extreme Climate Indices for Pará State, Brazil 17
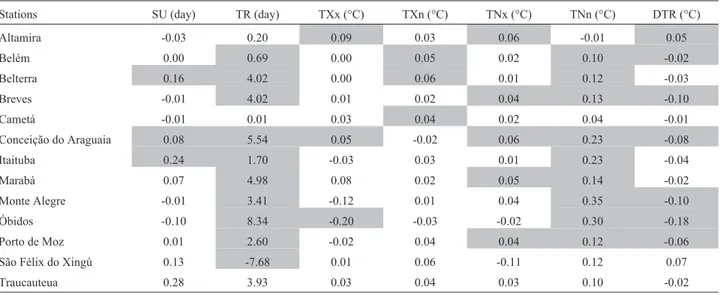
Figura 2- Spatial variability of trends in extreme climate indices dependent of daily maximum and minimum temperatures for the state of Pará, for the period 1970 to 2006, where: a) SU, b) TR, c) TXx, d) TXn, e) TNx, f) TNn and g) DTR. The symbols correspond to (+) increasing trend not statistically significant, (+) increasing trend with statistical significance (O) decreasing trend not statistically significant and (•) decreasing trend with statistical
cally significant and, four sites were identified with reduc-tion trends, however, only one locality has statistical signif-icance.
Similarly, the minimum monthly amount of daily maximum temperature (TXn) presented eleven locations with increasing trends, with only three statistically signifi-cant and two stations with decreasing trends, but without statistical significance. Analyzing the maximum monthly value of daily minimum temperature (TNx) is observed eleven locations showing increasing trends, five with statis-tical significance. Two locations showed negative trends, but without statistical significance. The index that repre-sents the minimum monthly amount of daily minimum temperature (TNn) showed predominantly increasing trends over the study period. Twelve stations showed posi-tive trends and nine of these were statistically significant. Due to higher magnitudes of the trends occurring in TNn,
i.e., the minimum temperature, daily temperature range
(DTR) showed trends predominantly negative in eleven lo-cations, six with statistical significance.
From the temperature extremes indices used in this study, there is a trend of increasing temperature for the state of Pará, with more emphasis on the daily minimum temper-ature that occurs at night, as shown in the indexes TR and TNn the nights in Pará State have become warmer in recent decades. In general for all locations used in the study a sig-nificant trend of increasing temperature was observed such changes characteristics in the thermal patterns of the envi-ronment studied can be read by the change in the space around the weather stations as a result of the dynamics of urban occupation, or natural environmental conditions due to weather events. However, the environmental heating phenomenon is of concern with regard to the biological processes of plants and animals, and already associated with transmitting vectors of tropical diseases that affect the Northern region of Brazil. Regarding the increase in ambi-ent temperature, it can be inferred that the most pronounced increase in minimum temperatures considerably reduce the daily temperature range (DTR) of the environment, a fact that can also strengthen pathogens and restrict crops that have greater thermal vulnerability.
These results are in agreement with the trends pattern showed in others studies developed by using the same methodology, however for continental or global scale such as Alexanderet al.(2006) which study the global observed
changes in daily climate extremes of temperature and pre-cipitation and Aguilar et al. (2005) which analyzed the
changes in precipitation and temperature extremes in Cen-tral America and northern South America for the period of 1961-2003.
In Figs. 2a to 2g are described spatial distributions of extreme temperature indices for the State of Pará. Figures 2a and 2b show the indices SU and TR, respectively, it is possible to see that the increasing trend of hot days (Fig. 2a) is more present in the southwest region of the State, this can
be explained by the continental effect,i.e., it is not the
di-rect effect of continental, but their indidi-rect effects of the vulnerability of these areas produces changes in their eco-systems faster and more intense than coastal areas. Another cause of this increase is the local effects associated with the land use change and cover. Particularly, in the North of Brazil where the climate is humid and hot, this more grad-ual increase in temperature can cause impacts on water de-mand in the region due to the increase of evapotranspiration and/or creating heat islands in the municipalities included in the region.
However the greatest indicator of temperature in-crease in the State of Pará is seen from Fig. 2b, which shows increase of the warm nights with temperatures exceeding 20 °C. The area has a higher increasing trend is in the north-west of the State. According to the IBGE (2014), there is an area of agricultural expansion in this region; the change in the natural landscape can be justification for such increase.
With regard to extreme temperatures for both maxi-mum (Fig. 2c), and minimaxi-mum values (Fig. 2d) showed no trend,i.e., normal, because the maximum temperature re-cords tend to stay around the average. As can be seen in Fig. 2c and 2d, the larger trend values are observed in the central region of the State and the lowest in the northwest.
Analysis of the extremes of daily minimum monthly temperature, the maximum values (Fig. 2e) show two dis-tinct nuclei one in the central-south with decreasing trend, but without statistical significance and other in the north with increasing trend. From Fig. 2f, which gives the ex-treme values of minimum temperature increasing trends are seen in almost of the entire state with the exception ofnorth central region where there is a decreasing trend. Increasing minimum temperatures may indicate environmental heat-ing, especially in the night hours as was seen in Fig. 2b.
Finally, analyzing Fig. 2g, which presents the daily temperature range, a significant increase in temperature is seen in the central part of the State of Pará, practically all locations used in this study were found to decrease the tem-perature range except in Altamira. This factor can be re-lated to the gradual increase in minimum temperature records caused by changes in environmental surface char-acteristics derived from human activities.
3.2. Precipitation indices
Table 4 shows trends in extreme climate indices of precipitation for 13 locations around the State of Pará, for the period 1970-2006, such indices did not show indica-tions of precipitation changes in the studied locaindica-tions. It was found that the indices (RX5day, R10mm, R50mm, R95p and PRCPTOT) do not present any statistical signifi-cance. However, some locations have positive trend values, such as SDII (0.05 mm/year) and R20mm (0.26 days/year) for Belém and CDD (0.65 days/year) for Belterra.
that showed decreasing trend in the order of -1.72 mm/day. Directly related to rainfall patterns in the state of Pará it is possible to associate the decrease in wet consecutive days (CWD) for Óbidos, São Félix do Xingu and Traucauteua which achieved statistical significance, this fact may repre-sent an environmental drying trend, thus decreasing the probability of the occurrence of rainfall. Additionally, the R99p index showed the value of -8.55 mm/day, indicating the reduction of extremely wet days.
Alexander et al. (2006) studying global observed
changes in daily climate extremes of temperature and pre-cipitation, Aguilaret al. (2005) analyzing the changes in
precipitation and temperature extremes in Central America and northern South America for the period of 1961-2003 and Haylocket al.(2006) observing the trends in total and
extreme South American rainfall in 1960-2000 and links with Sea Surface Temperature found results that in some cases are in agreement with those found in this study. The reasons for some differences are in the fact the each study used different dataset, period of data and statistical treat-ment.
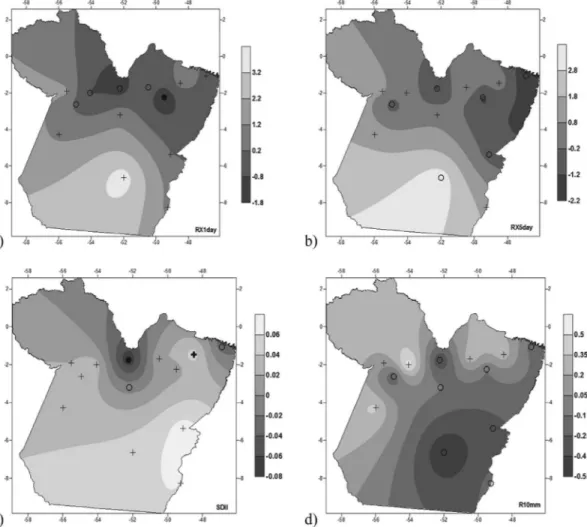
Based on Fig. 3a representing the maximum rate of rainfall in one day (Rx1day) it is possible to see that only in northeastern Pará (Cametá) a negative trend was identified with statistical significance at 5% level. For all other re-gions of the state both positive and negative trends with no statistical significance were identified. Whereas in Fig. 3b, the maximum precipitation on 5 consecutive days (Rx5day) did not show any statistical significant trend. The analysis of the SDII index (Fig. 3c) showed an increase in the northeastern State and a decrease in the north-central area, both with statistical significance. The number of days with precipitation higher than 10 mm (R10mm) shown in Fig. 3d was not statistically significant.
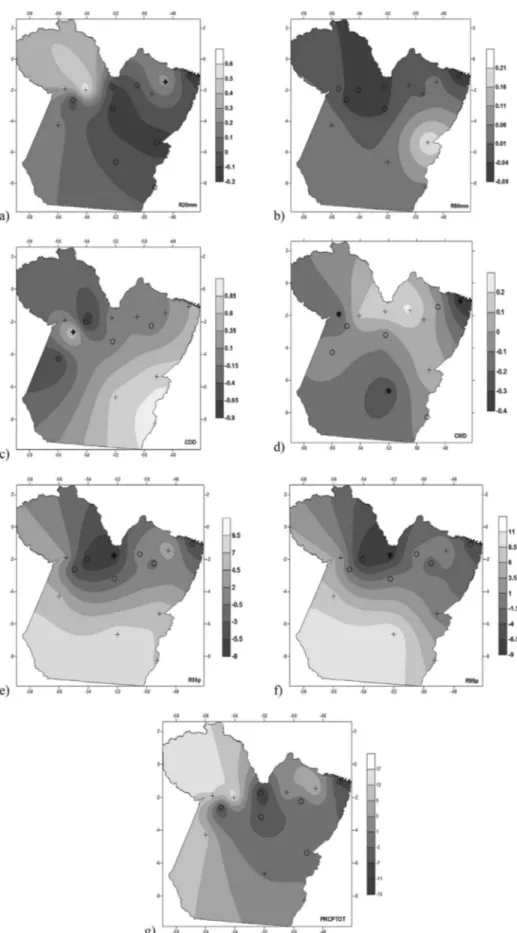
According to the index R20mm, the number of days with precipitation above 20 mm, it can be observed from Fig. 4a, an increasing trend in the north north-east of the state. The index R50mm, the number of days with precipi-tation above 50 mm, did not show any trend in all locations studied (Fig. 4b). Analysis of the index CDD, consecutive dry days, from Fig. 4c, it is possible to detect an indication of positive trend in the west-central region of the state.
In the consecutive wet days index (CWD) (Fig. 4d), it is observed that there exists a greater number of locations with negative trends in comparison with other indices stud-ied and are located in the south, northwest and northeast re-gions of Pará state. In the behavior of very wet days index (R95p) (Fig. 4e) it is noted that there is no statistically sig-nificant tendency. Figure 4f illustrates the extremely wet days (R99p), which is part of the six indices that had some statistical trend, it presents a significant decreasing trend at 5% level, located in the northern region of the State, specif-ically in Porto de Moz. Finally, the analysis of Fig. 4g rep-resenting total annual precipitation (PRCPTOT), as well as, RX5day, R10mm, R50mm and R95p indices showed no statistically significant trends.
3.3. Seasonal extreme indices for Belém
The seasonal behavior of 11 indices of climate ex-tremes of temperatures and precipitation for the city of Belém-PA (Table 5), for the period 1970-2006, were ana-lyzed. The value of the minimum daily minimum tempera-ture (TNn) had increased in all seasons of the year during the study period. In Table 5 it is observed that the annual magnitudes of the trends were 0.046 °C, 0.055 °C, 0.056 °C and 0.048 °C for the summer, autumn, winter and spring seasons, respectively. Similar configuration was observed for the seasonal behavior of the maximum value of daily
Trends in Extreme Climate Indices for Pará State, Brazil 19
Tabela 4- Trends in climatic extreme indices of precipitation for 13 locations in the state of Pará, for the period 1970-2006.
Stations Rx1day (mm) Rx5day (mm) SDII (mm) R10mm (dias) R20mm (day) R50mm (day) CDD (day) CWD (day) R95p (mm) R99p (mm) PRCPTOT (mm)
Altamira 0.84 0.41 -0.01 -0.09 -0.15 -0.05 -0.07 -0.07 -2.33 -0.45 -5.44
Belém 0.57 0.47 0.05 0.30 0.26 0.03 0.05 -0.01 4.09 0.66 9.00
minimum temperature (TNx) showed no statistically sig-nificant trend except for spring. Observing the seasonal variability of the minimum monthly amount of daily maxi-mum temperature (TXn), it is possible to note that in sum-mer and autumn there was no significant trend unlike the winter and spring seasons that showed positive trend. Note that all indices described above show increasing trends in all seasons for the city of Belém, especially the TNn that is statistically significant in all seasons. These results show that the days and nights in Belém tend to be warmer in the coming decades, which will result in an increasing water and energy demand, and may trigger public health prob-lems such as increase in cases of parasites and vectors of disease and heat waves.
Regarding the seasonal behavior of TN10p, TN90p and TX10p indices (Table 5), it is possible to identify pre-dominant increasing trends with statistical significance in all seasons, except TX10p in summer season. The index, TN10p, showed a statistically significant decreasing trend for all stations. In the summer season the reduction was
-1.116 days/year, -1.023 days/year in the fall, -1.090 days/year in the winter and -1.085 days/year in the spring. The index for warmer nights (TN90p) showed an increase in all seasons, where the values of trends were 0.649 days/year in the summer, 0.657 days/year in the fall, 0.878 days/year in winter and 0.754 days/year in the spring. As-sessing the seasonal behavior of the coldest days (TX10p), it is observed that autumn, winter and spring reduced the number of days with moderate temperatures, obtaining the values -0.317 days/year, -0.369 days/year and -0.351 days/year, respectively. These results corroborate those presented for the TNn, TNx and TXn indices.
Regarding TXx, TX90p, DTR, RX1day and RX5day indices which are showed in Table 5, only the daily temper-ature range (DTR) has a decreasing trend (-0.026 °C/year) in the winter season, in the other indices and seasons there were no statistically significant trends.
The seasonal values of the trends of daily maximum and minimum temperature (TXx and TNn) showed increas-ing trends statistically significant at 5% level. Therefore,
Figura 3- Spatial variability of trends in extreme climate indices dependent of precipitation for the state of Pará, for the period 1970 to 2006, where: a) RX1day, b) RX5day, c) SDII, d) R10mm. The symbols correspond to (+) increasing trend not statistically significant, (+) increasing trend with statistical
Trends in Extreme Climate Indices for Pará State, Brazil 21
Figura 4- Spatial variability of trends in extreme climate indices dependent of precipitation for the state of Pará, for the period 1970 to 2006, where: a) R20mm, b) R50mm, c) CDD, d) CWD, e) R95p, f) R99p and g) PRCPTOT. The symbols correspond to (+) increasing trend not statistically significant, (+) increasing trend with statistical significance (O) decreasing trend not statistically significant and (•) decreasing trend with statistical significance, all
the maximum temperature is increasing seasonally, as seen in annual average analyzed in Table 5.
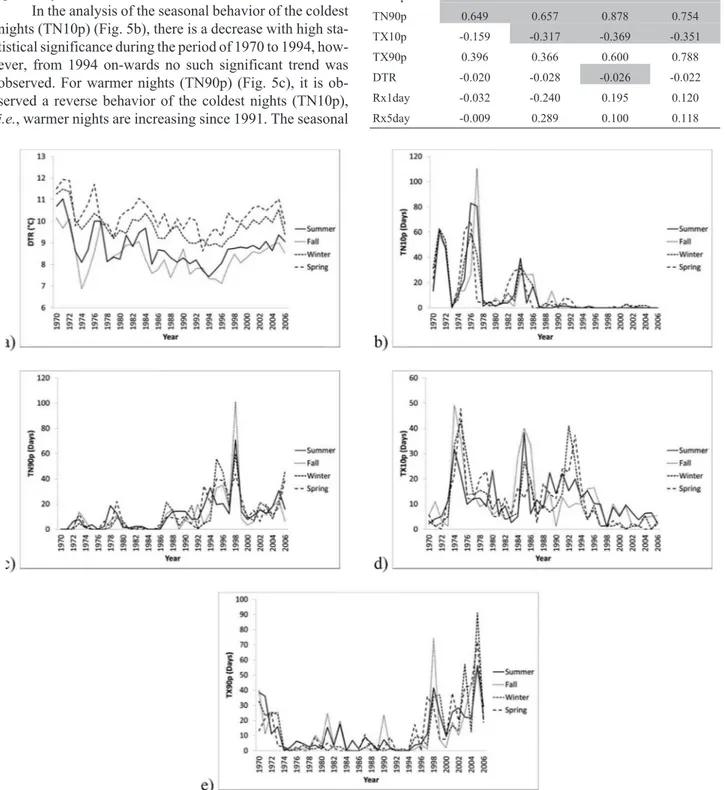
As the minimum and maximum temperatures showed increasing trends over the years and minimum tempera-tures experienced a greater increase, the daily temperature range (DTR) (Fig. 5a) was reduced at the rate of -0.020 °C/year, -0.028 °C/year, -0.026 °C/year and -0.022 °C/year for the summer, fall, winter and spring, re-spectively.
In the analysis of the seasonal behavior of the coldest nights (TN10p) (Fig. 5b), there is a decrease with high sta-tistical significance during the period of 1970 to 1994, how-ever, from 1994 on-wards no such significant trend was observed. For warmer nights (TN90p) (Fig. 5c), it is ob-served a reverse behavior of the coldest nights (TN10p),
i.e., warmer nights are increasing since 1991. The seasonal
Figura 5- Seasonal variability of climatic extreme indices statistically significant for the city of Belém-PA, for the period 1970 to 2006, where: a) DTR, b) TX10p, c) TX90p, d) TN10p, e) TN90p.
Tabela 5- Seasonal trends in climatic extremes indices of temperature and precipitation for the city of Belém, for the period 1970-2006.
Indices Summer Fall Winter Spring
TNn 0.046 0.055 0.056 0.048
TNx 0.039 0.038 0.038 0.034
TXn 0.029 0.026 0.040 0.042
TXx 0.004 0.011 0.014 0.023
values of the coldest days (TX10p) (Fig. 5d) show a reduc-tion in the number of days with moderate temperature dur-ing the year. Finally evaluatdur-ing the seasonality of hot days (TX90p) (Fig. 5e), it appears that in all seasons of the year there is an increase in the number of hot days. From Fig. 5, it is possible to identify that from 1990s to the present day there has been an intensification of extreme rates of air tem-perature over the city of Belém. This information is impor-tant for public managers to take initiatives, especially in the public health and energy sectors, making proper planning to scenarios that may arise in the coming decades. It is known that some global circulation models suggest that Amazon may be vulnerable to extreme drought in response to movement of dislocations caused by global warming (Coxet al., 2004 and Liet al., 2006), and with potential
ac-celeration of global warming it is possible to cause loss of tropical forests. Marengoet al.(2008) shows that the
hy-drological cycle of the Amazon region is of great impor-tance because the region plays an important role in the functioning of regional and global climate, and its changes can affect the atmospheric moisture transport from the Am-azon region to adjacent regions (Marengoet al., 2008)
4. Conclusions
For the first time, analysis of changes in temperature and precipitation extremes is available for Pará State. The trends of extreme temperature and precipitation indices are good indicators of extreme events. Thus, trend analysis can identify if in a certain region the extreme climate events are increasing or decreasing. According to the results observed for temperature and precipitation for the state of Pará, it can be concluded that:
1) There is a trend of increasing temperature for the state of Pará, with more emphasis on the daily minimum tem-perature that occurs at night, thus the nights in Pará State have become warmer in recent decades; 2) The spatial distributions of extreme temperature indices
for the State of Pará have identified that land use changes and cover, such as areas of agricultural ex-pansion,i.e.the change in the natural landscape, can be justification for increase in some temperature indi-ces in the study region;
3) The Pará State is clearly warming over the last decades and extremes of temperature are changing accord-ingly. Trends for the temperature indices show a large spatial coherence, with a moderate increase in daily maximum temperatures and a large increase in mini-mum temperatures. This results leads to a decrease of DTR.
4) The spatial coherence of precipitation indices was much lower. Nonsignificant trends of precipitation were found, with very mixed spatial patterns of positive and negative trends when individual stations were studied. 5) The seasonal behavior of the indices of climate extremes
of temperatures and precipitation for the city of
Belém-PA has shown that all indices presented in-creasing trends in all seasons, especially the TNn that is statistically significant in all seasons. Thus, the days and nights in Belém tend to be warmer in the coming decades, resulting in an increasing water and energy demand.
The results found in this study are important for un-derstanding the extreme climate indices and future plan-ning in the areas of public health and energy in the state of Para, which should suit to the scenarios of future warming, as well as, these results can contribute for validation of the regional modelling studies.
References
AGUILAR, E.; PETERSON, T.C.; RAMÍREZ OBANDO, P.; FRUTOS, R.; RETANA, J.A.; SOLERA, M.; SOLEY, J.; GONZÁLEZ GARCÍA, I.; ARAUJO, R.M.; ROSA SAN-TOS, A.; VALLE, V.E.; BRUNET, M.; AGUILAR, L.; ÁLVAREZ, L.; BAUTISTA, M.; CASTAÑÓN, N.; RERA, L.; RUANO, E.; SINAY, J.J.; SÁNCHEZ, E.; HER-NÁNDEZ OVIEDO, G.I.; OBED, F.; SALGADO, J.E.; VÁZQUEZ, J.L.; BACA, M.; GUTIÉRREZ, M.; CENTEL-LA, C.; ESPINOSA, J.; MARTÍNEZ, D.; OLMEDO, B.; OJEDA ESPINOZA, C.E.; NÚÑEZ, R.; HAYLOCK, M.; BENAVIDES, H.; MAYORGA, R. Changes in precipita-tion and temperature extremes in Central America and nor-thern South America, 1961-2003.Journal of Geophysical Research, v. 110, p. D23107, 2005.
ALEXANDER, L.V.; ZHANG, X.; PETERSON, T.C.; CAE-SAR, J.; GLEASON, B.; KLEIN TANK, A.M.G.; HAY-LOCK, M.; COLLINS, D.; TREWIN, B.; RAHIMZADEH, F.; TAGIPOUR, A.; RUPA KUMAR, K.; REVADEKAR, J.; GRIFFITHS, G.; VINCENT, L.; STEPHENSON, D.B.; BURN, J.; AGUILAR, E.; BRUNET, M.; TAYLOR, M.; NEW, M.; ZHAI, P.; RUSTICUCCI, M.; VAZQUEZ-AGUIRRE, J.L. Global observed changes in daily climate extremes of temperature and precipitation.Journal of Geo-physical Research, v. 111, p. D05109, 2006.
COX, P.M.; BETTS, R.A.; COLLINS, M.; HARRIS, P.P.; HUN-TINGFORD, C.; JONES, C.D. Amazonian forest dieback under climate-carbon cycle projections for the 21st century. Theorethical and Applied Climatology, v. 78, p. 137-156, 2004.
HAYLOCK, M.R.; PETERSON, T.C.; ALVES, L.M.; AMBRIZ-ZI, T.; ANUNCIAÇÃO, Y.M.T.; BAEZ, J.; BARROS, V.R.; BERLATO, M.A.; BIDEGAIN, M.; CORONEL, G.; GARCIA, V.J.; GRIMM, A.M.; KAROLY, D.; MAREN-GO, J.A.; MARINO, M.B.; MONCUNILL, D.F.; NECHET, D.; QUINTANA, J.; REBELLO, E.; RUSTICUCCI, M.; SANTOS, J.L.; TREBEJO, I.; VINCENT, L.A. Trends in total and extreme South American rainfall 1960-2000 and links with sea surface temperature. Journal of Climate, v. 19, p. 1490-1512, 2006.
KENDALL, M.G.Rank Correlation Methods. London: Charles Griffin, p. 120, 1975.
KLEIN TANK, A.M.G.; ZWIERS, F.W.; ZHANG, X. Guide-lines on Analysis of extremes in a changing climate in support of informed decisions for adaptation. Climate
Data and Monitoring, WCDMP-No. 72, World Meteorolog-ical Organization, 2009.
LI, W.; FU, R.; DICKINSON, E. Rainfall and its seasonality over the Amazon in the 21st century as assessed by the coupled models for the IPCC AR4. Journal of Geophysical Re-search, v. 111, p. D02111, 2006.
MANN, H.B. Nonparametric tests against trend.Econometrica, v.13, p.245-259, 1945.
MARENGO, J.A.; NOBRE, C.; TOMASELLA, J.; OYAMA, M.; SAMPAIO, G.; CAMARGO, H.; ALVES, L.M.; OLI-VEIRA, R. The drought of Amazônia in 2005.Journal of Climate, v. 21, p. 495-516, 2008.
MARENGO, J.A.; RUSTICUCCI, M.; PENALBA, O.; RENOM, M. An intercomparison of observed and simulated extreme rainfall and temperature events during the last half of the twentieth century: part 2: historical trends.Climatic Chan-ge, v. 98, p. 509-529, 2010.
MORAES, B.C.; COSTA, J.M.N.; COSTA, A.C.L.; COSTA, M.H. Variação espacial e temporal da precipitação no estado do Pará.Acta Amazonica, v. 35, p. 207-214, 2005. SHARMA, D.; BABEL, M.S. Trends in extreme rainfall and
tem-perature indices in the western Thailand. International Journal of Climatology, v. 34, p. 2393-2407, 2014. VINCENT, L.A.; PETERSON, T.C.; BARROS, V.R.; MARINO,
M.B.; RUSTICUCCI, M.; CARRASCO, G.; RAMIREZ, E.; ALVES, L.M.; AMBRIZZI, T.; BERLATO, M.A.;
GRIMM, A.M.; MARENGO, J.A.; MOLION, L.; MON-CUNILL, D.F.; REBELLO, E.; ANUNCIAÇÃO, Y.M.T.; QUINTANA, J.; SANTOS, J.L.; BAEZ, J.; CORONEL, G.; GARCIA, J.; TREBEJO, I.; BIDEGAIN, M.; HAYLOCK, M.R.; KAROLY, D. Observed trends in indices of daily temperature extremes in South America 1960-2000. Jour-nal of Climate, v. 18, p. 5011-5023, 2005.
ZHANG, X.; AGUILAR, E.; SENSOY, S.; MELKNYAN, H.; TAGHIYEVA, U.; AHMED, N.; KUTALADZE, N.; RAHIMZADEH, F.; TAGHIPOUR, A.; HANTOSH, T.H.; ALBERT, P.; SEMAWI, M.; ALI, M. K.; HALAL, M.; AL-SHABIBI, A.; AL-OULAN, A.; ZATARI, A.; AL DEAN KHALIL, I.; SAGIR, R.; DEMIRCAN, M.; EKEN, M.; ADIGUZEL, M.; ALEXANDER L,; PETERSON, T.C.; WALLIS, T.; Trends in Middle East climate extremes índices during 1930-2003. Journal of Geophysical Re-search-Atmospheres, v. 110, p. D22104, 2005a.
ZHANG, X.; HEGERL, G.; ZWIERS, F.W.; KENYON, J.; Avoi-ding inhomogeneity in percentile-based indices of tempera-ture extremes.Journal of Climate, v. 18, p. 1641-1651, 2005b.
ZHANG, X.; YANG, F.; RClimDex (1.0) User Guide.Climate Research Branch Environment Canada: Downsview, Ontario, Canada, 2004.