http://www.uem.br/acta ISSN printed: 1679-9275 ISSN on-line: 1807-8621
Doi: 10.4025/actasciagron.v37i1.18199
The influence of nonlinear trends on the power of the trend-free
pre-whitening approach
Gabriel Constantino Blain
Centro de Ecofisiologia e Biofísica, Instituto Agronômico, Cx. Postal 28, 13012-970, Campinas, São Paulo, Brazil. E-ma
ABSTRACT. The Mann-Kendall test has been widely used to detect trends in agro-meteorological as well as hydrological time series. Trend-free pre-whitening (TFPW-MK) is an approach that improves the performance of this test in the presence of serial correlation. The main goal of this study was to evaluate the ability of TFPW-MK to detect nonlinear trends. As a case study, this approach was also applied to 10-day values of precipitation (P), potential evapotranspiration (PE) and the difference between P and PE (P- PE) obtained from the weather station of Ribeirão Preto, State of São Paulo, Brazil. The results obtained from Monte Carlo simulations indicate that upward convex trends increase the power of this test, while upward concave trends decrease its power. The results obtained from the location of Ribeirão Preto reveal an increasing pressure on agricultural water management due to growing PE values. Thus, we conclude that the power of the TFPW-MK is affected by the shape of the trend and that the hypothesis of the absence of climate change in the abovementioned location cannot be accepted.
Keywords: Mann-Kendall, serial correlation, climate change.
Influência de trendências não lineares sobre o rigor da abordagem ‘trend-free
pre-whitening’
RESUMO. O teste de Mann-Kendall vem sendo largamente utilizado para detecção de tendências em séries agro-meteorológicas e hidrológicas. A abordagem denominada trend-free pre-whitening (TFPW-MK) foi desenvolvida para melhor o desempenho do mesmo na presença de correlação serial. Dessa forma, o objetivo principal deste estudo foi avaliar a habilidade do TFPW-MK em detectar tendências não lineares. Sob um estudo de caso, esse método foi também aplicado em series decendiais de precipitação pluvial (P), de evapotranspiração potencial (ETP) e da diferença P-ETP, pertencentes à localidade de Ribeirão Preto, Estado de São Paulo. Resultados obtidos a partir de simulações de Monte Carlo indicaram que tendências de elevação convexas e côncavas elevam e diminuem, respectivamente, o poder ou rigor do teste. Os resultados obtidos para a localidade de Ribeirão Preto revelam uma pressão crescente sobre o manejo agrícola de água devido a valores crescentes de ETP. Assim, conclui-se que o poder ou rigor do TFPW-MK é influenciado pela forma das tendências e que a hipótese de inexistência de alterações climáticas na região do estudo não pode ser aceita.
Palavras-chave: Mann-Kendall, correlação serial, mudança climática.
Introduction
The rank-based Mann-Kendall test (MK) has been widely used throughout the world to detect trends in agro-meteorological as well as hydrological time series. Considering only the period of 2002-2012, authors such as Yue et al. (2002), Burn and Elnur (2002), Adamowski and Bougadis (2003), Yue et al. (2003), Yue and Hashino (2003), Burn et al. (2004), Yue and Pilon (2004), Sansigolo (2008), Tabari and Talaee (2011), Blain (2010) Sansigolo and Kayano (2010), Blain (2011a, b and c), Minuzzi et al. (2011), Blain and Pires (2011), Streck et al. (2011), Back et al. (2012) and Blain (2012a and b) have used this statistical method to identify
possible signals of climate change in several parts of the globe. As described in Chandler and Scott (2011), the MK ‘has been used extremely widely in environmental studies’.
the reliability of this last (practical) interpretation, authors such as Von Storch and Navarra (1995), Hamed and Rao (1998) and Yue et al. (2002) have evaluated the performance of this trend test in the presence of serial correlations. From these important studies, we may infer that (i) the presence of positive serial correlations increases the variance of the MK test, which consequently may lead to a false rejection of a true H0 (VON STORCH; NAVARRA, 1995; YUE et al., 2002, among many others), and that (ii) the presence of trends alters the estimation of the serial correlation (YUE et al., 2002). Therefore, estimating and removing an auto-correlation coefficient from sample data prior to applying the MK test (a procedure called pre-whitening; PW) effectively removes the influence of this component on the occurrence of type I errors (BLAIN, 2012b; VON STORCH; NAVARRA, 1995; YUE et al., 2002). However, because this pre-whitening procedure may also remove part of an existing trend, it may lead to an increase in the occurrence of type II errors (FLEMING; CLARK, 2002; YUE et al., 2002). According to Önöz and Bayazit (2011), the use of the PW may lead to a reduction of the power of the test, so that a significant trend may not be detected.
After Yue et al. (2002) investigated the interaction between a serial correlated process and a linear trend, they demonstrated that removing the slope of the trend from the series before estimating the lag-1 auto-correlation coefficient provides a satisfactory estimate of the true serial correlation. Yue et al. (2002) accordingly developed an alternative algorithm (TFPW-MK; described in the following section) that is capable of improving the assessment of the significance of a trend in serial correlated series. According to Khaliq et al. (2009), the PW tends to be more conservative than the TFPW-MK in identifying stations with significant trends. Therefore, there is a possibility that stations with weak temporal signals could be overlooked by the PW (KHALIQ et al., 2009).
The TFPW-MK has been applied by authors such as Burn et al. (2008), Wu et al. (2008), Weng (2010), Yang et al. (2011) and Gao et al. (2012) to detect possible trends in stream flow, air temperature and rainfall series in different regions of the world. Shadmani et al. (2011) applied the TFPW-MK to detect trends in evapotranspiration series obtained from arid regions of Iran. After Önöz and Bayazit (2011) stated that the study of Yue et al. (2002) did not provide further information regarding the power of the TFPW-MK, Blain
(2012b) evaluated the ability of this algorithm to detect trends in (i) simulated series obtained from Monte Carlo experiments and (ii) 10-day values of the difference between precipitation and potential evapotranspiration (P-PE) obtained from a location at Campinas, State of São Paulo, Brazil. According to Blain (2012b), the TFPW-MK is more powerful than the PW. This last study advocated the use of the TFPW-MK to detect trends in agro-meteorological series.
However, it must be emphasized that “[…] there remains some controversy in the literature regarding the need to correct for serial correlation and as to the most appropriate approach for correcting for serial correlation […]” (BURN et al., 2008, p. 226). One may argue that the Monte Carlo experiments carried out by Blain (2012b) addressed only a particular case of monotonic trends: the linear shape. According to Yue and Pilon (2004), little attention has been given to the influence of nonlinear monotonic trends on the MK test. In addition, to the author’s knowledge, no attention has been given to the influence of nonlinear trends on the power of the TFPW-MK. Given that ‘a trend in nature might not be linear’ (YUE; PILON, 2004), we note that further studies are still required to assess the ability of the TFPW-MK to reject a (false) H0 under nonlinear trend conditions. In other words, the abovementioned statements have motivated us to investigate whether the power of the TFPW-MK is affected by the presence of nonlinear trends in auto-correlated series.
Considering this background, the main goal of this study was to investigate the ability of the TFPW-MK to detect nonlinear trends in series with different levels of serial correlations. For this purpose, we carried out sets of Monte Carlo simulations to (i) evaluate the power of the TFPW-MK to detect nonlinear trends with respect to its power to detect linear trends and (ii) to compare the power of the TFPW-MK to the power of the original MK when both tests are applied to uncorrelated data. As a case study, the TFPW-MK was also employed to evaluate the significance of trends in 10-day values of precipitation (P), in potential evapotranspiration (PE) and in the difference between P and PE obtained from the weather station of Ribeirão Preto, State of São Paulo, Brazil. It is expected that this study should provide a deeper understanding of the TFPW-MK by highlighting some of its strengths and weaknesses.
Material and methods
the records is 64 years (1953-2011). These series do not have missing data, and their consistencies were assessed in Blain (2011a and b). The Ribeirão Preto region is among the most important agricultural centers of Brazil. Ten-day PE values were obtained from the Temp series using Thornthwaite’s approach; further information about this method can be found in several studies, including Pereira et al. (2002). All hypothesis tests were performed at the 5% significance level.
Given a dataset X consisting of x values with sample size SS, the MK calculation starts by estimating the S statistic.
(
)
∑ ∑
− = =+ − = 1 1 1 sgn SS i SS i j j xi x S (1) where:As indicated in Mann (1945) and Kendall and Stuart (1967) when SS ≥ 8 the distribution of S approaches the Gaussian form with a mean E(S) = 0 and a variance V(S) given by:
(
)(
)
(
)(
)
18 5 2 1 5 2 1 )( = − + −
∑
=1 − +SS
m tim m m
SS SS SS S V (2) where:
ti is the number of ties of length m.
The statistic S is then standardized (equation 3), resulting in the MK final value. The significance of the MK statistic can be estimated from the normal cumulative distribution function.
< → +→ = > → − = 0 ) ( 1 0 0 0 ) ( 1 S s V S S S s V S MK (3) where:
The initial step of the TFPW-MK calculation is to estimate (equation 4) and remove the slope of the trend from the original series (step 1). The lag-1 auto-correlation coefficient is then estimated and removed from this ‘detrended’ series (step 2). The estimated slope is then superimposed onto this last series (referred to as a blended series; step 3). According to Yue et al. (2002), this blended series preserves an existing trend but is no longer influenced by the presence of significant serial correlations. Hereafter, these three steps will be referred to as the TFPW algorithm. Equations 1, 2 and 3 (the original MK test) are then applied to this blended series (step 4). The final result (steps 1 to 4)
is the TFPW-MK. Further information related to the TFPW-MK can be found in Yue et al. (2002). Positive (negative) MK and TFPW-MK values indicate the presence of increasing (decreasing) trends. − = b -a x x
Median a b
TSA
∀
b < a (4)where:
Equation 4 is frequently referred to as the Theil-Sen Approach or TSA (SEN, 1968) and is often used to estimate the slope of an existing trend. According to Yue et al. (2002), the time series should not be detrended if its TSA value is ‘almost equal to zero’ (YUE et al., 2002). In this case, the null hypothesis of no trend should be accepted. In this study, a non-significant TSA value was considered as being nearly equal to zero. The significance of each TSA value was evaluated using the bootstrap approach described in Yue and Pilon (2004). The number of bootstrapped samples required for constructing the related null distributions was set to 5000. The significance of the auto-correlation coefficients was evaluated as described in Wilks (2011).
The Monte Carlo simulations were based on equation 5.
xt=E(X) + r(xt-1 – E(X)) + ξt + T (5)
where:
E(X), r and T are, respectively, the mean, the lag 1 autocorrelation coefficient and the trend component of the generating process; ξt is a white noise process with zero mean and a variance equal to √[Var(X)*(1 -r2)]; and t represents the time unit, which varies from 1 to 100.
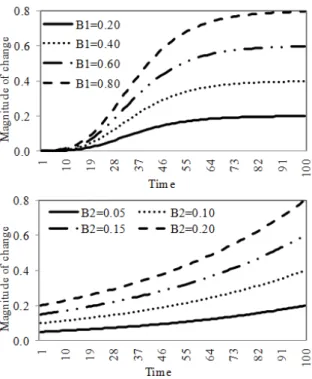
To evaluate the effect of the shape of the monotonic trends on the power of the TFPW-MK, we selected the nonlinear trends (T1 and T2) described in equations 6 and 7 and depicted in Figure 1. These eight trends were chosen by following Ratkowsky (1989) and Yue and Pilon (2004). It must be emphasized that Figure 1 is similar to Figure 7 presented in the study of Yue and Pilon (2004). The reading of this significant study is strongly recommended.
(
)
(
)
(
)
1/0.1 11 1
1 B *f(t) B 1 exp0.05- 0.075*t
T = = + (6)
(
0.025*t)
exp * B (t) f * B
T2= 2 2 = 2 (7)
where:
(YUE; PILON, 2004). From the adopted B1 and B2 values, the mean of the simulated process increases by 20, 40, 60, and 80% over the 100 time units (Figure 1). At this point, it is worth mentioning that the Monte Carlo experiments carried out in this study can be regarded as pure mathematical evaluations. However, these simulations were carried out concerning agrometeorological time series. Thus, we assumed that values of T that could lead to a magnitude of change greater than 80% would produce unrealistic (agrometeorological) results. By way of analogy with this consideration, the values of r were set to 0, 0.1, 0.2, and 0.4.
Figure 1. Different types of nonlinear trends adopted in this study.
The results obtained from the nonlinear trends depicted in Figure 1 were also compared with the results obtained from the linear trends (T3; Figure 2). These linear trends have the same magnitude of change of the nonlinear trends depicted in Figure 1.
The Monte Carlo simulations generated Ns=10000 time series for each r and T value. The TFPW-MK was applied to all series of the study.
Naturally, the original MK test was applied only to the uncorrelated datasets. By denoting the probability of occurrence of a type II error as β, the quantity 1- β is frequently referred to as "the power of the test". Given that all simulated series have a true trend, the power of the tests for each r and T value is simply the ratio between the
number of simulations in which the null hypothesis was rejected (Nrej) and Ns. These rejection rates were presented in percentage (100*Nrej Ns-1). As can be noted from Figures 1 and 2, only increasing trends were evaluated because the power of the tests is identical for both upward and downward trends (BLAIN, 2012b; YUE et al., 2002, YUE; PILON, 2004).
Figure 2. Different types of linear trends adopted in this study.
Results and discussion
As described in the introduction of this study, the H0 of the original MK assumes that the data can be taken as idd. Thus, the presence of serial correlation leads to false rejections of the hypothesis of no trend (FLEMING; CLARK, 2002; VON STORCH; NAVARRA, 1995; YUE et al., 2002, among many others). To avoid these false rejections, the TFPW algorithm manipulates the (original) data to meet the requirements of the original MK. The MK is then applied to these modified data (BURN et al., 2008; SHADMANI et al., 2011; YUE et al., 2002, WENG, 2010). According to this last statement and the purpose of this study, we note that the TFPW-MK must be as powerful as the original MK when both tests are applied to uncorrelated data that comprise a true trend (Figures 3 and 4; r = 0); otherwise, the TFPW algorithm may erroneously modify the original data, leading to false results.
Figure 3. Power of the original Mann-Kendall test obtained from the different types of nonlinear trends shown in Figures 1 and 2. The rejection rates were obtained by simulating 10000 series with uncorrelated data.
Figure 4. Power of the TFPW-MK test obtained from the different types of trends shown in Figures 1 and 2. The mean of the simulated process increases by 20 (a), 40 (b), 60 (c), and 80% (d) over the 100 time units. The rejection rates were obtained by simulating 10000 series with different levels of autocorrelations.
As described in Hamed (2009), the PW-MK is another algorithm that manipulates the (original) data to meet the requirements of the original MK test. However, as previously described, the PW algorithm may decrease the power of the test so that a true trend may not be properly detected (KHALIQ et al., 2009; ÖNÖZ; BAYAZIT, 2011, among others). The study of Blain (2012b) also indicates that the power of the PW-MK, under certain conditions, tends to be a decreasing function of the serial correlation. According to authors such as Khaliq et al. (2009) and Önöz and Bayazit (2011), the TFPW-MK was proposed to remedy this undesirable feature. From the results depicted in Figure 4, we may state that the power of the TFPW-MK was not affected by the different values of r. The rejection rates obtained from the serial correlated series (Figure 4; r = 0.1 to 0.4) were similar. These rejection rates were also similar to those obtained from both the TFPW-MK and MK
tests when r was set equal to zero (Figures 3 and 4). These last results allow us to assume that the TFPW algorithm successfully manipulated the auto-correlated data, meeting the requirements of the original MK test. This last consideration also holds for both linear and nonlinear trends.
According to Yue and Pilon (2004), for independent and identically distributed data, the power of the MK to detect trends is ‘somewhat sensitive to the shape of the trend’. The Monte Carlo experiments carried out by Yue and Pilon (2004) indicated that the upward concave shape had the lowest power, while the upward convex shape had the highest power. From the experiments carried out by Yue and Pilon (2004), one may also verify that the power of the MK appears to be more influenced by the magnitude of change superimposed over the entirely simulated period than by the shape of the trend. In general, similar conclusions can be drawn from the simulations carried out in this study for both TFPW-MK and MK. Indeed, after comparing the results depicted in Figure 4a and d, one may argue that the power of the TFPW-MK seems to have been more affected by the magnitude of the trend than by its shape. However, as can be noted for the cases in which the mean of the simulated process increased by 40 and 60% (Figure 2b and c), the effect of the shape of the trend on the power of the TFPW-MK cannot be neglected. For instance, by analyzing the results depicted in Figure 4c (r = 0.4), one may observe that the rejection rates varied from 65.5 (T1) to 96.4% (T2).
similarly affected by the different shapes of the trends adopted in this study.
Regarding the conditions in which the simulations were carried out, the results found in this study allow us to infer that the TFPW-MK is as powerful as the original MK when both tests are applied to uncorrelated data. These results also indicate that both tests have similar power under nonlinear trend conditions. Finally, the results depicted in Figure 4 indicate that the TFPW algorithm effectively limited the influence of different levels of autocorrelations on the power of the TFPW-MK. Given that agrometeorological series may comprise nonlinear trends and an autoregressive component, we decided to apply the TFPW-MK to detect trends in 10-day values of P, PE and P-PE obtained from the Ribeirão Preto, SP weather station (Table 1). For climate change impacts on agricultural water management, the proper assessment of the significance of trends in variables such as P-PE is, naturally, of great interest (BLAIN, 2012b).
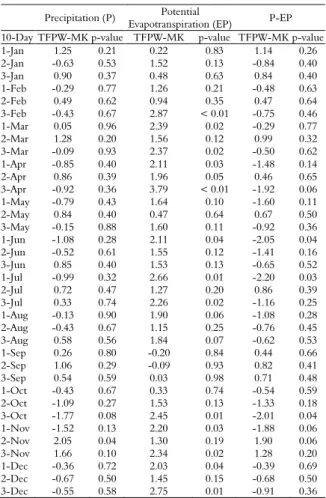
Table 1. Trend free pre-whitening Mann-Kendall test (TFPW-MK). Ribeirão Preto, State of São Paulo, Brazil (1953-2011).
Precipitation (P) Potential
Evapotranspiration (EP) P-EP 10-Day TFPW-MK p-value TFPW-MK p-value TFPW-MK p-value 1-Jan 1.25 0.21 0.22 0.83 1.14 0.26 2-Jan -0.63 0.53 1.52 0.13 -0.84 0.40 3-Jan 0.90 0.37 0.48 0.63 0.84 0.40 1-Feb -0.29 0.77 1.26 0.21 -0.48 0.63 2-Feb 0.49 0.62 0.94 0.35 0.47 0.64 3-Feb -0.43 0.67 2.87 < 0.01 -0.75 0.46 1-Mar 0.05 0.96 2.39 0.02 -0.29 0.77 2-Mar 1.28 0.20 1.56 0.12 0.99 0.32 3-Mar -0.09 0.93 2.37 0.02 -0.50 0.62 1-Apr -0.85 0.40 2.11 0.03 -1.48 0.14 2-Apr 0.86 0.39 1.96 0.05 0.46 0.65 3-Apr -0.92 0.36 3.79 < 0.01 -1.92 0.06 1-May -0.79 0.43 1.64 0.10 -1.60 0.11 2-May 0.84 0.40 0.47 0.64 0.67 0.50 3-May -0.15 0.88 1.60 0.11 -0.92 0.36 1-Jun -1.08 0.28 2.11 0.04 -2.05 0.04 2-Jun -0.52 0.61 1.55 0.12 -1.41 0.16 3-Jun 0.85 0.40 1.53 0.13 -0.65 0.52 1-Jul -0.99 0.32 2.66 0.01 -2.20 0.03 2-Jul 0.72 0.47 1.27 0.20 0.86 0.39 3-Jul 0.33 0.74 2.26 0.02 -1.16 0.25 1-Aug -0.13 0.90 1.90 0.06 -1.08 0.28 2-Aug -0.43 0.67 1.15 0.25 -0.76 0.45 3-Aug 0.58 0.56 1.84 0.07 -0.62 0.53 1-Sep 0.26 0.80 -0.20 0.84 0.44 0.66 2-Sep 1.06 0.29 -0.09 0.93 0.82 0.41 3-Sep 0.54 0.59 0.03 0.98 0.71 0.48 1-Oct -0.43 0.67 0.33 0.74 -0.54 0.59 2-Oct -1.09 0.27 1.53 0.13 -1.33 0.18 3-Oct -1.77 0.08 2.45 0.01 -2.01 0.04 1-Nov -1.52 0.13 2.20 0.03 -1.88 0.06 2-Nov 2.05 0.04 1.30 0.19 1.90 0.06 3-Nov 1.66 0.10 2.34 0.02 1.28 0.20 1-Dec -0.36 0.72 2.03 0.04 -0.39 0.69 2-Dec -0.67 0.50 1.45 0.15 -0.68 0.50 3-Dec -0.55 0.58 2.75 0.01 -0.91 0.36
In general, no remarkable climate trend was found in the P values (Table 1). For this
meteorological element, the only significant TFPW-MK value was found during the 2nd ten days of November. On the other hand, the PE obtained from the location of Ribeirão Preto seems to have been subjected to important climate changes. For this agrometeorological variable, significant increasing trends were found in 14 ten-day series. It is also worth emphasizing that a total of 34 of the 36 TFPW-MK values are associated with upward trend conditions. For the P-PE series, the TFPW-MK values observed during the 1st ten days of June and during the 3rd ten days of July and October are associated with p-values lower than 0.05. As can be noted from Table 1, these last three significant values are linked to non-significant decreasing trends observed in the P values and to significant increasing trends observed in the PE values. Similar to what was observed by Blain (2012b) for the weather Station of Campinas, the results presented in Table 1 do not allow us to accept the hypothesis of no climate change in the location of Ribeirão Pareto. These results also seem to reveal an increasing pressure on agricultural water management due to growing PE values.
Conclusion
The power of the TFPW-MK is affected by the shape of the trend: under nonlinear trend conditions, upward convex trends increase its power, while the presence of upward concave trends may lead to a significant loss of power.
Regarding the conditions in which the simulations were carried out, the results allow us to infer that the influence of nonlinear trends on the power of the TFPW-MK is more related to the calculation of the rank-based test than to the use of the algorithm that removes the influence of serial correlations on the trend evaluations.
The hypothesis of the absence of climate change in the location of Ribeirão Pareto cannot be accepted.
References
ADAMOWSKI, K.; BOUGADIS, J. Detection of trends in annual extreme rainfall. Hydrological Processes,
v. 17, n. 1, p. 3547-3560, 2003.
BACK, A. J.; BRUNA, E. D.; VIEIRA, H. J. Tendências climáticas e produção de uva na região dos Vales da Uva Goethe. Pesquisa Agropecuária Brasileira,v. 47, n. 4, p. 497-504, 2012.
BLAIN, G. C. Aplicação do conceito do índice padronizado de precipitação à série decendial da diferença entre precipitação pluvial e evapotranspiração potencial.
BLAIN, G. C. Considerações estatísticas relativas a seis séries mensais de temperatura do ar da secretaria de agricultura e abastecimento do Estado de São Paulo. Revista Brasileira de Meteorologia, v. 26, n. 2, p. 279-296, 2011b.
BLAIN, G. C. Cento e vinte anos de totais extremos de precipitação pluvial máxima diária em Campinas, Estado de São Paulo: análises estatísticas. Bragantia, v. 70, n. 3, p. 722-728, 2011c.
BLAIN, G. C. Monthly values of the standardized precipitation index in the State of São Paulo, Brazil: trends and spectral features under the normality assumption.
Bragantia, v. 71, n. 1, p. 122-131, 2012a.
BLAIN, G. C. Revisiting the probabilistic definition of drought: strengths, limitations and an agrometeorological adaptation. Bragantia, v. 71, n. 1, p. 132-141, 2012b. BLAIN, G. C. Séries anuais de temperatura máxima média do ar no Estado de São Paulo: variações e tendências climáticas. Revista Brasileira de Meteorologia,v. 25, n. 1, p. 114-124, 2010.
BLAIN, G. C.; PIRES, R. C. M.Variabilidade temporal da evapotranspiração real e da razão entre evapotranspiração real e potencial em Campinas, Estado de São Paulo.
Bragantia, v. 70, n. 2, p. 460-470, 2011.
BURN, D. H.; CUNDERLIK, J.; PIETRONIRO, A. Climatic influences on streamflow timing in the headwaters of the Mackenzie River Basin. Journal of Hydrology, v. 352, n. 1, p. 225-238, 2008.
BURN, D. H.; CUNDERLIK, J.; PIETRONIRO, A. Hydrological trends and variability in the Liard River basin. Hydrological Sciences, v. 49, n. 1, p. 53-67, 2004. BURN, D. H.; ELNUR, A. H. Detection of hidrological trends and variability. Journal of Hydrology, v. 255, n. 1, p. 107-122, 2002.
CHANDLER, R. E.; SCOTT, M. E. Statistical methods for trend detection and analysis in the environmental analysis. Chichester: John Wiley and Sons, 2011.
FLEMING, S. W.; CLARKE, G. K. C. Autoregressive noise, deserialization, and trend detection and quantification in annual river discharge time series.
Canadian Water Resources Journal, v. 27, n. 3, p. 335-354, 2002.
GAO, P.; GEISSEN, V.; RITSEMA, C.; MU, X. M.; WANG, F. Impact of climate change and anthropogenic activities on stream flow and sediment discharge in the Wei River basin, China. Hydrology and Earth System Sciences Discussions, v. 9, n. 1, p. 3933-3959, 2012. HAMED, K. H. Exact distribution of the Mann–Kendall trend test statistic for persistent data. Journal of Hydrology, v. 365, n. 1, p. 86-94, 2009.
HAMED, K. H.; RAO, R. A modified Mann-Kendall trend test for auto-correlated data. Journal of Hydrology, v. 204, n. 1, p. 182-196, 1998.
KENDALL, M. A.; STUART, A. The advanced theory of statistics. 2nded. Londres: Charles Griffin, 1967. KHALIQ, M. N.; OUARDA, T. B. M. J.; GACHON, P.; SUSHAMA, L.; ST-HILAIRE, A. Identification of hydrological trends in the presence of serial and cross
correlations: A review of selected methods and their application to annual flow regimes of Canadian rivers.
Journal of Hydrology, v. 368, n. 1, p. 117-130, 2009. MANN, H. B. Non-parametric tests against trend.
Econometrica, v. 13, n. 3, p. 245-259, 1945.
MINUZZI, R. B.; CARAMORI, P. H.; BORROZINO, E. Tendências na variabilidade climática sazonal e anual das temperaturas máxima e mínima do ar no Estado do Paraná. Bragantia, v. 70, n. 2, p. 471-479, 2011.
ÖNÖZ, B.; BAYAZIT, M. Block bootstrap for Mann– Kendall trend test of serially dependent data. Hydrogical Processes, v.26, n. 15, p. 1-19, 2011.
PEREIRA, A. R.; ANGELOCCI, L. R.; SENTELHAS, P. C. Agrometeorologia: fundamentos e aplicações práticas. Guaíba: Agropecuária, 2002.
RATKOWSKY, D. A. Handbook of nonlinear regression models.New York: Marcel Dekker, 1989. SANSIGOLO, C. A. Distribuições de extremos de precipitação diária, temperatura máxima e mínima e velocidade do vento em Piracicaba, SP (1917-2006). Revista Brasileira de Meteorologia, v. 23, n. 3, p. 341-346, 2008. SANSIGOLO, C. A.; KAYANO, M. T. Trends of seasonal maximum and minimum temperatures and precipitation in Southern Brazil for the 1913–2006 period.
Theoretical and Applied Climatology, v. 101, n. 101, p. 209-216, 2010.
SEN, P. K. Estimates of the regression coefficient based on Kendall’s tau. Journal of the American Statistical Association, v. 63, n. 1, p. 1379-1389, 1968.
SHADMANI, M.; MAROFI, S.; ROKNIAN, M. Trend analysis in reference evapotranspiration using Mann-Kendall and Spearman’s Rho tests in arid regions of Iran.
Water Resour Manage, v. 26, n. 1, p. 211-224, 2011. STRECK, N. A.; GABRIEL, L. F.; HELDWEIN, A. B.; BURIOL, G. A.; PAULA, M. G. Temperatura mínima de relva em Santa Maria, RS: climatologia, variabilidade interanual e tendência histórica. Bragantia, v. 70, n. 3, p. 696-706, 2011.
TABARI, H.; TALAEE, P. H. Recent trends of mean maximum and minimum air temperatures in the western half of Iran. Meteorology and Atmospheric Physics, v. 11, n. 3-4, p. 121-131, 2011.
VON STORCH, H.; NAVARRA, A. Analysis of climate variability: applications of statistical techniques. Berlin: Springer, 1995.
WENG, S. P. Changes of diurnal temperature range in Taiwan and their large-scale associations: univariate and multivariate trend analyses. Journal of the Meteorological Society of Japan, v. 88, n. 2, p. 203-226, 2010.
WILKS, D. S. Statistical methods in the atmospheric sciences. 3rd ed. San Diego: Academic Press, 2011. WU, H.; SOH, L.; SAMAL, A. Trend analysis of streamflow drought events in nebraska. Water Resour Manage, v. 22, n. 1, p. 145-164, 2008.
multimodel ensemble projections. Journal of Geophysical Research, v.116, n. 1, p. 1-18, 2011.
YUE, S.; HASHINO, M. Temperature trends in Japan: 1900-1996. Theoretical and Applied Climatology,
v. 75, n. 1, p. 15-27, 2003.
YUE, S.; PILON, P. A comparison of the power of the t test, Mann-Kendall and bootstrap tests for trend detection.
Hydrological Sciences Journal, v. 49, n. 49, p. 53-37, 2004. YUE, S.; PILON, P.; PHINNEY, B. Canadian streamflow trend detection: impacts of serial and cross-correlation. Hydrogical Sciences Journal, v. 48, n. 1, p. 51-64, 2003.
YUE, S.; PILON, P. J.; PHINNEY, B.; CAVADIAS, G. The influence of autocorrelation on the ability to detect trend in hydrological series. Hydrogical Processes, v.16, n. 16, p. 1807-1829, 2002.
Received on August 9, 2012. Accepted on December 27, 2012.