Quim. Nova, Vol. 33, No. 4, 984-987, 2010
N
ota
T
éc
ni
ca
*e-mail: elciooliveira@petrobras.com.br
INTERNAL STANDARD VERSUS EXTERNAL STANDARD CALIBRATION: AN UNCERTAINTY CASE STUDY OF A LIQUID CHROMATOGRAPHY ANALYSIS
Elcio Cruz de Oliveira*
PETROBRAS TRANSPORTE S.A., Gerência Geral de Engenharia, Av. Pres. Vargas, 328, 20091-060 Rio de Janeiro – RJ, Brasil Edson I. Muller, Fernanda Abad, Juliana Dallarosa e Cristine Adriano
Souza Cruz S.A., Av. Frederico Augusto Ritter, 8.000, 94930-000 Cachoeirinha – RS, Brasil Recebido em 22/9/09; aceito em 30/11/09, publicado na web em 8/4/10
Traditionally, in the cigarettes industry, the determination of ammonium ion in the mainstream smoke is performed by ion chromatography. This work studies this determination and compares the results of this technique with the use of external and internal standard calibration. A reference cigarette sample presented measurement uncertainty of 2.0 µg/cigarette and 1.5 µg/cigarette, with external and internal standard, respectively. It is observed that the greatest source of uncertainty is the bias correction factor and that it is even more signiicant when using external standard, conirming thus the importance of internal standardization for this correction.
Keywords: internal and external standard calibration; measurement uncertainty; bias correction factor.
INTRODUCTION
An internal standard in analytical chemistry is a chemical substance that is added in a constant amount to samples, the blank and calibration standards in a chemical analysis.1 This substance can be used for
cali-bration by plotting the ratio of the analyte signal to the internal standard signal as a function of the analyte standard concentration. This is done to correct analyte losses during sample preparation.2 The internal standard
is a compound that must be show similar behaviour to the analyte.3
This ratio for the samples is then used to obtain their analyte concentrations from a calibration curve. The internal standard used needs to provide a signal that is similar to the analyte signal in most ways but suficiently different so that the two signals are readily distinguishable by the instrument.
An external standard is like the internal standard (known beha-viour), but is not added to the unknown. Rather it is run alone, as a sample, and usually at different concentrations, so you can generate a standard curve. Again, the peak areas are related to the known amounts of external standard run. External standards do not correct for losses that may occur during preparation of the sample, such as extraction, centrifugation, evaporation, etc. Internal standards would correct for this if added to the unknown at the beginning of the sample preparation.4
The measurement uncertainty based on the Guide of Uncertainty Measurement (GUM)5 depends on the proper combination of various
sources of uncertainty and therefore the mathematical model used to calculate the appropriate analyte in question, from a calibration curve with external or internal standard.6,7
METHODOLOGY
A certiied reference material (CRM) was analyzed in 5 replicates (different days) as a sample by ion chromatography with external and internal standard calibration.8
Excel spreadsheets were developed to calculate the measurement uncertainty by these two methodologies, based on GUM approach.
The combined standard uncertainty is calculated from the expan-sion of the Taylor series based on the Law of Propagation of Uncer-tainties (LPU). Supposing that the output quantity y^ = f(b1,b2, ..., bn)
depends on n input quantitiesb1,b2, ..., bn, where each bi is described by a distribution of appropriate probability, the combined standard uncertainty assumes the form of Equation 1, when taking into account that the quantities are correlated among themselves:5
(1)
From the effective degrees of freedom (number of terms in a sum less the number of restrictions to the terms of the sum), the required coverage factor, k, is calculated in the t-Student table, by Equation 2:
(2)
And inally, the expanded uncertainty is given by Equation 3: (for a determined level of conidence) (3) Experimental data
The ammonium ion derived from the mainstream smoke of the cigarette is trapped (retained) in 4 mmol L-1 tartaric acid aqueous
solution. Particulate matter is retained in a glass iber ilter, with a diameter of 44 mm, named as Cambridge ilter. The ilter is transferred to plastic lask with a trap solution, and single extraction in ultrasonic bath was performed. After, the extract is iltered in 0.45 µm Millipore hydrophilic membrane and analyzed by ion chromatography equipped with a conductivity detector.
The linearity of this regression has been checked by the residuals analysis.9 The residuals were randomly scattered above and below
the y-axis. External standard
The mathematical model is:
Internal standard versus external standard calibration 985
Vol. 33, No. 4
where: c0= result from the linear calibration curve, µg mL-1; v =
inal volume of the extract, mL; n = number of smoked cigarettes; = bias correction factor.
The relevant uncertainty sources are shown in the cause and effect diagram at Figure 1.
The ive calibration standards are measured once a time each, providing the results in Table 1.
The analyte combined standard uncertainty from the linear cali-bration curve, uc
0 is:
10
(5)
where: S = residual standard deviation, µg mL-1; a = angular
coeficient, mV mL µg-1 s-1; p = number of measurements to
de-termine c0; n = number of measurements for the calibration; c0 = determined ammonium concentration, µg mL-1; –
c = mean value of the different calibration standards (n number of measurements),
µg mL-1; j = index for the number of measurements to obtain the
calibration curve.
Considering the non correlated quantities, the combined standard uncertainties derived from (1), when applied to Equation 4 are:
(6)
(7)
(8)
Internal standard
This approach uses a linear calibration curve built with an internal standard of cesium.
The mathematical model is:
(9) where: Aammonium = area of ammonium in the sample, mV s-1; A
cesium = area of cesium in the sample, mV s-1; C
cesium = cesium concentration in extractive solution, µg mL-1; Vext = extractive solution volume, mL; n = number of smoked cigarettes; a = angular coeficient, mV mL µg-1 s-1; b = linear coeficient, mV s-1; f = =
biascorrection factor.
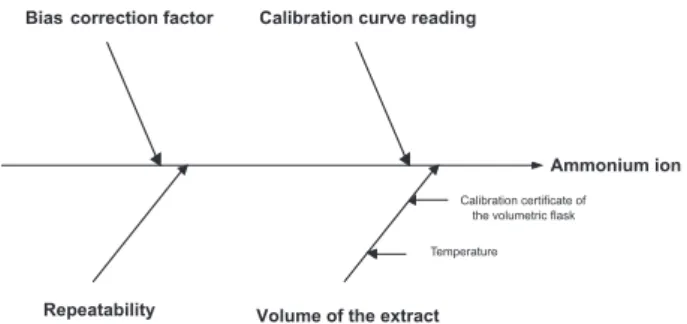
The relevant uncertainty sources are shown in the cause and effect diagram at Figure 2.
The ive calibration standards are measured once a time each, providing the results in Table 2.
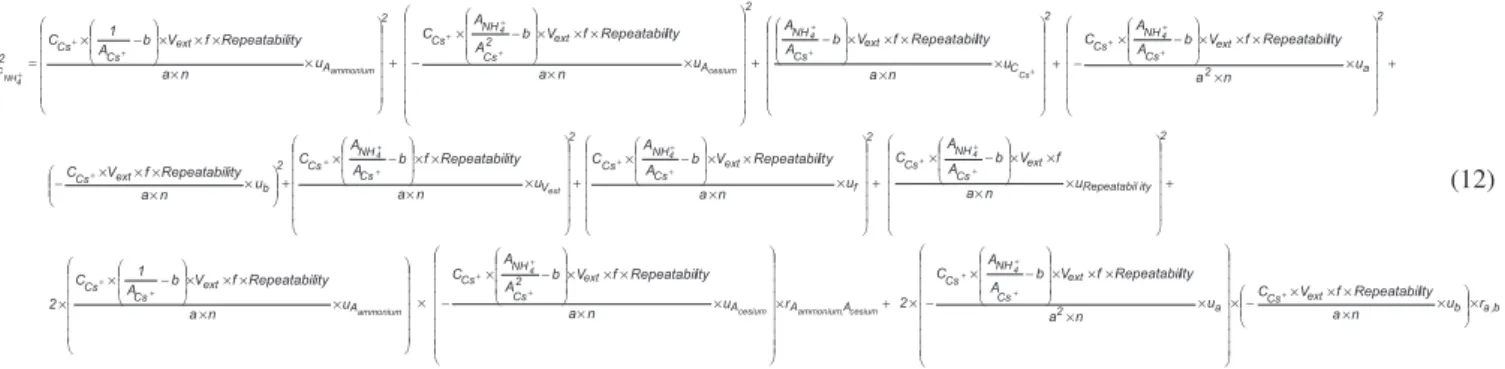
Considering the non correlated quantities, the bias correction uncertainty is given by:
(10)
The combined standard uncertainty, Equations 11 and 12, is cal-culated considering the following correlated quantities: analyte area and internal standard area; angular coeficient and linear coeficient.
(11) Figure 1. Relevant uncertainty sources in ion ammonium determination by
liquid chromatography using external calibration
Figure 2. Relevant uncertainty sources in ion ammonium determination by liquid chromatography using internal calibration
Table 1. External calibration results
Concentration, µg mL-1 Signal,mV s-1
0.261 109
1.003 439
2.481 1096
5.000 2216
10.004 4441
Table 2. Internal calibration results
Concentration ratio Signal ratio
0.02 0.13
0.06 0.48
0.16 1.20
0.31 2.63
de Oliveira et al.
986 Quim. Nova
Table 3. Uncertainty values in ion ammonium determination by liquid chromatography using external calibration
Uncertainty Evaluation of Ammonium Ion - External Standard Quantity Quantity
value
Uncertainty value
Unity Divisor Distribuition Degree of freedom
Sensitivity coeficient, Ci
Standard uncertainy, u(yi) = Ci* ui
Uncertainty u(yi)^2
Contribution
Calibration curve 2.3156 0.0002 mg/mL 1.00 Normal 3 4.586404586 0.000722512 5.22024E-07 0.00% Extract volume –
Reading 20.00
0.02 mL 1.00 Normal ininite 0.531020841 0.010620417 0.000112793 0.02%
Temperature 2 ºC 1.73 Rectangular ininite 0.00230463 0.002661158 7.08176E-06 0.00% Repeatability 1 0.05 - 1.00 Normal ininite 10.62041681 0.531020841 0.281983133 37.86% Bias correction factor 1.146601147 0.073433174 - 1.00 Normal 4 9.262520664 0.680176293 0.46263979 62.12%
Normal 10 Combined standard uncertainty, u c(C)
0.862985122 100.00%
Number of cigarettes 5 Coverage factor, k 2.28
Expanded uncertainty, U(C) 1.97
Ammonium 10.62 mg/cig
Result: C = (10.6 ± 2.0) mg/cig Uncertainty: 18.6%
The expanded uncertainty is reported based on a combined standard uncertainty, multiplied by a coverage factor of k = 2.00, providing a conidence level of approxi-mately 95%.
RESULTS AND DISCUSSION
The results and their expanded uncertainties of ammonium ion in cigarette smoke for the certiied reference material, based on Equa-tions 1 to 3, whose reference value is 10.5 ± 0.5 µg / cigarette (k = 2; 95.45%), are: external standard: 10.6 ± 2.0 µg/cigarette, k = 2.28,
95.45%; internal standard: 10.5 ± 1.5 µg/ cigarette, k = 2.04, 95.45%. Table 3, external standardization, shows that the most relevant uncertainty source is bias correction factor, 62.12%. However, this contribution decreases to 21.36%, when internal standardization is used, Table 4, conirming that this latter approach minimizes losses during the analysis.
Table 4. Uncertainty values in ion ammonium determination by liquid chromatography using internal calibration
Uncertainty Evaluation of Ammonium Ion - Internal Standard Quantity Quantity
value
Uncertainty value
Unity Divisor Distribuition Degree of freedom
Sensitivity coeficient, Ci
Standard uncertainy, u(yi) = Ci* ui
Uncertainty u(yi)^2
Contribution
Aammonium 1022.0000 5 count 1.00 Normal 5 0.010100565 0.050502823 0.002550535 0.49% Acesium 733.5000 13 count 1.00 Normal 5 -0.014073316 -0.182953105 0.033471839 6.48% b -0.0297 0.0331 count 1.00 Normal 5 -7.408764193 -0.244945584 0.059998339 11.61% a 8.3123 0.1028 cig/mg 1.00 Normal 5 -1.268317994 -0.130425183 0.017010728 3.29% Ccesium 16.00 0.24 mg/mL 1.00 Normal ininite 0.658911845 0.157206671 0.024713937 4.78% Vextract 20.00 0.0287 mL 1.00 Normal ininite 0.527129476 0.015149615 0.000229511 0.04% Temperature 2 ºC 1.73 Rectangular ininite 0.002287742 0.002641657 6.97835E-06 0.00% Repeatability 1 0.044 - 1.00 Normal ininite 10.54258952 0.463873939 0.215179031 41.65% Bias correction factor 0.962243402 0.03032 - 1.00 Normal 4 10.95626066 0.332192814 0.110352066 21.36%
Correlation Aammonium & Acesium -0.010794844 10.28%
Correllation a & b 0.063879482
Normal 66 Combined standard uncertainty, u c(C)
0.718747246 100.00%
Number of cigarettes 5 Coverage factor, k 2.04
Expanded uncertainty, U(C) 1.47
Ammonium 10.54 mg/cig
Result: C = (10.5 ± 1.5) mg/cig Uncertainty: 13.9%
The expanded uncertainty is reported based on a combined standard uncertainty, multiplied by a coverage factor of k = 2.00, providing a conidence level of approxi-mately 95%.
Internal standard versus external standard calibration 987
Vol. 33, No. 4
The uncertainty quantiication for internal standardization is collected in Table 4.
CONCLUSIONS
This work conirms that the internal standardization is a more effective technique than external standardization, because lower measurement uncertainty values were obtained, once that the inter-nal standardization corrects more effectively the greater uncertainty source - bias correction factor.
Generally, in order to make easier, for uncertainty evaluation, the quantities are considered non-correlated, which is not always true, as this study shows.
It also observed that the bias correction factor should be consi-dered in cases where it can not be corrected, because otherwise they will calculate the measurement uncertainty in a wrong way. ACKNOWLEDGMENTS
Experimental data were collected thanks to E. I. Muller and his staff from LACAR Regional Product Centre – Souza Cruz S.A.
REFERENCES
1. Cuadros-Rodrigues, L; Bagur-González, M. G.; Sánchez-Viñas, M.; González-Casado, A.; Gómez-Sáez, A. M.; J. Chromatogr., A 2007, 1158, 33.
2. Zenkevich, I. G.; Makarov, E. D.; J. Chromatogr., A 2007, 1150, 117. 3. Skoog, D. A.; Holler, F. J.; Crouch, S. R.; Principles of Instrumental
Analysis: Introduction, Brooks/Cole: Cengage, 1998.
4. Pauls, R. E.; McCoy, R. W.; J. High Resolution Chromatogr.1986, 10, 600.
5. International Standard Organization; Guide to the Expression of Uncer-tainty in Measurement, 1st ed., International Organization for
Standard-ization: Geneva, 1993.
6. Bonnefoy, C.; Menudier, A.; Moesch, C.; Lachâtre, G.; Mermet, J. M.;
J. Anal. At. Spectrom.2002, 17, 1161.
7. Konieczka, P; Namiésnik; J. Chromatogr., A2010, 1217, 882. 8. Vannata, L. E.; Coleman, D. E.; J. Chromatogr., A 2007, 1158, 47. 9. Oliveira, E. C; Aguiar, P. F.; Quim. Nova2009, 32, 1571.
10. EURACHEM; Quantifying uncertainty in analytical measurement, 2nd