Printed in Brazil - ©2004 Sociedade Brasileira de Química 0103 - 5053 $6.00+0.00
A
r
ti
c
le
* e-mail: [email protected]
Photoluminescence Behavior of the Sm
3+and Tb
3+Ions Doped Into the Gd
2
(WO
4)
3Matrix
Prepared by the Pechini and Ceramic Methods
Cláudia A. Kodairaa, Hermi F. Brito*,a, Ercules E. S. Teotonioa, Maria Cláudia F. C. Felintob,
Oscar L. Maltac and Giancarlo E. S. Britod
a
Instituto de Química, Universidade de São Paulo, CP 26077, 05508-900 São Paulo - SP, Brazil
b
Instituto de Pesquisas Energéticas e Nucleares, Av. Lineu Prestes 2242, Cidade Universitária, 05508-970 São Paulo -SP, Brazil
c
Departamento de Química, CCEN, Universidade Federal de Pernambuco, Cidade Universitária, 50670-901 Recife - PE, Brazil
d
Instituto de Física, Universidade de São Paulo, CP 66318, 05315-970 São Paulo - SP, Brazil
Os compostos Gd2(WO4)3:RE
3+ (onde RE = Sm e Tb) preparados via métodos Pechini e
cerâmico foram caracterizados por difratometria de raios-X e espectroscopia de absorção na região do infravermelho. Estes materiais de terras raras apresentam alta intensidade luminescente, laranja para os compostos de Sm3+ e verde para os de Tb3+, quando excitados com radiação UV. Os
espectros de excitação dos compostos mostraram bandas largas oriundas da transferência de carga ligante-metal (O→W e O→RE3+) e bandas estreitas associadas às transições intraconfiguracionais
(4f-4f). Os espectros de excitação do sistema com Tb3+ também exibiram bandas largas atribuídas à
transição interconfiguracional (4f-5d). Quando os espectros de emissão dos compostos contendo Sm3+ e Tb3+ são obtidos com excitação no íon observa-se somente transições finas 4G
5/2→ 6H
J (J =
5/2, 7/2, 9/2 e 11/2) e 5D 4→
7F
J (J = 0-6). Por outro lado, quando a excitação é monitorada na banda
de transferência de carga (BTC, 270 nm) são também observadas bandas largas atribuídas a BTC (O→W). Os parâmetros de intensidade experimentais, ηSm e ηEu, apresentaram comportamentos
similares, sugerindo que o íon Sm3+ encontra-se em um ambiente químico altamente polarizável e
que o caráter covalente da interação metal–ligante é semelhante àquele do sistema tungstato de európio. O processo de relaxação cruzada baseado nos níveis 5D
3 e 5D
4 do sistema Gd2(WO4)3:Tb 3
foi reportado.
The Gd2(WO4)3:RE3+ compounds (where RE3+ = Sm and Tb) were prepared by the Pechini and
ceramic methods and characterized by X-ray diffraction and infrared spectroscopy. These rare earth materials present high orange (Sm3+-compound) and green (Tb3+-compound) luminescence intensity
under UV radiation. The excitation spectra of these compounds presented broad bands arising from ligand-to-metal charge transfer (O→W and O→RE3+) and narrow bands from 4f-intraconfigurational
transitions. The excitation spectra of Tb3+ system also exhibit broad bands attributed to the
interconfigurational transition (4f-5d). The emission spectra exhibited the 4G 5/2→
6H
J (J = 5/2, 7/2,
9/2 and 11/2) and 5D 4→
7F
J (J = 0-6) transitions (direct excitation), for the systems doped with Sm 3+
and Tb3+, respectively, while a broad band assigned to the LMCT (O→W) is observed when the
excitation is monitored on the O→W LMCT state around 270 nm. The experimental intensity parameters ηSm and ηEu present similar behaviors, suggesting that the Sm
3+ ion is in a highly polarizable
chemical environment with similar covalent character of the metal-donor atom interaction to the tungstate doped europium system. The cross-relaxation process from the 5D
3 to the 5D
4 levels of the
Gd2(WO4)3:Tb
3+ system has been also reported.
Introduction
The optical properties of trivalent rare earth ions (RE3+) in tungstate materials, with scheelite (CaWO4) structure, have been widely investigated.1-7 The motivation for these studies has been based on their technological applications as phosphor materials in fluorescent lamps, cathode ray tubes and X-ray intensifying screens.
Since the first europium tungstate was prepared from Eu2O3 and tungstic acid precursors at 1000 ºC its luminescent properties7,8 and crystal structure of Eu2O3.3WO3 9 have been studied. This europium system has been synthesized in different ways that generally involve high temperatures and/or a long time of heating samples. In the last decade, several low temperature preparation techniques were used to prepare fine particle systems such as co-precipitation,10 sol-gel method11 and hydrothermal synthesis.12 Recently we have reported the preparation, characterization and photoluminescent studies of the RE2(WO4)3 system (where RE = La, Eu and Gd), which was produced by the Pechini method.13-15
The electronic spectra of the RE3+ ions present narrow and low intensity bands due to the shielding of the 4f electrons from ligand field effects by the electrons of the filled 5s and 5p sub-shells.16 The Sm3+ ion has an odd electron configuration ([Xe] 4f5) labeled as a Kramer’s ion, which requires that the electronic states of this ion be at least doubly degenerate by the ligand-field for any chemical environment.17 For all 4fN configurations with odd N, the maximum number of the crystal field components for Kramer’s ions with 2S+1L
J state is J+1/2 for any symmetry lower than cubic.18 Generally, the Sm3+ ion has only detectable absorption transitions below 500 nm, considering that the 6H
5/2→ 6P
3/2 transition (~ 400 nm) has the highest intensity, and consequently this rare earth ion displays a (pale) yellow color.19 In the case of the Tb3+ ion, the absorption spectra exhibit only weak bands from the 7F
6→ 5D
4 transition (~487 nm) in the visible range, which has no influence on the color of Tb3+ compounds. On the other hand, the 4G
5/2→ 6H
9/2 (~ 640 nm) and 5D
4→ 7F
6 (545 nm) hypersensitive transitions are mainly responsible for the orange and green monochromatic emission colors of the Sm3+ and Tb3+ ions, respectively.
In the present investigation, we report the preparation of the Gd2(WO4)3:RE3+ (RE = Sm and Tb) compounds using the Pechini method, based on polyesterification between citric acid and ethylene glycol, according to the procedures used for the Eu2(WO4)3,13 La
2(WO4)3:Eu 3+ and
Gd2(WO4)3:Eu3+ systems.14 This preparation method is known due to the low cost and versatility, producing the desired compound at reduced temperatures in contrast to
the conventional ceramic method. For the purpose of comparison, a conventional ceramic method was used for preparing the Gd2(WO4):RE3+ (RE = Sm and Tb) compounds. The photoluminescence properties of the systems prepared by the ceramic method were also investigated.
Experimental
The Gd2(WO4)3 matrix doped with Sm3+ and Tb3+ ions were prepared by the Pechini method as described in references 13 and 14 using the following materials: ammonium tungstate (99.999%, Acros), RE2O3 (RE = Gd, Sm and Tb) (99.99%, Aldrich), ethylene glycol and citric acid (99.5%, Merck). The Sm3+ and Tb3+ ions were doped into Gd2(WO4)3 matrix in a concentration of 5 mol%. The obtained resin was heated at 450 ºC for 2 h, resulting in a black product, which was grounded into a powder and heated at 750 ºC for 4 h. For the sake of comparison, the Gd2(WO4)3:RE3+ systems (RE = Sm and Tb) were also prepared by the ceramic method,20,21 which consists in grinding and sintering the sample twice containing a stoichiometric mixture of WO3 (prepared from the heating of ammonium tungstate, at 450 ºC for 2 h), Gd2O3 and the corresponding rare earth oxide (Sm2O3 or Tb2O3) in alumina crucibles at 900 ºC for 24 h.
Infrared data were recorded on a Bomem MB 100 spectrometer by averaging 96 scans with a resolution of 4 cm-1. Samples were physically mixed with KBr and pressed into self-supporting pellets. These measurements were made at room temperature in the spectral range from 4000 to 350 cm-1.
The X-ray diffraction patterns of the samples were recorded using a powder goniometer (Philips diffracto-meter model X’PERT-MPD), Ni filtered CuKα radiation (40 kV and 40 mA), between 2 < 2θ < 70°, in step-scanning mode (0.6°/min).
The excitation and emission spectra of the Gd2(WO4)3:RE3+ system were recorded at room and liquid nitrogen temperatures collected at an angle of 22.5o (front face) in a spectrofluorimeter (SPEX-Fluorolog 2) with double grating 0.22 m monochromator (SPEX 1680) using a 450 W Xenon lamp as the excitation source. The luminescence decay curves were recorded at 298 K using the phosphorimeter (SPEX 1934D) accessory coupled with the spectrofluorimeter.
Results and Discussion
et al. J. Braz. Chem. Soc.
La2(WO4)3 and Ce2(WO4)3 compounds, suggesting a Td
symmetry with two non-equivalent [WO4] units.22 There is a great similarity between the spectra of the compounds, considering the 950-650 cm-1 region corresponding to the symmetric stretching of the O-W bond, the 830-530 cm-1 interval that presents anti-symmetric stretching and the 470-370 cm-1 region that displays bands due to the bending modes of the O-W bonds.
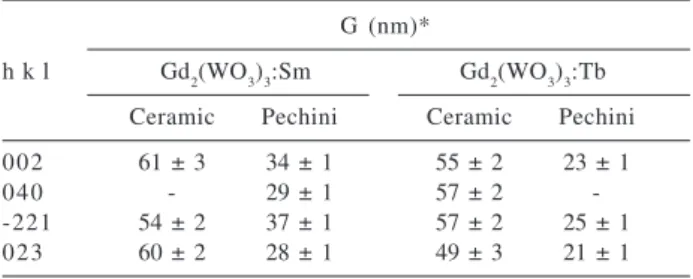
The X-rays diffraction patterns of the Gd2(WO4)3 matrix doped with Sm3+ and Tb3+ ions (figure not shown) obtained by the Pechini and ceramic methods present characteristic lines of standard compound with a monoclinic (pseudo-orthorhombic) lattice.9 according to the JCPDS card #23-1076. No peaks assigned to the Gd2O3 and WO3 compounds could be observed, indicating that the Gd2(WO4)3 compound was obtained with high purity. The diffraction lines were characteristics of a policrystalline compound. The average crystallite sizes (developed along [002], [040], [-221] and [023] directions) were estimated using the Scherrer formula.23 The errors bars were determined as a function of the adjusted full width at half maximum (FWHM) in a fitting procedure for each analyzed peak. The values of crystallite sizes of the Gd2(WO4)3:RE3+ system prepared by the Pechini method (~ 30 nm) are smaller than those prepared by the ceramic one (~ 60 nm) (Table 1).
Photoluminescence investigation
The excitation spectra of the Gd2(WO4)3:Sm3+ compound prepared by the Pechini and ceramic methods are shown in Figures 1a and 1b, respectively. These photoluminescence measurements were recorded at 77 K in the spectral range from 250 to 590 nm, with emission monitored on the hypersensitive 4G
5/2→ 6H
9/2 transition (around 643 nm). In the case of the Sm3+ compound prepared by the Pechini method, the excitation spectrum displays a high intensity broad band around 275 nm and an overlapped low intensity band around 310 nm attributed to O→W13 and O→Sm LMCT transitions, respectively. Besides, this excitation spectrum also contains narrow
bands assigned to the 4f5 intraconfigurational transitions characteristic of the Sm3+ ion (Table 2).
The excitation spectrum of the Gd2(WO4)3:Sm3+ system prepared by the ceramic method (Figure 1b) shows a broad band in the range 255-340 nm corresponding to the O→W and O→Sm LMCT with maxima at around 275 and 310 nm, respectively. The LMCT band for the system prepared by the ceramic method (Figure 1b) has higher intensity than the one prepared by the Pechini method and it is also observed the presence of narrow bands arising from the Sm3+ ion corresponding to the 6H
5/2→ 2S+1L
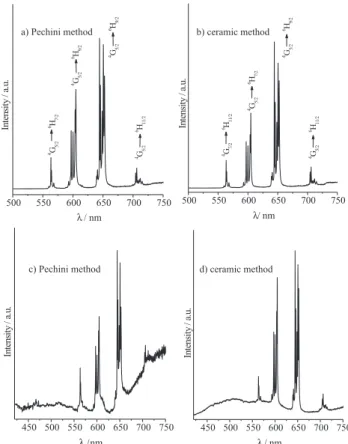
J transitions. The emission spectra of the Sm3+-doped compounds (Figure 2), at 77 K, in the range of 500-750 nm, recorded under excitation at 404 nm, obtained by the Pechini (Figure 2a) and ceramic (Figure 2b) methods, present similar profiles. These spectra show only the bands due to 4f-4f transitions arising from the 4G
5/2 emitting level. The relatively high intensity bands are those arising from the 4G
5/2→ 6H
J transitions (where J = 5/2, 7/2, 9/2 and 11/2), which are split in the maximum number of (J+1/2) components, indicating that the Sm3+ ion occupies a site with low symmetry. It is also observed that the forced electric dipole 4G
5/2→ 6H
9/2 transition presents the highest relative emission intensity at 643 nm.
As it can be seen, the emission spectra of the Gd2(WO4)3:Sm3+ compound recorded at 77 K (Figures 2c and 2d) monitoring the excitation on the O→W LMCT band (265 nm), show a broad band between 400 and 550 nm, with maximum at 500 nm, due to the tungstate emission. The presence of this band indicates that the energy transfer from the tungstate group to the Sm3+ ion is not efficient when the excitation is monitored on the LMCT band. The narrow bands assigned to the intraconfigurational-4f5 transitions are also observed in those spectra (Figures 2c and 2d).
Figure 1. Excitation spectra of the Gd2(WO4)3:Sm3+ compound with emission monitored at 643 nm at liquid nitrogen temperature pre-pared by methods a) Pechini (750 oC) and b) ceramic (900 oC).
Table 1. Average crystallite sizes for the Gd2(WO3)3:RE system (RE = Sm3+ and Tb3+) developed second [h k l] directions determined by the Scherrer formula 23
G (nm)*
h k l Gd2(WO3)3:Sm Gd2(WO3)3:Tb
Ceramic Pechini Ceramic Pechini
002 61 ± 3 34 ± 1 55 ± 2 23 ± 1
040 - 29 ± 1 57 ± 2
--221 54 ± 2 37 ± 1 57 ± 2 25 ± 1
The experimental intensity parameters (ηSm) of the Gd2(WO4)3:Sm3+ system were determined and compared with those obtained for the Sm-complexes,24 where η
Sm is the ratio between the intensities of the 4G
5/2→ 6H
9/2 and 4G
5/2→ 6H
5/2 transitions (Table 3). The 4G
5/2→ 6H
5/2 transition is taken as the reference due to its predominant magnetic dipole character. On the other hand, the hypersensitive 4G
5/2→ 6H
9/2 transition is forbidden by magnetic-dipole and allowed by forced electric-dipole. Additionally, the
ηSm values were compared to the experimental intensity parameter ηEu for the Gd2(WO4)3:Eu
3+ compound prepared
by both methods,6,14 where the η
Eu parameter is the ratio
between the area under the curves of the hypersensitive transition 5D
0→ 7F
2 allowed by forced electric-dipole and the 5D
0→ 7F
1 transition allowed by magnetic-dipole. The
ηSm values for the Gd2(WO4)3:Sm
3+ compound obtained by
the Pechini (ηSm = 9.60) and ceramic method (ηSm = 9.81) are very close indicating that the Sm3+ ion is in a similar polarizable chemical environment in both Sm3+ compounds. Besides, it was observed a correlation between the values of ηSm and ηEu suggesting that the Sm
3+ ion is in
a similar polarizable environment and that the covalent character of the metal-donor atom interaction is also similar for these ions. Comparing the values of the ηSm and ηEu Table 2. Energy levels (in cm-1) for the intraconfigurational transitions of the Sm3+ and Tb3+ ions in the Gd
2 (WO4)3 matrix prepared by the ceramic method
Gd2 (WO4)3:Sm3+ Gd
2(WO4)3:Tb 3+
Transition Energy (cm-1) Transition Energy (cm-1) Transition Energy (cm-1)
Excitation Excitation 5D
4→ 7F 5 18429 6H 5/2→ 7F
6→ 18389
4D 7/2,
4D
9/2 28943 23923 18362
4D 3/2,
4P
5/2 28169
5H
7 29411 18281
27548 5L
6 28490 18261
4D 1/2, 4L 17/2, 6P 7/2 26560 5L 9, 5G
4 27894 18228
4H 11/2, 6M 15/2, 4M 21/2 25477 5G
5 27027 18188
6P 3/2, 4F 7/2, 4L 13/2 24721 5L 10 6490 4M 19/2, 6P 5/2 23923 5G 6 20491 5D 4→ 7F 4 17217 4I 15/2, 4G 9/2, 4M
17/2 22701 17199
22497 Emission 24236 17170
22099 5D
3→ 7F
6 24177 17111
4I
13/2 21574 24026 17047
4I
9/2 21119 17018
20811 23009 16983
20470 5D
3→ 7F
5 22967 16897
4G
7/2 20000 22883 16852
4F
3/2 18867 22831
22789 5D
4→ 7F
3 16239
Emission 22665 16196
4G 5/2→
6H
5/2 17749 16123
17724 5D
3→ 7F
4 21987 16103
17605 21929 16072
21872 16046
4G 5/2→
6H
7/2 16750 21834
16666 5D
4→ 7F
2 15571
16567 5D
3→ 7F
3 21312 15527
16534 21168 15508
21061 15489
4G 5/2→
6H
9/2 15523 21034 15375
15484 15323
15417 5D
3→ 7F
2 20798 15234
15370 20755
15328 20721 5D
4→ 7F 1 14992 14929 4G 5/2→ 6H 11/2 14196 5D 4→ 7F
6 20508 14912
14164 20458
14120 20408 5D
4→ 7F
0 14766
14076 20366 14710
14048 20259
et al. J. Braz. Chem. Soc.
parameters with those for other RE3+-complexes it is observed that the chemical environment around the rare earth ions in the tungstate systems is less polarizable than in the [RE(TTA)3(PTSO)2] complex.24
In the present investigation, the excitation spectra of the Gd2(WO4)3:Tb3+ system prepared by the Pechini and ceramic methods were also obtained at 77 K in the spectral range from 250 to 520 nm, under emission at 544 nm (Figure 3). The spectrum of the Tb3+-doped tungstate (Figure 3a) prepared by the Pechini method displays two broad bands around 290 and 370 nm attributed to (O→WI) and (O→WII) LMCT, respectively. On the other hand, the spectrum of the sample prepared by ceramic method (Figure 3b) shows
two broad high intensity bands in the range 250-320 nm with maxima at 265 and 290 nm attributed to O→WI LMCT state and 4f8→5f75d transitions from the terbium ion, respectively. The later transition (at around 320 nm) in Figure 3a is overlapped with the broad band arising from LMCT state. The excitation spectrum (Figure 3a) presents narrow bands arising from the 7F
6→ 2S+1L
J transitions of Tb3+ ions (Table 2), which are overlapped with that broad band around 350 nm. As it can be seen, the narrow bands from the 4f-4f transitions of the rare earth ion (Figure 3b) are more defined for the system prepared by the ceramic method than for the Pechini one.
Figure 4a shows the emission spectrum of the Gd2(WO4)3:Tb3+ system prepared by the ceramic method, under excitation in the 7F
6→ 5G
6 transition (at 378 nm). This spectrum exhibits sharp emission bands, in the spectral range from 485 to 720 nm, which are attributed to the intraconfigurational 5D
4→ 7F
J transitions (where J = 0-6). Additionally, the emission spectrum of the Gd2(WO4)3:Tb3+ system (Figure 4a) presents, in the interval between 400 and 475 nm, a series of weak bands originated from the 5D
3 excited level to the 7F
J, where J= 2, 3, 4, 5 and 6 (Table 2). The emission spectra of the Gd2(WO4)3:Tb3+ system prepared by the Pechini method (figure not shown), under excitation at 378 nm, present similar spectral profile to that from the ceramic method (Figure 4a), exhibiting emission bands arising from both emitting 5D
3 and 5D
4 levels.
It is interesting to observe that the 5D 3→
7F
J transitions are not exhibited in the emission spectrum of the Tb(WO4)3 system (Figure 4b). Thus, in order to explain the presence of the bands arising from the 5D
3→ 7F
J transitions in the spectra of the Tb-doped systems, it is made a comparative study between the emission spectrum of the undoped, Tb2(WO4)3, and Tb-doped compounds prepared by the
Table 3. Experimental intensity parameters for the Gd2(WO4)3:RE3+ systems and [RE(TTA)3(PTSO)2] complexes (RE3+ = Sm and Eu)
Compound ηSm ηEu
[RE(TTA)3(PTSO)2]a 13.37 20.85
Gd2(WO4)3:RE3+(ceramic method) 9.81 10.13 Gd2(WO4)3:RE3+(Pechini method) 9.60 9.84
a TTA = thenoyltrifluoroacetonate and PTSO = p-tolyl sulfoxide.24
Figure 3. Excitation spectra of the Gd2(WO4)3:Tb3+ compound with emission monitored at 544 nm at liquid nitrogen temperature pre-pared by methods a) Pechini (750 oC) and b) ceramic (900 oC). Figure 2. Emission spectra of the Gd2(WO4)3:Sm3+ compound
ceramic method at 900 oC (Figures 4a and 4b). It is interesting to report that the spectrum of the compound that has highest concentration of the Tb3+ ions there are no narrow bands arising from the emitting 5D
3 level. These results indicate that the non-radiative decay from the 5D
3 to the 5D
4 state via cross-relaxation process plays an important role in the deactivation in the 5D
3 emitting state, which can be explained on the basis of the luminescence quenching and the energy gaps between the emitting 5D
3 -5D
4 levels and 7F
6 - 7F
0 levels. 25,26
It is interesting to notice that the Gd2(WO4)3:Tb3+ system prepared by the Pechini method when excited in the O→W LMCT transition (around 270 nm) presents the bands arising from 5D
3,4→ 7F
J (J = 0-6) transitions and a broad band with maximum at about 500 nm (Figure 4c). On the other hand, the emission spectrum of this system prepared by the ceramic method (Figure 4d) exhibits only those sharp bands assigned to the 5D
3,4→ 7F
J transitions of the Tb3+ ion. This suggests that the energy transfer from the tungstate group to the rare earth ion is more efficient for the doped system prepared by ceramic method.
Conclusions
The Gd2(WO4)3:RE3+ (RE = Sm and Tb) systems prepared by the Pechini method present average crystallite sizes approximately twice smaller than those prepared via
the ceramic method. The excitation spectra of the same systems present different broad bands assigned to the O→W LMCT state. These results could be used as an advantageous tool when a different excitation wavelength is required in the production of a new efficient emission from the Sm3+ and Tb3+- doped tungstate phosphors, since the Pechini method allows the preparation of the compound at reduced temperatures in contrast to the conventional method (ceramic). The experimental intensity parameters (ηSm) show the similar hypersensitive character of the 4G
5/2→ 6H
9/2 transition in the Sm
3+-compound
prepared by both methods. The presence of the transitions arising from emitting 5D
3 level of the doped system, Gd2(WO4)3:Tb3+, which are absent in the undoped compound [Tb2(WO4)3], suggest that the cross-relaxation process is operative when the Tb3+ concentration is increased.
Acknowledgements
We thank the Brazilian agencies FAPESP (Fundação de Amparo à Pesquisa do Estado de São Paulo) and CNPq/ RENAMI (Conselho Nacional de Desenvolvimento Científico e Tecnológico/Molecular and Interfaces Nanotechnology Research Network) for financial support.
References
1. Strek, W.; Bednarkiewicz, A.; Derén, P.J.; J. Lumin. 2001, 92, 229.
2. Nosenko, A.; Kostyk, L.; Koslovs’ka, L.; J. Lumin. 2000, 90, 49.
3. Do, Y.R.; Huh, Y.D.; J. Electrochem. Soc. 2000, 147, 4385. 4. Shi, F.; Meng, J.; Ren, Y.; Su, Q.; J. Phys. Chem. Solids 1998,
59, 105.
5. Makalik, L.; Hanuza, J.; Makalik, B.; Strek, W.; Legendziewicz,
J.; Eur. J. Solid State Inorg. Chem. 1996, 33, 397.
6. Huang, J.; Loriers, J.; Porcher, P.; J. Solid State Chem. 1983,
48, 333.
7. MacDonald, R.E.; Vogel, M.J.; Brookman, J.W.; IBM J. Res.
Develop. 1962, 6, 363.
8. Borchardt, H.J.; J. Chem. Phys. 1963, 39, 504. 9. Templeton, D.H.; Zalkin, A.; Acta Cryst. 1963, 16, 762. 10. Safari, A.; Lee, Y.H.; Halliyal, A.; Newnham, R.E.; Am. Ceram.
Soc. Bull. 1987, 66, 668.
Figure 4. Emission spectra of the Tb3+-compounds prepared by the ceramic method (900 oC), recorded at 77K, with excitation moni-tored at 378 nm a) Gd2(WO4)3:Tb3+ and b) Tb
et al. J. Braz. Chem. Soc.
11. Paris, E.C.; Leite, E.R.; Longo, E.; Varela, J.A.; Mater. Lett.
1998, 37, 1.
12. Millar, C.E.; Pedersen, L.; Wolny, W.W.; Ferroelectrics 1992,
133, 271.
13. Kodaira, C.A.; Brito, H.F.; Malta, O.L.; Serra,O.A.; J. Lumin. 2003, 101, 11.
14. Kodaira, C.A.; Brito, H.F.; Felinto, M.C.F.C.; J. Solid State Chem. 2003, 171, 401.
15. Rambabu, U.; Khanna, P.K.; Buddhudu, S.; Mater. Lett. 1999,
38, 121.
16. Reisfeld, R.; Gaft, M.; Saridarov, T.; Panczer, G.; Zelner, M.;
Mater. Letters 2000, 45, 154.
17. May, P.S.; Metcalf, D.H.; Richardson, F.S.; Carter, R.C.; Miller, C.E.; Palmer, R.A.; J. Lumin. 1992, 51, 249.
18. Beaury, L.; Hölsa, J.; Korventausta, J.; Krupa, J.C.; Lamminnäki, R.J.; Porcher, P.; Rahiala, H.; Säilynoja, P.E.;
Acta Phys. Polonica A 1997, 90, 1203.
19. Binnemans, K.; Görller-Walrand, C.; Chem. Phys. Lett. 1995,
235, 163.
20. Amosov, V.M.; Plyushchev, V.E.; Russ.J. Inorg. Chem. 1967,
2(5), 595.
21. Nassau, K.; Levinstein, H.; Loiacono, G. M.; J. Phys. Chem.
Solids1965, 26, 1805.
22. Burcham, L.J.; Wachs, I.E.; Spectrochim. Acta Part A1998,
54, 1355.
23. Santilli, C.V.; Pulcinelli, S.H.; Brito, G.E.S.; Briois, V.; J. Phys.
Chem. B1999, 103, 2660.
24. Brito, H.F.; Malta, O.L.; Felinto, M. C. F. C.; Teotonio, E.E.S.; Menezes, J.F.S.; Silva, C.F.B.; Tomiyama, C.S.; Carvalho, C.A.A.; J. Alloys Comp. 2002, 344, 293.
25. Berdowski, P.A.M.; Lammers, M.J.J.; Blasse, G.; Chem. Phys.
Lett.1985, 113, 387.
26. Wakefield, G.; Keron, H.A.; Dobson, P.J.; Hutchison, J.L.; J.
Phys. Chem. Solids 1999, 60, 503.
Received: February 17, 2004 Published on the web: November 5, 2004